. 2023 Oct;622(7983):562-573.
doi: 10.1038/s41586-023-06604-5. Epub 2023 Sep 6.

Complete human day 14 post-implantation embryo models from naive ES cells

Affiliations

Complete human day 14 post-implantation embryo models from naive ES cells

Bernardo Oldak et al. Nature. 2023 Oct.

Abstract

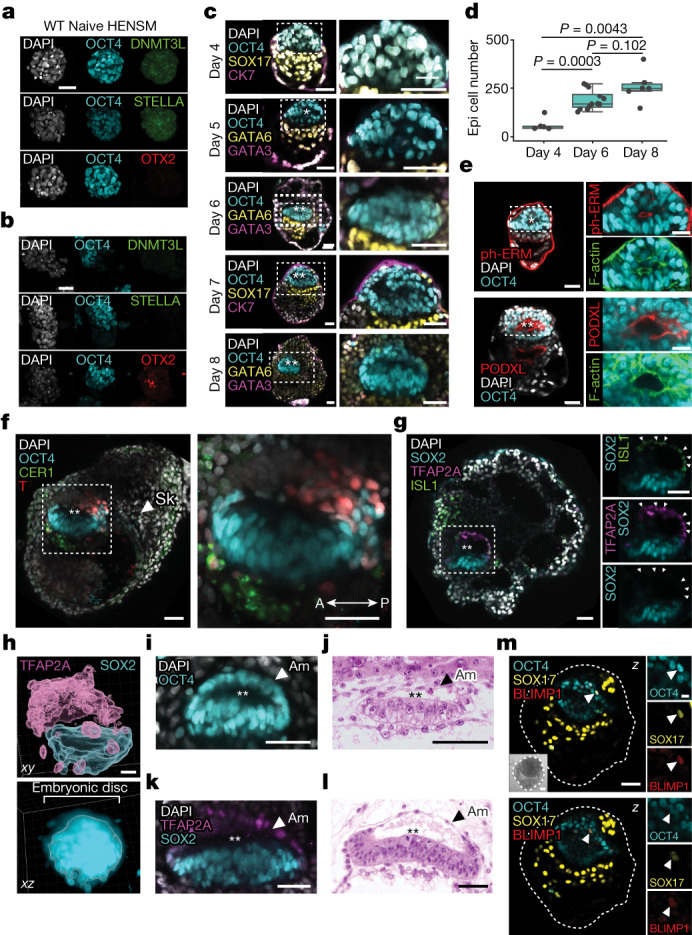
The ability to study human post-implantation development remains limited owing to ethical and technical challenges associated with intrauterine development after implantation1. Embryo-like models with spatially organized morphogenesis and structure of all defining embryonic and extra-embryonic tissues of the post-implantation human conceptus (that is, the embryonic disc, the bilaminar disc, the yolk sac, the chorionic sac and the surrounding trophoblast layer) remain lacking1,2. Mouse naive embryonic stem cells have recently been shown to give rise to embryonic and extra-embryonic stem cells capable of self-assembling into post-gastrulation structured stem-cell-based embryo models with spatially organized morphogenesis (called SEMs)3. Here we extend those findings to humans using only genetically unmodified human naive embryonic stem cells (cultured in human enhanced naive stem cell medium conditions)4. Such human fully integrated and complete SEMs recapitulate the organization of nearly all known lineages and compartments of post-implantation human embryos, including the epiblast, the hypoblast, the extra-embryonic mesoderm and the trophoblast layer surrounding the latter compartments. These human complete SEMs demonstrated developmental growth dynamics that resemble key hallmarks of post-implantation stage embryogenesis up to 13-14 days after fertilization (Carnegie stage 6a). These include embryonic disc and bilaminar disc formation, epiblast lumenogenesis, polarized amniogenesis, anterior-posterior symmetry breaking, primordial germ-cell specification, polarized yolk sac with visceral and parietal endoderm formation, extra-embryonic mesoderm expansion that defines a chorionic cavity and a connecting stalk, and a trophoblast-surrounding compartment demonstrating syncytium and lacunae formation. This SEM platform will probably enable the experimental investigation of previously inaccessible windows of human early post implantation up to peri-gastrulation development.


Conflict of interest statement

J.H.H. together with B.O., E.W., V.B., A.A.-C., N.N., S.V., S.T., C.J., T.S. and F.R. submitted (through Yeda–Weizmann Institute of Science) patent applications relevant to the findings and technologies reported and media compositions utilized herein: (1) “Isolated naive pluripotent stem cells and methods of generating same” filed on 23 April 2013 (EP 61/814,920); (2) “Media for culturing naive pluripotent stem cells” filed on 30 July 2014 (EP 62/030,792); (3) “Culture media for pluripotent stem cells” filed on 23 January 2020 (EP 62/795,626); (4) “Methods and devices for ex-utero mouse embryonic development” (for natural and synthetic embryos) filed on 16 March 2021 (EP 281,561); (5) “Methods of generating a synthetic embryo” (for mouse and human SEMs/synthetic embryo models) filed on 6 March 2022 (EP 63/317,036). J.H.H. is a co-founder and chief scientific advisor of Renewal Bio, which has licensed technologies described herein and co-funded some parts of this project. RSeT defined human naive-like pluripotency growth medium was licensed and commercialized by Stem Cell Technologies based on some of the indicated patents/patent applications above (RSeT is the commercialized version of NHSM growth medium originally generated and patented by J.H.H. and N.N). The remaining authors declare no competing interests.

Figures

Fig. 1
Fig. 1. Optimizing human naive ES cell differentiation towards extra-embryonic lineages competent for early post-implantation SEM generation.
a, Scheme of the tested induction (iGATA4, iGATA6, iCDX2 and iGATA3) and media conditions for generating the three different extra-embryonic lineages constituting the post-implantation human embryo (right) from HENSM naive PS cells (nPS cells). Epiblast (cyan), hypoblast (yellow), ExEM (grey) and trophoblast (magenta) compartments. b, Schematic (top) and FACS plots (bottom) of PDGFRA versus SSC for PrE-like and ExEM-like (PrE/ExEM) cell induction using iGATA4 with doxycycline (DOX) in HENSM after 6 days (right) and the control condition of naive cells (WT cells without iGATA4, left). c, Scheme (top) and FACS plots (bottom) of PDGFRA versus SSC for PrE/ExEM-like cell induction using iGATA4 and iGATA6 with DOX for 6 days in different media conditions as indicated (C10F4PDGF, RACL or RCL). d, Scheme (top) and FACS plots (bottom) of PDGFRA for PrE/ExEM-like cells using WT nES cells induced for 6 days in different media conditions (N2B27, RCL or RCL for 3 days followed by 3 days of N2B27). e, Immunofluorescence images of WT nES cells (WIBR3 line) induced for 6 days in RCL medium for SOX17, BST2 and nuclei (DAPI). Outline indicates mutually exclusive expression pattern of SOX17 and BST2. f, Scheme (top) and FACS plots (bottom) of ENPEP against TACSTD2 for TE-like lineage induction of HENSM nES cells (WIBR3 line) using the BAP(J) regimen for 3 days. g, Immunofluorescence images of day 6 SEM aggregates stained for OCT4, SOX17 and SDC1. The TE regimens used for SEM are indicated. Scale bars, 100 µm.
Fig. 2
Fig. 2. Self-assembly of human post-implantation SEM exclusively from non-transgenic naive ES cells.
a, Left to right, CS images reproduced from ref. (courtesy of the Virtual Human Embryo) and schemes of early post-implantation human embryos at CS5a (7–8 d.p.f.), CS5b (9–10 d.p.f.), CS5c (11–12 d.p.f.) and CS6a (13–14 d.p.f.). b, Scheme of the human SEM protocol (Methods). PrE/ExEM-like (yellow/grey), epiblast-like (cyan) and trophoblast-like (magenta) lineage priming for 3 days from nPS cells in HENSM is followed by aggregation (day 0 (D0)) in N2B27. From day 3, SEMs are cultured in non-adherent 6-well plates on an orbital shaker in hEUCM2. c, Representative bright-field (BF) images of day 0–8 SEMs showing growth and formation of the embryonic structures, defined by lineage-specific immunofluorescence (Extended Data Fig. 6b). d, Right to left, representative immunofluorescence images (top) and schematics (bottom) of SEMs from days 4, 6 and 8 showing OCT4, SOX17, CK7 and nuclei (DAPI). d.p.f. values are approximate. e, Quantification of the protocol efficiency for WIBR3 (left) and WIBR1 (right) ES cell lines according to the morphological criteria (Methods). For WIBR3, N = 3 across 232, 344 and 344 aggregates; for WIBR1, N = 3 across 866, 1,222 and 960 aggregates. Bars show mean values, whiskers mark the s.d. f, Top, 3D reconstruction of the day 8 SEM shown in d (right) with segmented (segm) epiblast-like and hypoblast/YS-like compartments. Middle, segmentation of the epiblast-like and hypoblast/YS-like compartments shown in 0 and 90° degrees of rotation. Bottom, image section of the day 8 SEM shown in d (right). AC, amniotic cavity; Am, amnion; Epi, epiblast; Hb, hypoblast; L, lacunae; Sk, stalk; Tb, trophoblast. Scale bars, 30 µm (f, bottom), 50 µm (c (days 3–8),d,f (top and middle)) or 200 µm (c, days 0–2). Source Data
Fig. 3
Fig. 3. Human SEMs undergo epiblast morphogenesis and form a bilaminar disc-like structure.
a,b, Representative immunofluorescence images of ES cells in HENSM (a) and day 3 SEMs in N2B27 (b) stained for OCT4, DNMT3L, OTX2 and STELLA. c, Left, images of day 4–8 SEMs showing epiblast-like (OCT4), hypoblast-like (SOX17), hypoblast/ExEM-like (GATA6) and trophoblast-like (CK7, SDC1 or GATA3) compartments. Right, zoom-in images. d, Epiblast-like cell numbers in successfully developed SEMs from day 4 (N = 1, n = 5), day 6 (N = 3, n = 12) and day 8 (N = 3, n = 6). Whiskers extend 1.5× the interquartile range (box) around the median line. P values, two-sided Mann–Whitney U-test. e, Images of day 6 SEMs showing phospho-ezrin, radixin and moesin (ph-ERM; top), podocalyxin (PODXL; bottom) and F-actin. f, Image of a day 8 SEM with the anterior–posterior (A–P) axis with T/BRA (red) in epiblast-like compartment (OCT4) opposite to CER1+ AVE in the anterior Hb. Right, zoom-in image. g, Image of a day 8 SEM with TFAP2A+, ISL1+ and SOX2 amnion-like cells (arrowheads on the right). h, 3D segmentation of the amnion-like (TFAP2A) and the embryonic disc-like (SOX2) compartments in day 8 SEM. xy and xz views. i, Image of an amnion-like structure in a day 7 SEM with squamous OCT4+ cells. j,l, CS5c (j) and CS6a (l) histological sections reproduced from ref. . Amnion-like cells indicated by arrowheads. k, Image of squamous TFAP2A+ and SOX2 amnion-like cells in day 8 SEMs. m, Images of day 8 SEMs (z slices n = 22 (top) and 26 (bottom)). Right, zoom into the OCT4+SOX17+BLIMP1+ PGC-like cells (arrowheads). Inset, BF image. The SEM perimeter is outlined. Single and double asterisks mark proamniotic-like and amniotic-like cavities, respectively. Nuclei were stained using DAPI. Scale bars, 10 µm (m, right), 25 µm (e, right), 20 µm (h) or 50 µm (all other images). Source Data
Fig. 4
Fig. 4. Human SEMs recapitulate YS-like lumenogenesis and SEM scaffolding by ExEM-like cells.
a, Representative immunofluorescence image of a day 6 SEM showing YS-like, PE-like and VE-like (SOX17) compartments, F-actin and nuclei (DAPI). Right, zoom into VE-like and PE-like cells. b, Cell aspect ratio in VE-like (n = 14) and PE-like cells (n = 12) of the SEM in a. Whiskers extend 1.5× of the interquartile range (box) around the median line. Two-sided Student’s t-test. c, CS5c histological sections reproduced from ref. showing PYS-like (left) and VE-like and PE-like compartments (right). d, Images of day 6 SEMs showing epiblast-like (OCT4+), hypoblast-like (SOX17+), hypoblast/ExEM-like (GATA6+) and trophoblast-like (CK7+ and GATA3+) compartments. Right, ×2 zoom images of ExEM-like cells. e, Image of a day 6 SEM showing a ChC-like structure within GATA6+SOX17 ExEM-like tissue (outlined). f, Image of a day 6 SEM expressing BST2+ underneath a SOX17+ YS-like structure. Right, zoom-in image. g, Image of a day 8 SEM expressing VIM underneath SOX17+ YS-like cells (yellow). Bottom, zoom-in image. h, Inset shows a schematic of the ExEM cells (grey) and SYS (yellow) in 14 d.p.f. human embryo. BF images are of day 8 SEMs showing FOXF1+GATA6+ ExEM-like cells. i, Image of a day 8 SEM with a cavitated BST2+ ExEM-like cell and SOX17. Red arrowheads indicate PYS remnant-like cells. j, CS6 histological section reproduced from ref. showing filamentous ExEM and SYS (×100 magnification). k, Top, scheme of the regular aggregation experiment (control) and without trophoblast-like cells (no BAP(J)). Bottom, images of control SEM and no BAP(J) aggregate from day 6 stained for SOX17 and CK7. l, Quantification of day 6 aggregates in control (N = 2, n = 344 and 1,321) and no BAP(J) (N = 2, n = 472 and 193) conditions. Bars show mean values from two biological replicates, and each dot indicates an average value of a biological replicate. Scale bars, 10 µm (zoom-in images in a,c,f) or 50 µm (all other images). Source Data
Fig. 5
Fig. 5. Trophoblast-like compartment integration and maturation in human SEMs.
a, Top, representative immunofluorescence images of day 6 SEMs showing epiblast-like (OCT4), hypoblast/YS-like (SOX17 or GATA6), ExEM (GATA6) and trophoblast-like (SDC1, CK7 or GATA3) compartments. Bottom, single-channel images of the trophoblast-like compartment surrounding the SEMs. b, Average percentage of aggregates surrounded by a trophoblast-like compartment at day 6, as judged by the expression of SDC1, CK7 or GATA3. SDC1, N = 3 across 533, 232 and 94 aggregates; CK7, N = 5 across 302, 153, 344, 344 and 85 aggregates; and GATA3, N = 3 across 295, 170 and 62 aggregates. Error bars indicate the s.d. c, Left, z maximum intensity projection (z max) image of day 6 SEMs showing HCGB expression in the outer cells. Right, image of the same SEM showing lacunae-like structures (marked with asterisks) inside the outer syncytiotrophoblast-like layer. d, 3D projection of the lacunar-like structures (outlined) in the trophoblast-like layer of a day 6 SEM shown in c. Immunofluorescence for SDC1, HCGB and nuclei (DAPI). e, Histological section and 3D reconstruction (top right) reproduced from the Carnegie collection of a human embryo at CS5c showing lacunae in the syncytiotrophoblast (asterisks or box with dotted outline). f, Representative BF and immunofluorescence images of two different z planes (number 3 and 11, top and bottom, respectively) of day 6 SEMs showing epiblast-like (OCT4), hypoblast-like (SOX17) and trophoblast-like (SDC1) compartments. Top left, lacunae-like structures are outlined and marked with asterisks. Top right, zoom into the lacunae-like structure (top). Bottom, zoom into the outer syncytiotrophoblast-like layer. Brackets mark the thickness of syncytium-like tissue. g, Top, image of a day 6 SEM showing CK7, F-actin and nuclei (DAPI). Bottom, zoom into the multinucleated syncytiotrophoblast-like cell. Arrowheads indicate multiple nuclei inside the single cell. Scale bars, 10 µm (f, top zoom-in), 20 µm (d) or 50 µm (all other images). Source Data
Fig. 6
Fig. 6. scRNA-seq analysis validates key cell-type identities constituting the human SEM.
a, UMAP of single cells from human SEMs coloured by the cell clusters and identified on the basis of known marker genes and gene signatures (Methods). Cluster sizes: 1,963 (cluster 0); 1,483 (cluster 1); 1,431 (cluster 2); 1,344 (cluster 3); 1,265 (cluster 4); 957 (cluster 5); 905 (cluster 6); 898 (cluster 7); 662 (cluster 8); 448 (cluster 9); 441 (cluster 10); 265 (cluster 11); and 128 (cluster 12). b, Normalized expression of key markers projected on the UMAP. Cell-type clusters are highlighted in red. c, Dot plot illustrating the expression of key markers across the 13 cell type clusters. Subcluster 10* indicates a subgroup of cells (n = 31) from cluster 10 that were re-annotated as CTb (cytotrophoblast-like cells) (Methods and Extended Data Figs. 12d and 14). The colour intensity indicates average expression. The dot size indicates the percentage of cells in the cluster that express the marker. Com., committed; Post. posterior. d, Top, heatmap showing normalized expression of PGC markers (SOX17, PRDM1, NANOS3, NANOG and OCT4). Nine cells were OCT4+PRDM1+SOX17+ and NANOS3+. Bottom, OCT4+PRDM1+SOX17+ PGC-like cells (n = 27) were identified in epiblast-like clusters, with the majority in cluster 4 (n = 19, green). e, Left, UMAP of integrated human embryonic reference data consisting of six human embryonic datasets spanning early zygotes, in vitro cultured human blastocysts, 3D in vitro cultured human blastocysts until pre-gastrulation stages, and a CS7, 16–19 d.p.f., human gastrula. The colour of each data point corresponds to the cell annotations from the respective publication. Right, grey data points represent embryonic reference cells, as in the left. Coloured triangles represent the projection positions of the neighbourhood nodes from SEM cells onto the human embryonic reference. SEM-CTb*, neighbourhood nodes representing subcluster 10* cells projected on the reference CTb.
Extended Data Fig. 1
Extended Data Fig. 1. Optimization of extra embryonic lineage induction using transient overexpression of GATA4 and GATA6.
a, representative Flow Cytometry (FACS) plots of Pdgfra-PE/Cy7 marking primitive endoderm (PrE)-like cells priming from mouse embryonic stem cells (ESC) using iGata4 with DOX for 48 h (right) versus the control condition without DOX (left). b, representative FACS plots of PDGFRa-APC for putative PrE/ExEM-like priming from human naïve ESCs (nESCs) using iGATA6 with DOX in different media (N2B27 and HENSM) as indicated. c, quantification of the PDGFRa+ population by FACS analysis among the PrE/ExEM-like cell optimization conditions presented in this study (number of biological replicates is indicated for each condition). Average values and s.d. error bars are shown. Two-sided Student t-test p values are indicated where relevant. >40% PDGFRa+ set as a threshold for follow-up, followed by extended characterization and validation. d, representative FACS plots of PDGFRa-APC for putative PrE/ExEM-like priming/induction from human nESCs after three days in RCL medium (conventional 2D conditions) followed by three days of RCL (left) or basal N2B27 (right) in aggregation setting. e, representative RT-qPCR gene expression (normalized by GAPDH and ACTIN) of the endodermal marker genes, in RCL (yellow), RACL (blue), NACL (dark blue), and basal N2B27 (grey) media conditions versus naïve PCSs used as a control (white). PrE/ExEM and definitive endoderm (DE)-specific genes are separately underlined. Bar plot based panel showing the average value of each sample (which represents average value of 3 technical replicates), error bars indicate s.d. A single representative experiment out of N = 3 biological replicates performed is shown. f, integration of day 3 RCL starting cell population with Pham et al. 2022 ExEM conversion dataset. UMAPs of RCL starting cell population integrated with the published reference dataset of day 6 RACL conversion protocol from naïve ESCs containing PrE cells, ExEM, and intermediate epiblast. Selected cell type annotations are shown. Source Data
Extended Data Fig. 2
Extended Data Fig. 2. Optimization of PrE/ExEM-like cells priming protocol from human HENSM naïve ESCs.
a, representative immunofluorescence images of WT WIBR3 (W3) nESCs induced in RCL media for 6 days, showing expression of GATA4 (cyan), SOX17 (yellow), and BST2 (red); nuclei (DAPI, white). GATA4 marks both SOX17+ PrE-like and BST2+ ExEM-like populations (see also Fig. 1e). This panel is an extended version of Fig. 1e but showing staining patterns of more markers. Scale bar, 100 µm. b, representative immunofluorescence images of iGATA6 nESCs induced in RCL media for 6 days (with or without DOX), showing expression of SOX17 (yellow) and BST2 (red). In both set-ups, BST2+ (ExEM-like) and SOX17+ (PrE-like) cell populations have a mutually exclusive expression pattern. Scale bar, 200 µm. c, representative immunofluorescence images of WT nESCs in RCL media for 6 days. FOXF1 (yellow), BST2 (red), GATA4 (cyan), nuclei (DAPI, white). BST2+ cells are also GATA4+/FOXF1+, excluding the possibility that they represent residual pluripotent cells in the RCL induced cultures from HENSM ESCs. Scale bar, 100 µm. Bottom, 4x zoom, scale bar, 25 µm.
Extended Data Fig. 3
Extended Data Fig. 3. Testing SEM aggregation conditions with human conventional trophoblast stem cell lines and evaluating trophoblast induction with transient overexpression of GATA3 in human naïve ESCs.
a, proportion of the indicated cell types among extra-embryonic cells of mouse natural embryos grown in utero or ex utero and in day 8 mouse SEMs generated from iCdx2 mouse naïve ESCs (and not embryo derived mouse TSC lines). Three pooled samples are presented: in utero natural embryos (n = 2401 cells), ex utero natural embryos (n = 1382), and mouse iCdx2 day 8 SEMs (n = 6249). The cell types: Chorion, Intermediate-Chorion, Chorion Progenitors, Uncommitted Ectoplacental-Cone Cells (EPC), Trophoblast Giant Cells (TGC) progenitors, parietal trophoblast giant cells (pTGC), spiral artery associated trophoblast giant cells (SpA-TGC), and junctional zone spongiotrophoblast cells (SpT-Gly) based on previously published similar analysis and annotations. b, frequencies of the cell types presented in (a), showing a significant reduction of TGC-progenitors and pTGCs in ex utero embryos (natural and SEM), compared to in utero embryos. Blue line represents the linear function f(x)=x; the Shaded area represents 95% confidence interval. Contrary to previous conclusions, this analysis confirmed that mouse naïve ESCs derived TSC lineage following Cdx2 overexpression under optimized conditions developed in can contribute to both the chorionic and ectoplacental cone-like (EPC) lineages in mouse SEMs generated exclusively from mouse naïve ESCs (and not only to the chorionic compartment as claimed by Lau and colleagues). It is likely that failure to detect PGCs and EPC in Lau et al. mouse SEM results from their different and suboptimal TSC (and extra embryonic ectoderm - EXE) induction condition used, in comparison to the one devised in Tarazi et al.. c (top), scheme of the aggregation protocol for epiblast (naïve hESCs in HENSM media) and PrE/ExEM-like cells with the validated human TSC line derived from human primed ESCs (termed pTSC) and expressing tdTomato. c (bottom), representative brightfield images and live fluorescence of tdTomato (red) in aggregates with labeled TSCs; scale bar, 200 µm. Right, zoom into the several SEMs with tdTomato signal; scale bar, 50 µm. d, representative immunofluorescence images showing different patterns of expression of trophoblast marker genes in the wild type (WT) nESCs incubated in BAP(J) media for three days (top) versus iGATA3 cells, induced by DOX in BAP(J) media (bottom). GATA3 (magenta), TFAP2C (magenta), GATA2, CDX2, SDC1, CK7, and HCGB (all in green), nuclei (DAPI, blue). Scale bars, 100 µm. e, representative FACS plots of ENPEP versus TACSTD2 for trophoblast (Tb)-like cell priming using iGATA3 induction in different media (AP(J) with DOX, BAP(J) with DOX), and using WT nESC priming to trophectoderm in AP(J) and BAP(J) regimens. Percentage of double positive population is indicated. f, quantification of the ENPEP-positive/TACSTD2-positive population (%) across conditions in (e), n = 3 biological replicates; average value and s.d. error bars are indicated per condition. Two-sided Student’s t-test p values are indicated where relevant. g, integration of BAP(J) starting population with previously published in vitro differentiation derived (Io et al. 2021) naive trophectoderm conversion data. UMAP of Day 3 BAP(J) starting cell population derived from HENSM were integrated with the previously published reference dataset of naive trophectoderm (nTE) and naive cytotrophoblast (nCT) following BAP(J) regimen. Selected cell type annotations are shown. Source Data
Extended Data Fig. 4
Extended Data Fig. 4. Enhancer accessibility of extra-embryonic lineage master regulators GATA3, GATA4 and GATA6 in human but not mouse naïve ESCs.
a, ATAC-seq and RNA-seq of GATA3, GATA4 and GATA6 genes in human vs. mouse, as measured in naïve ESCs and in multiple differentiated cell types (as indicated). HENSM conditions were used for human naïve ESCs. Known enhancers are marked in grey bars at the bottom. Putative enhancers are marked in red or green: (1) green indicates potential enhancers that are already open in naïve stem cells, (2) red indicates enhancers that are closed in naïve pluripotent stem cells, but open in at least one differentiated cell state. Putative enhancers in the approximate regions of the genes were manually selected. Open regions that overlap with promoter or exon were excluded from the analysis. RNA-seq of the indicated genes in naïve ESCs are shown. b, immunofluorescence images of HENSM ESCs cultured for 3 days in N2B27 basal medium on Matrigel-coated palates. OCT4 marks pluripotent cells (red); VIM, FOXF1, and BST2 mark the ExEM-like cells (all in cyan); SOX17 and GATA6 mark PrE- and PrE/ExEm-like cells, respectively (yellow). GATA3 marks trophoblast-like cells (magenta), nuclei (DAPI, white). Scale bar, 200 µm.
Extended Data Fig. 5
Extended Data Fig. 5. Evaluating SEM aggregation by omitting one of the lineages.
a, scheme of the aggregation experiment (see Methods) where one of the lineages was omitted to evaluate its contribution to the resulting SEM morphology. b (from top to bottom), representative immunofluorescence images of day 6 SEM aggregates from the three lineages (control, 120 cells), no HENSM (1:3 RCL: BAP(J), 96 cells), no BAP(J) (1:1 HENSM: RCL, 48 cells), and no RCL cells (2:3 HENSM: BAP(J), 120 cells). b (from left to right), representative immunofluorescence images of day 6 SEM aggregates showing OCT4 (cyan), SOX17 (yellow), and CK7 (magenta); nuclei (DAPI, white). Right, zooms into the SEMs from different aggregation conditions. Scale bars, 50 µm. c, quantification of the SEM efficiency from the control aggregation and the aggregation without RCL cells (Pre/ExEM-like cells), as judged by the formation of bilaminar Epi/Hb-like structure surrounded by the trophoblast-like layer. N = 3 (across 344, 157, and 1244 aggregates) and N = 3 (across 1063, 205, 929 aggregates) for control and no RCL conditions, respectively. Bars show mean values, whiskers mark s.d. p-value = 0.29; two-sided unpaired student t-test. d, representative immunofluorescence images of day 6 aggregates made solely from naïve ESC from HENSM media showing OCT4 (cyan), low SOX17 (yellow), and GATA3 (magenta); nuclei (DAPI, white). Scale bar, 200 µm. e (left), scheme of the experiment testing the capacity of cells, differentiated from human WIBR3 primed ESCs, to form equivalent SEMs to those obtained from isogenic naïve ESCs expanded in HENSM conditions. e (right), representative immunofluorescence images of day 6 SEMs showing OCT4 (cyan), SOX17 (yellow), CK7 (magenta), and nuclei (DAPI, white). When starting with isogenic WIBR3 primed ESCs, the resulting aggregates did not present organization and maturation of the key embryonic and extra-embryonic compartments as seen when starting with HENSM naïve ESCs (e.g., Fig. 2). Scale bar, 200 µm. Source Data
Extended Data Fig. 6
Extended Data Fig. 6. Characterization of epiblast-, hypoblast-, and trophoblast-like lineages in SEMs.
a (left to right), representative merged brightfield (BF) and immunofluorescence images of day 3 SEMs showing three lineages, epiblast-like (OCT4, cyan), hypoblast-like (SOX17, yellow), and trophoblast-like lineage (CK7, magenta) merged with a nuclei channel (DAPI, white). b, representative merged brightfield and immunofluorescence images of multiple day 6 SEMs, showing epiblast-like (OCT4, cyan), hypoblast-like or hypoblast/ExEM-like (SOX17 or GATA6, respectively, in yellow), and trophoblast-like (SDC1 and GATA3, magenta) compartments merged with a nuclei channel (DAPI, white). c (left), representative immunofluorescence images of day 6 SEMs showing epiblast-like (OCT4, cyan), hypoblast-like (SOX17, yellow), and trophoblast-like (CK7, magenta) compartments; nuclei (DAPI, white). Left panel represents a wide field image with adequate SEMs (outlined in green) and mis-developed structures (outlined in red); scale bar, 200 µm. Right panels zoom into the examples. c (from left to right), representative immunofluorescence image of the SEM developed according to the three success rate criteria (outlined in green, see Methods). Representative mis-developed day 6 SEMs (outlined in red) which do not fall within the success rate criteria: not surrounded by trophoblast (Tb)-like cells (I), without epiblast (Epi)- and hypoblast (Hb)- like cells (II), without the amniotic cavity (AC)-like structure and the yolk sac cavity (YS)-like structure and bilaminar Epi/Hb-like structure (III). Scale bars, 50 µm.
Extended Data Fig. 7
Extended Data Fig. 7. Analyzing 3D structure of the human SEM at day 8.
a, quantification of the SEM derivation efficiency at day 8 for WIBR3 line according to the criteria: I, surrounding by Tb-like layer; II, presence of Epi-like and Hb-like compartments; III, presence of Bilaminar Epi/Hb disk-like structure, AC-like structure, and YS-like or Secondary(S) YS-like structures. N = 3 across 1251, 377, and 700 SEM aggregates. Bars show mean values, whiskers mark s.d. b, individual Z-planes of the 3D immunofluorescence image of a day 8 human SEM that meets criteria III specified in a. Epiblast-like (OCT4, cyan), hypoblast-like (SOX17, yellow), and trophoblast-like (CK7, magenta) compartments; nuclei (DAPI, white). AC, amniotic cavity-like; Am, amnion-like; ExEM, extraembryonic mesoderm-like; SYS, secondary yolk sac-like; ChC, chorionic cavity-like; STb, syncytiotrophoblast-like; Sk, stalk-like. Z-step, 20 µm; scale bar, 50 µm. See also Supplementary Video 1. Source Data
Extended Data Fig. 8
Extended Data Fig. 8. Characterization of the epiblast-like structure in human SEM.
a, representative immunofluorescence image of day 6 SEM showing aPKC (green), OCT4 (cyan), F-ACTIN (red), nuclei (DAPI, white). Scale bar, 50 µm; 12.5 µm (zoom, right). b (left), immunofluorescence image of day 6 SEM showing OCT4 (cyan), F-ACTIN (red), and phERM (green); alignment of Epi-like cells in a single 2D plane is marked with dashed lines; asterisk, pro-amniotic-like cavity. Scale bar, 25 µm. b (right), quantification of the angle between the epiblast-like cell axis and the pro-amniotic-like cavity; the plot shows the radial histogram of the angle values and indicates predominant alignment of epi-like cells towards the center of the emerging cavity (n = 32). c, representative immunofluorescence image of day 6 SEM showing T/BRA expression (red); OCT4 (cyan), nuclei (DAPI, white). Right, zoom into the posterior epiblast-like structure, arrows mark individual T/BRA-positive cells. Scale bar, 50 µm, 12.5 µm (4x zoom in, right). d, representative immunofluorescence image of day 6 SEM showing CER1 (green) localization inside the intracellular vesicles; OCT4 (cyan), nuclei (DAPI, white). Right, zoom into hypoblast-like compartment, arrows mark apical side of the visceral endoderm-like cells with CER1 vesicles. Scale bar, 50 µm, 12.5 µm (4x zoom, right). e (left), immunofluorescence image of day 6 aggregates showing T (red), OCT4 (cyan), CER1 (green), and nuclei (DAPI, white); scale bar, 500 µm. e (right), zoom into the SEM with expression of T in epiblast-like compartment and CER1 in hypoblast-like compartment at the opposite sides (defined as AP-axis, see XZ cross section below) observed in 1.02% of total number of starting aggregates on day 0. N = 2 across 1251 and 700 aggregates. Scale bar, 50 µm. f, representative immunofluorescence image of day 6 SEM showing F-ACTIN (white) and nuclei (DAPI, blue). Right, zoom into epiblast-like structure with squamous cells (sEpi) in the top and cylindrical/columnar cells (cEpi) in the bottom parts of the epiblast-like compartment. Scale bar, 50 µm; zoom, 25 µm. g, representative immunofluorescence image of day 6 SEM showing F-ACTIN (white) and OCT4 (cyan). Right, zoom into epiblast-like compartment with squamous cells in the top and cylindrical cells in the bottom parts of the epiblast-like compartment. Scale bar, 50 µm; zoom, 25 µm. h, representative brightfield and immunofluorescence images of day 8 SEM showing NANOG (cyan), SOX17 (yellow), and nuclei (DAPI, white). Right, zoom into PGC-like cells in day 8 human SEMs, co-expressing NANOG and SOX17 (cells marked with arrows). Scale bars, 50 µm. Source Data
Extended Data Fig. 9
Extended Data Fig. 9. Characterization of hypoblast-lake layer and extraembryonic mesoderm-like cells in human SEMs.
a, representative immunofluorescence image of day 6 SEM showing apical polarity of the visceral and parietal hypoblast-like layers (SOX17, yellow); aPKC (heat gradient), F-ACTIN (white). Scale bar, 50 µm; zoom, 10 µm. See also Supplementary Video 6. b, representative immunofluorescence image of day 6 SEM showing OCT4 (cyan), GATA4 (red), SOX17 (yellow), and nuclei (DAPI). Right, zoom on ExEM-like cells expressing GATA4, but not SOX17. YS, yolk sac-like. Scale bar, 50 µm; zoom, 10 µm. c (left), zoom into the SEM example with adequate morphology and structure (see Methods) aggregated from RUES2 reporter hESC line showing epiblast-like (SOX2-Citrine, yellow), hypoblast-like (SOX17-tdTomato, red), and trophoblast-like (CK7, magenta) compartments with 0.08% efficiency (N = 3 across 409, 295, and 528 aggregates); nuclei (DAPI, white); scale bar, 50 µm. c (right), representative large field of view immunofluorescence image of day 6 SEM aggregates, the zoom on the left is outlined; scale bar, 500 µm. d, representative immunofluorescence image of day 6 SEM showing mesenchymal-like cells underneath the yolk sac-like structure; OCT4 (cyan), F-ACTIN (red), and nuclei (DAPI, white). Right, zoom into the region underneath the yolk sac-like structure, shown in different Z-planes (number 50, 60, and 70). Arrows point at the cells between yolk sac-like and the trophoblast-like compartments. Scale bar, 50 µm; zoom, 25 µm. See also Supplementary Video 4. e, representative immunofluorescence images of day 6 SEMs showing chorionic-like cavity surrounded by ExEM-like cells (outlined), negative for SOX17 (yellow), but expressing BST2 (top, red) and GATA6 (bottom, red); OCT4 (cyan), nuclei (DAPI, white). Scale bar, 50 µm. f, heatmap of GATA6 and SOX17 gene expression across extraembryonic tissues in marmoset, corresponding to the Carnegie stages (CS) 5-7), extracted from previously published gene expression dataset. Am, amnion; Tb, trophoblast; VE, visceral endoderm; SYS, secondary yolk sac; ExEM, extraembryonic mesoderm. g (top), representative immunofluorescence image of Z slice from day 8 SEM and the zoom into the ExEM-like region showing VIM (red) expression and nuclei (DAPI, white). g (bottom), merged brightfield and maximum intensity projection showing VIM (red) expression. Scale bar, 50 µm; zoom, 10 µm. h (top), representative immunofluorescence image of day 6 SEM from aggregation with trophoblast-like cells (control). The arrows in the zoom below point at the apical surface of the visceral hypoblast-like layer (SOX17, yellow); aPKC (green), F-ACTIN (red). Scale bar, 50 µm; zoom, 10 µm. h (bottom), representative immunofluorescence image of day 6 aggregate from experiment where trophoblast-like cell fraction was omitted (no BAP(J)) condition (related to Fig. 4k). The arrows in the zoom below point at the apical surface of the PrE/hypoblast-like cells (or layer) surrounding the aggregate (SOX17, yellow); aPKC (green), F-ACTIN (red). Scale bar, 50 µm; zoom, 10 µm.
Extended Data Fig. 10
Extended Data Fig. 10. Characterization of the trophoblast-like compartment in human SEM.
a, representative immunofluorescence images of multiple day 6 SEMs showing epiblast-like structure (OCT4, cyan), hypoblast-like structure (SOX17 and GATA6, yellow), and trophoblast-like layer (SDC1 and GATA3, magenta) surrounding the SEMs; nuclei (DAPI, white), that were used for calculation presented in (Fig. 5b). Scale bar, 200 µm. b, maximum intensity projection (Max. Proj.) of the immunofluorescence image of day 8 SEM showing trophoblast-like cells (GATA3, magenta) and nuclei, (DAPI, white). Scale bar, 50 µm. c, representative brightfield image overlayed with the immunofluorescence of day 8 SEM showing the outer trophoblast-like compartment (CK7, magenta) surrounding the entire SEM. Right, zoom into the multinucleated trophoblast-like layer. Scale bars, 50 µm. d, quantification of the percentage of lacunae-like positive aggregates in all Tb-like positive aggregates (N = 3 independent experimental replicates, n = 241). Bars show mean values, whiskers mark s.d. e, representative immunofluorescence image of day 6 SEM showing HCGB (green) and CK7 (magenta). Right, zoom into HCGB+ syncytiotrophoblast-like cells; nuclei (DAPI, white), F-ACTIN (white, right zoom). HCGB expression was detected in 98.08% of all of aggregates with Tb-like compartment (n = 261). Arrows point at the outer syncytiotrophoblast-like cell surface. Scale bars, 50 µm. f, representative immunofluorescence image of a human SEM showing multinucleated HCGB-positive syncytiotrophoblast-like cells; HCGB (green), F-ACTIN (red), nuclei (DAPI, white). Arrows point at multiple nuclei inside the same single cell. Scale bars, 50 µm. g, commercial ELISA pregnancy test run on spent medium of the day 8 SEMs (Day 8, right) compared to unspent medium as a negative control (CTR, left) which detects the secretion of HCGB from the syncytiotrophoblast-like compartment of day 7-8 human. h, scheme of the 11-12 dpf human embryo with the zoom into the surface of the syncytiotrophoblast (magenta). i, representative immunofluorescence images of the syncytiotrophoblast-like cell surface in day 8 SEM showing SDC1 (magenta), HCGB (green), and the lipid membrane (WGA, white). Yellow and white arrows point at the HCGB+ vesicles and microvilli-like (Mv) plasma membrane protrusions, respectively. Mv-like protrusions were observed in 10 out of 10 SEMs surrounded by Tb-like compartment that expresses SDC1 (selected randomly for high-resolution imaging). Scale bar, 10 µm. Source Data
Extended Data Fig. 11
Extended Data Fig. 11. Identification and validation of specific cell sub-types in human SEMs.
a, UMAP of the four annotated epiblast-like clusters (1, 4, 7 & 11) alongside normalized expression of key marker genes. From the four Epi-like clusters we subclassified two. The first we termed “Posterior epiblast-like cluster” (#4), which was characterized by upregulation of the EMT markers such as TBXT (T/Brachyury), MIXL1, EOMES, MESP1 and WNT8a. The second we termed a “committed epiblast-like” cluster (#7), which was marked by ZIC2, ZEB2, and VIM lineage commitment markers and the absence of NANOG, while maintaining OCT4 and SOX2. b, reclustering of the 4 epiblast-like clusters (1, 4, 7, 11) resulted in 5 finer clusters (A-E). c, pseudotime analysis over epiblast-like cells starting with epiblast-like (E+A) and progressing through two trajectories towards either committed epiblast-like cells (B) or posterior epiblast-like cells (D). d, gene expression profile of top 30 markers of committed epiblast-like sub compartment (left) or posterior epiblast-like sub compartment (right). Cells are ordered by cell pseudotime score, showing the gradual increase in expression over pseudotime. e, normalized expression of key amnion marker genes projected on human SEM-related UMAP. Amnion-like cluster (#10) is highlighted in red. f, expression of BMP4 and FURIN in Amnion (Am)-like cluster 10 and STb-like cluster 12.
Extended Data Fig. 12
Extended Data Fig. 12. Identification and validation of blood- and trophoblast-like cell sub-types in human SEMs.
a, normalized expression of selected blood markers (TAL1, ERG, CD34), across cells with positive (>0) expression of CD34 or TAL1. In the dashed area 6 cells which are positive to all 3 markers can be observed. b, normalized expression of key blood marker genes (TAL1, ERG, CD34) projected on a subset of SEM UMAP clusters. c, normalized expression of key trophoblast marker genes projected on SEM UMAP. Syncytiotrophoblast (STb)-like cluster (#12) is highlighted in red. d, normalized expression of key CTb marker genes projected on SEM UMAP clusters 10 (Amnion-like) and 12 (Syncytiotrophoblast-like). Cytotrophoblast (CTb)-like cells are highlighted in red. e, expression of top 50 differentially expressed genes (two-sided Wilcoxon test p-value < 0.05, logFC > 1.06 set as threshold), upregulated in Cytotrophoblast (CTb)-like cells compared to Syncytiotrophoblast (STb)-like cells. Annotation of CTb-like cells (n = 31) and STb-like cells (n = 100) was done based on the projection of SEM UMAP on the embryonic reference map (Fig. 6e). f, representative RT-qPCR gene expression (normalized by HPRT and RPL3) measured in SEM cells generated with or without BAP(J), and HENSM as control. Cell type markers were measured as following: general Tb markers (GATA2, TFAP2C), CTb-specific markers (TEAD3, TP63, OVOL1), STb-specific markers (CGa, CGb, SDC1) and pluripotent marker OCT4 (used as a negative control). Bar plot based panel showing the average value of each sample (which represents average value of 3 technical replicates), error bars indicate s.d. A single representative experiment out of N=3 biological replicates performed is shown. Source Data
Extended Data Fig. 13
Extended Data Fig. 13. Identification of Primary- and Secondary Yolk-sac-like cells, and Extra-Embryonic Mesoderm-like cells.
a, normalized expression of key yolk sac (YS) marker genes projected on the SEM UMAP. The co-expression of DKK1 and LHX1 alongside CER1 among SOX17+ YS-like cell population (arrows) in cluster 3 marks AVE-like cells. b, reclustering of the two YS-like clusters (3 and 9) resulted in 3 finer clusters (A-C). c, pseudotime analysis over YS-like clusters showing progression of the transcriptional profile, reflected by pseudotime score, starting with YS-like structure and ending with SYS-like compartment. d, gene expression profile of the top 60 differentially expressed genes (between cluster #3 (YS-like) and cluster #9 (SYS-like), ordered by cell pseudotime score. e (left), projection of day 3 RCL induced cell population (red triangle) on SEM UMAP, showing three cell populations in day 3 RCL fraction: ExEM-like, PrE/Hypoblast-like cells and residual primed ESCs. e (right), the corresponding annotated SEM UMAP. f, integration of SEM ExEM-like cells with previously described in vitro ExEM conversion time-course. UMAP of SEM ExEM-like populations (green hues) integrated with the previously published time course dataset of naive to PrE/ExEM conversion (red hues). g, projection of early and late ExEM population derived and sequenced in Pham et al. on the reference embryo meta-analysis (described in Fig. 6e).
Extended Data Fig. 14
Extended Data Fig. 14. Annotation and characterization of STb- and CTb-like cell populations in human SEMs.
a, expression of significant differentially expressed genes between Amnion and Tb taken from Zhao et al., in SEM amnion-like cells and Tb-like cells (performed using the FindMarkers function from R Seurat package and the ‘roc’ test). Seurat annotation and updated annotation from embryonic reference projection were indicated above. b, expression of top 50 significant differentially expressed genes between STb and CTb from, in SEM CTb-like and STb-like cells (using the ‘roc’ test of FindMarkers function).

Comment in

References

    1. Rossant, J. & Tam, P. P. L. Opportunities and challenges with stem cell-based embryo models. Stem Cell Reports 16, 1031–1038 (2021). - PMC - PubMed
    1. Oldak, B. et al. Transgene-free ex utero derivation of a human post-implantation embryo model solely from genetically unmodified naive PSCs. Preprint at bioRxiv10.1101/2023.06.14.544922 (2023).
    1. Tarazi S, et al. Post-gastrulation synthetic embryos generated ex utero from mouse naive ESCs. Cell. 2022;185:3290–3306.e25. doi: 10.1016/j.cell.2022.07.028. - DOI - PMC - PubMed
    1. Bayerl J, et al. Principles of signaling pathway modulation for enhancing human naïve pluripotency induction. Cell Stem Cell. 2021;28:1549–1565. doi: 10.1016/j.stem.2021.04.001. - DOI - PMC - PubMed
    1. Rivron NC, Arias AM, Pera MF, Moris N, M’hamdi HI. An ethical framework for human embryology with embryo models. Cell. 2023;186:3548–3557. doi: 10.1016/j.cell.2023.07.028. - DOI - PubMed

Publication types