. 2023 Sep 7;14(9):596.
doi: 10.1038/s41419-023-06103-5.

Decoding the transcriptome of Duchenne muscular dystrophy to the single nuclei level reveals clinical-genetic correlations

Affiliations

Decoding the transcriptome of Duchenne muscular dystrophy to the single nuclei level reveals clinical-genetic correlations

Xavier Suárez-Calvet et al. Cell Death Dis. .

Abstract

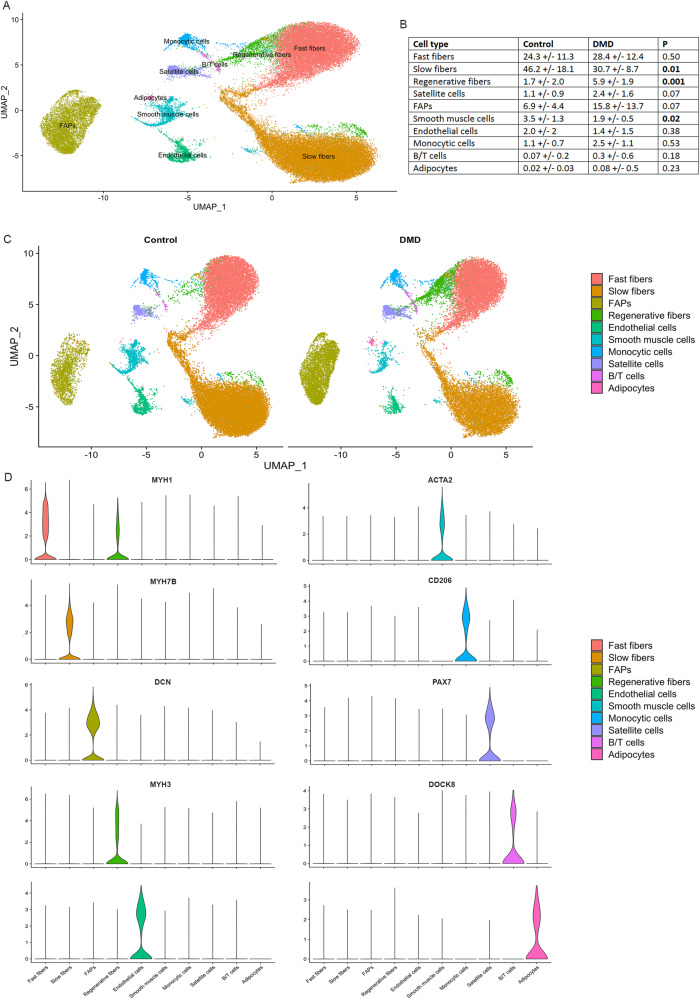
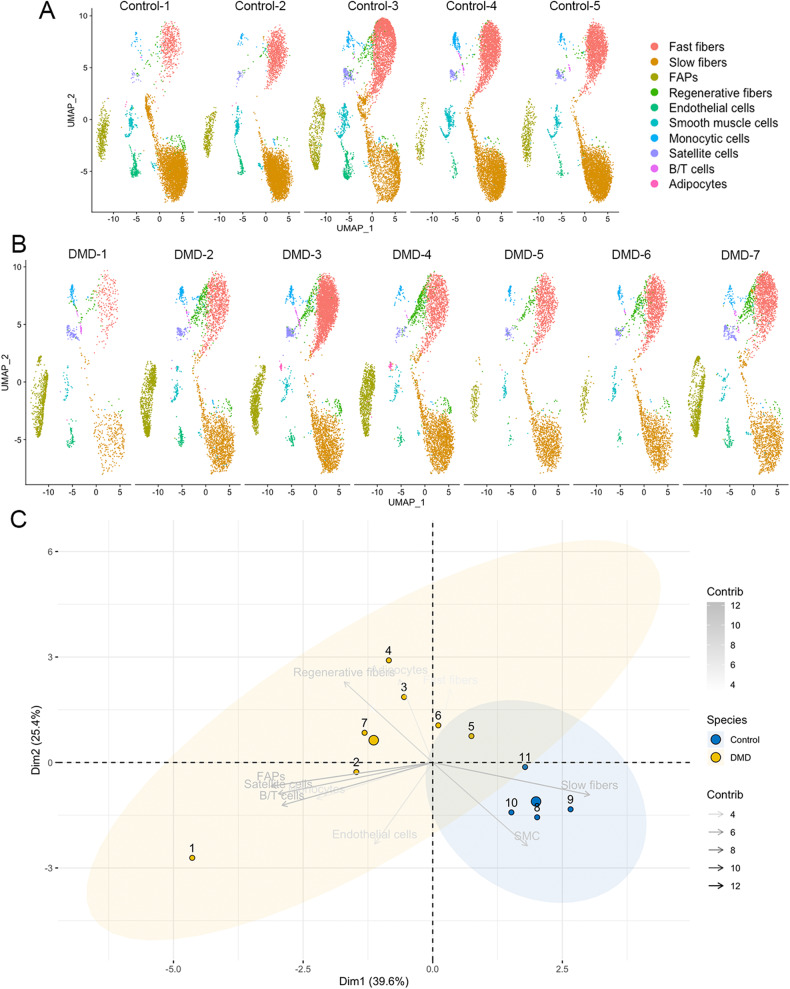
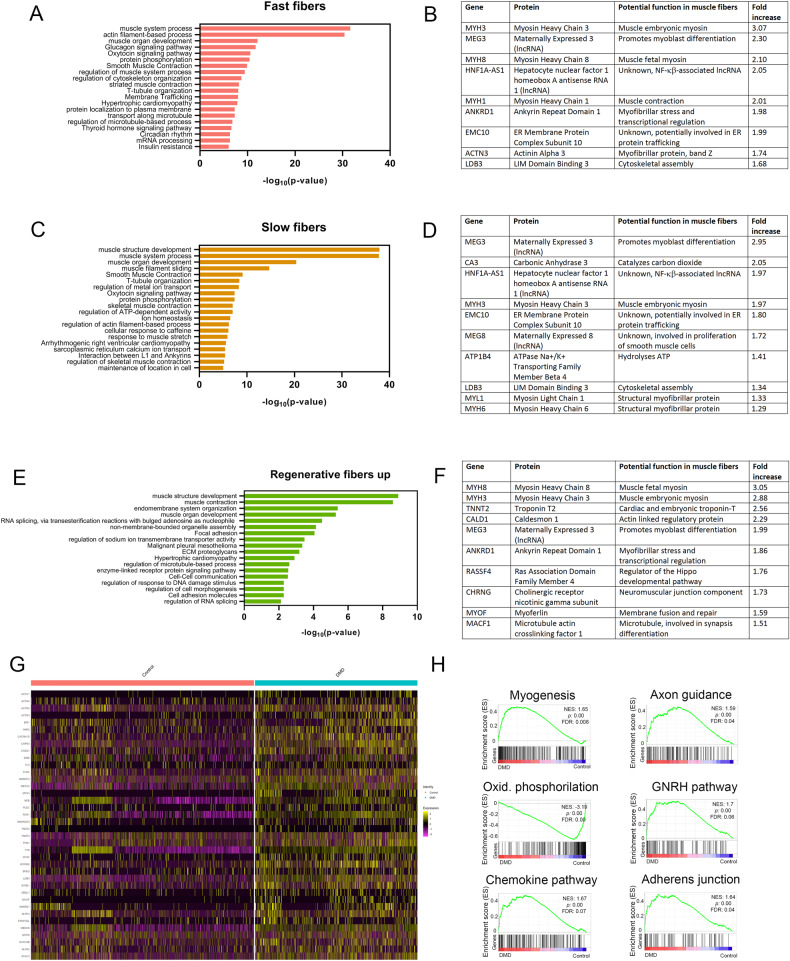
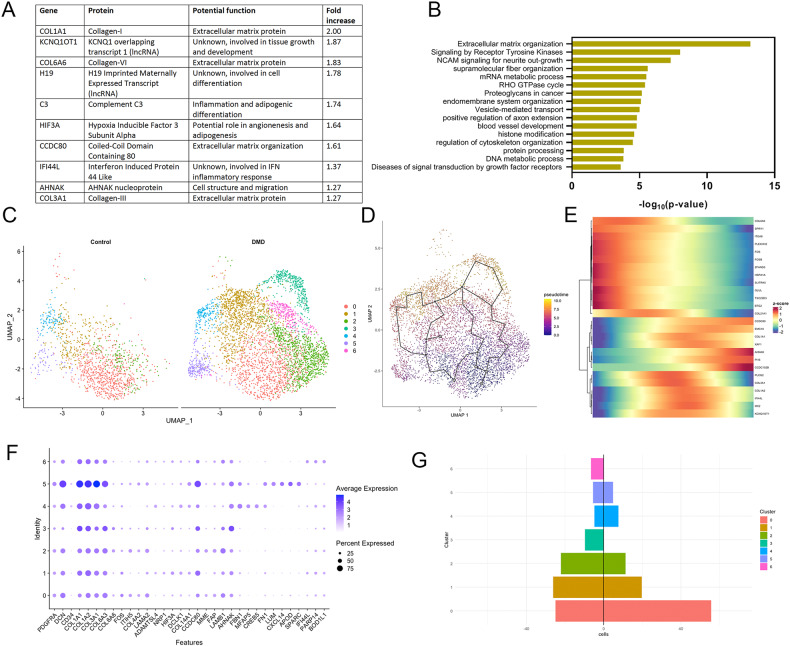
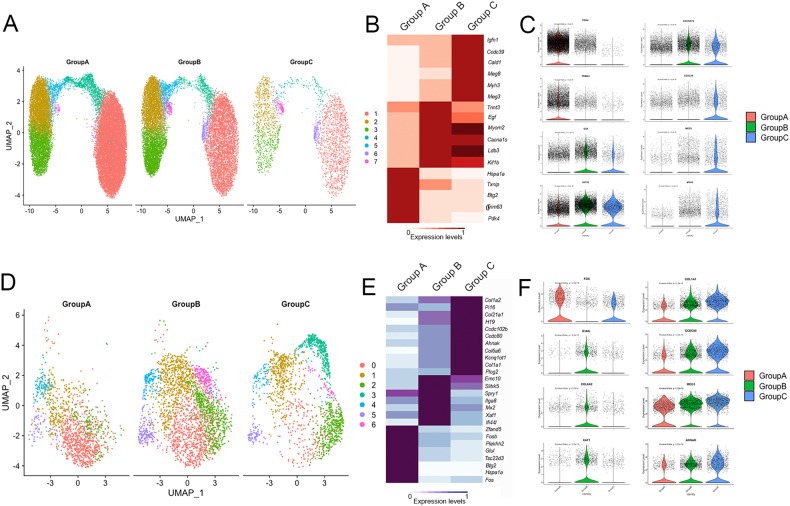
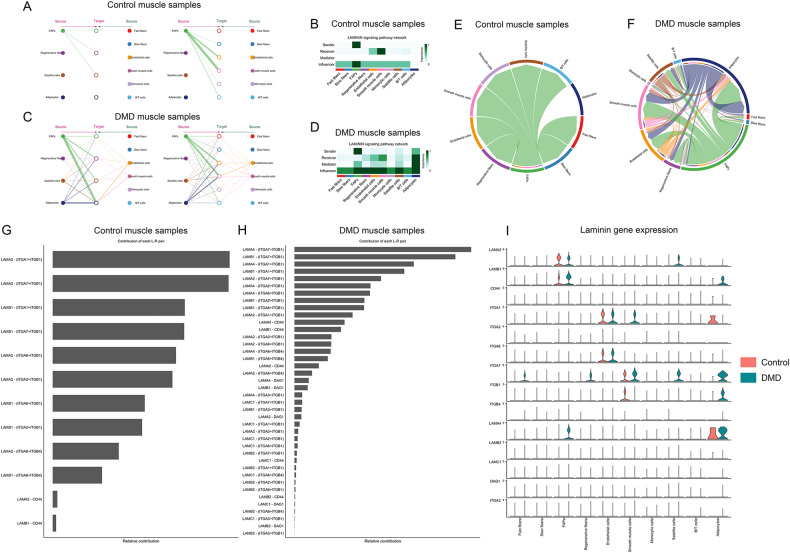
Duchenne muscular dystrophy is a genetic disease produced by mutations in the dystrophin gene characterized by early onset muscle weakness leading to severe and irreversible disability. The cellular and molecular consequences of the lack of dystrophin in humans are only partially known, which is crucial for the development of new therapies aiming to slow or stop the progression of the disease. Here we have analyzed quadriceps muscle biopsies of seven DMD patients aged 2 to 4 years old and five age and gender matched controls using single nuclei RNA sequencing (snRNAseq) and correlated the results obtained with clinical data. SnRNAseq identified significant differences in the proportion of cell population present in the muscle samples, including an increase in the number of regenerative fibers, satellite cells, and fibro-adipogenic progenitor cells (FAPs) and a decrease in the number of slow fibers and smooth muscle cells. Muscle samples from the younger patients with stable mild weakness were characterized by an increase in regenerative fibers, while older patients with moderate and progressive weakness were characterized by loss of muscle fibers and an increase in FAPs. An analysis of the gene expression profile in muscle fibers identified a strong regenerative signature in DMD samples characterized by the upregulation of genes involved in myogenesis and muscle hypertrophy. In the case of FAPs, we observed upregulation of genes involved in the extracellular matrix regeneration but also several signaling pathways. Indeed, further analysis of the potential intercellular communication profile showed a dysregulation of the communication profile in DMD samples identifying FAPs as a key regulator of cell signaling in DMD muscle samples. In conclusion, our study has identified significant differences at the cellular and molecular levels in the different cell populations present in skeletal muscle samples of patients with DMD compared to controls.


Conflict of interest statement

The authors declare no competing interests.

Figures

Fig. 1
Fig. 1. Classification of nuclei/cell types in normal and DMD muscle samples.
A UMAP visualization of all the nuclei from control and DMD samples colored by cluster identity. B Table comparing the proportion of cell population between control and DMD samples. C UMAP showing clusters identified in control (left) and DMD (samples). D Violin plots showing the expression of selected marker genes for each cluster of nuclei. FAPs fibroadipogenic progenitor cells.
Fig. 2
Fig. 2. Differences in cell population to the individual level.
A UMAP visualization of nuclei from control individuals colored by cluster identity. B UMAP visualization of nuclei from DMD individuals colored by cluster identity. C PCA analysis showing the distribution of individuals based on each cell population proportion.
Fig. 3
Fig. 3. Analysis of gene expression changes in DMD myonuclei compared to control myonuclei.
A Top molecular pathways upregulated in fast fibers. B List of the top ten genes upregulated in myonuclei of fast fibers of DMD samples. C Top molecular pathways upregulated in slow fibers. D List of the top ten genes upregulated in myonuclei of slow fibers of DMD samples. E Top molecular pathways upregulated in regenerative myofibers. F List of the top ten genes upregulated in myonuclei of regenerative myofibers. G Heatmap showing expression of genes involved in muscle growth in Control and DMD fast and slow myonuclei. H GSEA plots showing enrichment score (ES) of the significantly enriched hallmark gene sets in fast and slow myonuclei. A positive value of ES indicates enriched in DMD and a negative value indicates enriched in normal conditions and down-regulated in DMD. GSEA gene set enrichment analysis, NES normalized enrichment score, FDR false discovery rate. Oxid Oxidative. GNRH Gonadotropin hormone-releasing hormone.
Fig. 4
Fig. 4. Analysis of gene expression changes in DMD FAPs compared to control nuclei.
A List of the top ten genes upregulated in FAPs of DMD samples. B Top molecular pathways upregulated in DMD FAPs. C UMAP visualization of nuclei from FAPs of control and DMD individuals coloured by subpopulation identity. D Monocle analysis showing pseudotime trajectories of the re-clustered FAPs. E Heatmap showing selected gene expression across pseudotime trajectories. F Selected genes expressed in each FAP subcluster. G Population of subclusters of FAPs in Control and DMD samples.
Fig. 5
Fig. 5. Differences in cell population and gene expression profile between stable and progressing DMD patients.
A UMAP of the subpopulations of myonuclei in control, stable, and declining DMD patients. B Heatmap showing the top upregulated genes in myonuclei from controls, stable and declining DMD patients samples. C Violin plot showing the expression of selected markers genes for myonuclei of controls, stable and declining DMD patients. C UMAP of the subpopulations of FAPs in control, stable, and declining DMD patients. B Heatmap showing the top upregulated genes in FAPs from controls, stable and declining DMD patients samples. C Violin plot showing the expression of selected markers genes for FAPs of controls, stable and declining DMD patients.
Fig. 6
Fig. 6. Analysis of intercellular communications in control and DMD muscle samples.
A Heatmap showing differential number of interactions between clusters in DMD samples compared to controls. Red: increased interactions in DMD. Blue: Increased interactions in controls. B Chord plot displaying intercellular ligand-receptor interaction strength comparing DMD and control samples. Red: increased interactions in DMD. Blue: Increased interactions in controls. C Bar graph showing relative information flow per each signaling path in control(red) and DMD (green) samples. D Bar graph showing the weight of each signaling path in control (red) and DMD (green) samples. E Dot plot showing the weight of each cell cluster in outgoing-incoming signaling in control samples. F Dot plot showing the weight of each cell cluster in outgoing-incoming signaling in control samples. G Dot plot showing the main molecules released and received by FAPs in DMD and control samples.
Fig. 7
Fig. 7. Collagen signaling pathway in control and DMD muscle samples.
A Hierarchical plot shows the inferred intercellular communication network for collagen signaling. This plot consists of two parts: Left and right portions highlight the autocrine and paracrine signaling to FAPs, regenerative fibers, satellite cells, and adipocytes and to the other clusters identified, respectively. Solid and open circles represent the source and target, respectively. Circle sizes are proportional to the number of cells in each cell group and edge width represents the communication probability. Edge colors are consistent with the signaling source. B Heatmap shows the relative importance of each cell group based on the computed network centrality measures of the collagen signaling network in control samples. C Hierarchical plot shows the inferred intercellular communication network for collagen signaling in DMD samples. D Heatmap shows the relative importance of each cell group based on the computed network centrality measures of the collagen signaling network in control samples. E Chord plot displaying intercellular communication network for collagen signaling in controls. F Chord plot displaying intercellular communication network for collagen signaling in DMD. G Relative contribution of each ligand-receptor pair to the overall communication network of a collagen signaling pathway in control samples, which is the ratio of the total communication probability of the inferred network of each ligand-receptor pair to that of the collagen signaling pathway. H Relative contribution of each ligand-receptor pair to the overall communication network of a collagen signaling pathway in DMD samples. I Violin plot showing the expression distribution of signaling genes involved in the inferred collagen signaling.
Fig. 8
Fig. 8. Laminin signaling pathway in control and DMD muscle samples.
A Hierarchical plot shows the inferred intercellular communication network for laminin signaling. This plot consists of two parts: Left and right portions highlight the autocrine and paracrine signaling to FAPs, regenerative fibers, satellite cells, and adipocytes and to the other clusters identified, respectively. Solid and open circles represent the source and target, respectively. Circle sizes are proportional to the number of cells in each cell group and edge width represents the communication probability. Edge colors are consistent with the signaling source. B Heatmap shows the relative importance of each cell group based on the computed network centrality measures of the laminin signaling network in control samples. C The hierarchical plot shows the inferred intercellular communication network for laminin signaling in DMD samples. D Heatmap shows the relative importance of each cell group based on the computed network centrality measures of the laminin signaling network in control samples. E Chord plot displaying intercellular communication network for laminin signaling in controls. F Chord plot displaying intercellular communication network for laminin signaling in DMD. G Relative contribution of each ligand-receptor pair to the overall communication network of a laminin signalling pathway in control samples, which is the ratio of the total communication probability of the inferred network of each ligand-receptor pair to that of the laminin pathway. H Relative contribution of each ligand-receptor pair to the overall communication network of a laminin signaling pathway in DMD samples. I Violin plot showing the expression distribution of signaling genes involved in the inferred laminin signaling.

References

    1. Birnkrant DJ, Bushby K, Bann CM, Apkon SD, Blackwell A, Brumbaugh D, et al. Diagnosis and management of Duchenne muscular dystrophy, part 1: diagnosis, and neuromuscular, rehabilitation, endocrine, and gastrointestinal and nutritional management. Lancet Neurol. 2018;17:251–67. doi: 10.1016/S1474-4422(18)30024-3. - DOI - PMC - PubMed
    1. Mercuri E, Bonnemann CG, Muntoni F. Muscular dystrophies. Lancet. 2019;394:2025–38. doi: 10.1016/S0140-6736(19)32910-1. - DOI - PubMed
    1. Matthews E, Brassington R, Kuntzer T, Jichi F, Manzur AY. Corticosteroids for the treatment of Duchenne muscular dystrophy. Cochrane Database Syst Rev. 2016;2016:CD003725. - PMC - PubMed
    1. Bello L, Gordish-Dressman H, Morgenroth LP, Henricson EK, Duong T, Hoffman EP, et al. Prednisone/prednisolone and deflazacort regimens in the CINRG Duchenne Natural History Study. Neurology. 2015;85:1048–55. doi: 10.1212/WNL.0000000000001950. - DOI - PMC - PubMed
    1. Verhaart IEC, Aartsma-Rus A. Therapeutic developments for Duchenne muscular dystrophy. Nat Rev Neurol. 2019;15:373–86. doi: 10.1038/s41582-019-0203-3. - DOI - PubMed

Publication types