. 2023 Sep 6;14(1):5195.
doi: 10.1038/s41467-023-40798-6.

A super-enhancer-regulated RNA-binding protein cascade drives pancreatic cancer

Affiliations

A super-enhancer-regulated RNA-binding protein cascade drives pancreatic cancer

Corina E Antal et al. Nat Commun. .

Abstract

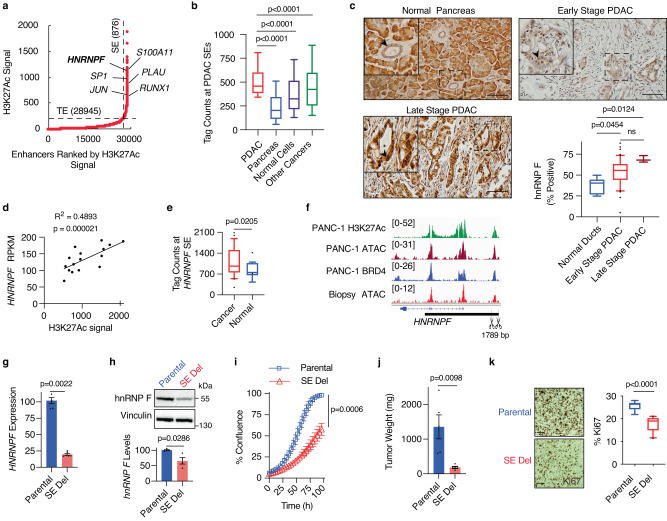
Pancreatic ductal adenocarcinoma (PDAC) is a lethal malignancy in need of new therapeutic options. Using unbiased analyses of super-enhancers (SEs) as sentinels of core genes involved in cell-specific function, here we uncover a druggable SE-mediated RNA-binding protein (RBP) cascade that supports PDAC growth through enhanced mRNA translation. This cascade is driven by a SE associated with the RBP heterogeneous nuclear ribonucleoprotein F, which stabilizes protein arginine methyltransferase 1 (PRMT1) to, in turn, control the translational mediator ubiquitin-associated protein 2-like. All three of these genes and the regulatory SE are essential for PDAC growth and coordinately regulated by the Myc oncogene. In line with this, modulation of the RBP network by PRMT1 inhibition reveals a unique vulnerability in Myc-high PDAC patient organoids and markedly reduces tumor growth in male mice. Our study highlights a functional link between epigenetic regulation and mRNA translation and identifies components that comprise unexpected therapeutic targets for PDAC.


Conflict of interest statement

G.W.Y. is a co-founder, member of the Board of Directors, on the scientific advisory boards, equity holder, and paid consultant for Locanabio and Eclipse BioInnovations. G.W.Y. is a visiting professor at the National University of Singapore. G.W.Y.’s interests have been reviewed and approved by the University of California, San Diego, in accordance with its conflict-of-interest policies. The remaining authors declare no competing interests.

Figures

Fig. 1
Fig. 1. Perturbation of the HNRNPF super-enhancer impairs tumor growth.
a Super-enhancers (SEs) and typical enhancers (TE) plotted based on their input-normalized H3K27Ac ChIP-seq signal. b Box plots showing cumulative tag counts across all identified SE loci (n = 876) in 16 PDAC cell lines, 2 normal pancreas tissue samples, 8 normal cell types (293T, NHEK, myoblasts, monocytes, bronchial epithelial cells, skeletal myotubes, keratinocytes, and macrophages), and 6 other cancer cell lines (breast, colon, liver, lung, cervical, and blood cancers). c Representative images and quantification of hnRNP F IHC from a human PDAC tissue microarray containing normal pancreas (n = 5), early-stage (n = 70), or late-stage (n = 3) PDAC. Arrows point to ductal cells in the normal pancreas and to tumor cells in PDAC. d Scatter plot of HNRNPF expression and H3K27Ac signal at the HNRNPF SE in 16 human PDAC cell lines. e Box plots showing cumulative tag counts at the HNRNPF SE in all cancer cell lines listed above (n = 23) compared to normal tissues (n = 10; pancreas tissues and normal cell lines listed above). f Genome browser tracks showing H3K27Ac signal, open chromatin regions, and BRD4 signal at the HNRNPF locus. The black bar indicates the SE, and scissors indicate the deleted base pairs in the SE deleted cells. g RT-qPCR showing HNRNPF expression, normalized to GAPDH, in MIA PaCa-2 parental and HNRNPF SE deleted cells (n = 6 biological replicates). h Representative immunoblot (top) and quantification (bottom) showing hnRNP F protein levels in MIA PaCa-2 parental and HNRNPF SE deleted cells (n = 4 biological replicates). i Cell confluence determined using IncuCyte software from phase-contrast images of MIA PaCa-2 parental and HNRNPF SE deleted cells (n = 3 independent experiments). j Tumor weights from mice orthotopically transplanted with MIA PaCa-2 parental (n = 5) or HNRNPF SE deleted (n = 5) cells. k Representative images (left;) and quantification (right) of tumor sections stained with Ki67 from 2 fields per biological replicate (n = 10). Box plots indicate median (middle line), 25th, 75th percentile (box), 10th and 90th percentile (whiskers), and outliers (single points) for (c), (e) and (k), with outliers omitted for (b). Data represent means ± SEM in (g), (h), and (j) and means ± SD in (i). Two-sided Friedman test with Dunn’s multiple comparisons for matched non-parametric data was used in (b), unpaired Mann–Whitney test in (g, h), and unpaired two-tailed t-test in (ik). ns: not significant. Scale bar: 100 μm. Source data are provided as a Source Data file.
Fig. 2
Fig. 2. Perturbation of the HNRNPF gene impairs tumor growth.
a Representative immunoblot from two independent experiments showing hnRNP F protein levels in MIA PaCa-2 parental or HNRNPF KO cells. b Cell confluence determined using IncuCyte software from phase-contrast images of MIA PaCa-2 parental cells, HNRNPF KO cells, or HNRNPF SE deleted cells in which the HNRNPF gene was also knocked out (n = 3 independent experiments). c Representative immunoblot from two independent experiments showing hnRNP F levels in FC1245 parental, Hnrnpf KO, or Hnrnpf KO cells rescued with re-expression of exogenous HNRNPF. d Cell confluence determined using IncuCyte software from phase-contrast images of FC1245 parental, Hnrnpf KO, or Hnrnpf KO cells rescued with re-expression of exogenous HNRNPF (n = 3 independent experiments). e Tumor weights from mice orthotopically transplanted with FC1245 parental (n = 4) or Hnrnpf KO (n = 5) cells. Data represent means ± SEM in (d) and (e) and means ± SD in (b). One-way ANOVA with Sidak’s multiple comparisons test was performed in (b) and (d) and unpaired two-tailed t-test in (e). ns: not significant. Source data are provided as a Source Data file.
Fig. 3
Fig. 3. hnRNP F regulates PRMT1 levels to control cellular proliferation.
a Venn diagram showing the overlap among eCLIP targets in AA0779E cells, genes downregulated upon HNRNPF knockdown in AA0779E cells, and genes downregulated upon Hnrnpf KO in mouse FC1245 cells. b Browser tracks displaying hnRNP F binding to PRMT1 mRNA; 3’UTR is boxed in red. c RT-qPCR showing expression levels of HNRNPF and PRMT1, normalized to GAPDH, in MIA PaCa-2 cells knocked down with siRNA against HNRNPF or a non-targeting control (n = 3 biological replicates). d Representative immunoblot (left) and quantification (right) showing Prmt1 levels in FC1245 parental and Hnrnpf KO cells (n = 3 biological replicates). e RT-qPCR showing levels of an exogenously expressed luciferase gene containing the 3’UTR of Prmt1, normalized to RFP driven by an independent promoter on the same plasmid, in FC1245 parental, Hnrnpf KO, or Hnrnpf KO cells rescued by exogenous HNRNPF re-expression (n = 6 biological replicates). f Representative immunoblot from two independent experiments showing Prmt1 and hnRNP F levels in FC1245 parental, Hnrnpf KO, or Hnrnpf KO cells rescued with re-expression of exogenous Prmt1. g Cell confluence determined using IncuCyte software from phase-contrast images of FC1245 parental, Hnrnpf KO, or Hnrnpf KO cells rescued with re-expression of exogenous Prmt1 (n = 3 independent experiments). Data represent means ± SEM in (ce) and (g). Unpaired two-tailed t-test with two-stage step-up multiple comparison correction was performed in (c), one-way ANOVA followed by Tukey’s multiple comparisons test in (d, e), and one-way ANOVA with Sidak’s multiple comparisons test in (g). ns: not significant. Source data are provided as a Source Data file.
Fig. 4
Fig. 4. Loss of PRMT1 impedes tumor growth.
a Representative immunoblot from two independent experiments of Prmt1 levels in FC1245 parental, Prmt1 KO, or Prmt1 KO cells rescued with re-expression of exogenous Prmt1. Cell confluence determined using IncuCyte software from phase-contrast images of b FC1245 parental, Prmt1 KO, or Prmt1 KO cells rescued with re-expression of exogenous wild-type Prmt1 (n = 3 independent experiments) and c FC1245 parental, Prmt1 KO, or Prmt1 KO cells expressing exogenous catalytically dead Prmt1 (n = 4 independent experiments). d Tumor weights from C57BL/6J mice orthotopically transplanted with FC1245 parental (n = 3), Prmt1 KO (n = 4), or Prmt1 KO cells re-expressing Prmt1 (n = 4) and sacrificed 4 weeks after transplant. Data represent means ± SD in (b, c) and means ± SEM in (d). One-way ANOVA with Sidak’s multiple comparisons test was performed in (b, c) and one-way ANOVA followed by Tukey’s multiple comparison test in (d). ns: not significant. Source data are provided as a Source Data file.
Fig. 5
Fig. 5. Prmt1 regulates global protein translation via Ubap2l asymmetric dimethylation.
a Representative immunoblot (top) and densitometric quantification (bottom) of whole cell extracts from puromycin-treated FC1245 parental, Prmt1 KO, or Prmt1 KO cells rescued by re-expression of exogenous Prmt1 (n = 5 independent experiments). b Polysome profiling of FC1245 parental or Prmt1 KO cells showing the normalized absorbance at 260 nm during fractionation of polysomes (n = 3 biological replicates). c Representative immunoblot from three independent experiments showing Prmt1 and asymmetrically dimethylated arginine-containing protein (ASYM24) levels in FC1245 parental and Prmt1 KO cells. d (Top) Schematic of UBAP2L protein structure displaying the N-terminal ubiquitin-associated (UBA) domain and the Arg–Gly–Gly (RGG) domain that contains the two Arginines asymmetrically dimethylated by Prmt1 (red ovals). (Bottom) Extracted MS1 chromatographic peak of the listed Ubap2l peptide, showing dimethylation at both R’s in the N-terminal RGGR motif. FC1245 parental peptide was labeled light and the Prmt1 KO sample was labeled heavy. e Representative images (left) and quantification (right) of UBAP2L IHC from a human PDAC tissue microarray containing biological replicates of early (n = 149) or late (n = 13) stage PDAC. Scale bar: 100 µm. f Representative immunoblot (left) and quantification (right) of input and RNA interactome capture (RIC) fractions using antibodies against Ubap2l (n = 7 independent experiments) and Rps3 (n = 3 independent experiments). Data represent the mean ± SEM in (a, b) and (f). Box plots indicate median (middle line), 25th, 75th percentile (box), 10th and 90th percentile (whiskers), and outliers (single points). One-way ANOVA followed by Dunn’s multiple comparisons test was performed in (a), unpaired two-tailed t-test in (b) and (f), and two-tailed Mann–Whitney test in (e). ns: not significant. Source data are provided as a Source Data file.
Fig. 6
Fig. 6. Loss of UBAP2L reduces tumor growth by decreasing global translation.
a Representative anti-puromycin immunoblot (top) and densitometric analysis (bottom) of extracts from puromycin-treated MIA PaCa-2 cells knocked down using siRNAs against UBAP2L, PRMT1, or a non-targeting control (n = 3 biological replicates). b Representative immunoblot from two independent experiments showing Ubap2l levels in FC1245 parental and Ubap2l KO cells. c Cell confluence determined using IncuCyte software from phase-contrast images of FC1245 parental or Ubap2l KO cells (n = 3 independent experiments). d mRNA expression of the indicated rRNAs, normalized to Gapdh, in FC1245 parental, Prmt1 KO, and Ubap2l KO cells (n = 3 biological replicates). e Representative immunoblot (top) and quantification (bottom) showing Rpl31 protein levels, normalized to Vinculin, in FC1245 parental and Ubap2l KO cells (n = 3). f Tumor weights from mice orthotopically transplanted with FC1245 parental or Ubap2l KO cells (n = 3). g Representative images (left) and quantification (right) of tumor sections of FC1245 parental and Ubap2l KO tumors stained with Rpl31 (n = 6 from 2 fields per sample; scale bar: 100 μm). Data represent means ± SEM in (a, d, eg), and means ± SD in (c). One-way ANOVA followed by Tukey’s multiple comparison test was performed in (a), unpaired two-tailed t-test in (c) and (eg), and two-way ANOVA with Dunnett’s multiple comparison test in (d). ns: not significant. Source data are provided as a Source Data file.
Fig. 7
Fig. 7. Myc coordinates the Hnrnpf-Prmt1-Ubap2l network.
a Genome browser tracks (from one of two independent experiments) showing Myc binding at the Hnrnpf, Prmt1, and Ubap2l loci upon activation of MycERT2 with 4-OHT for the indicated time points. b RT-qPCR showing Hnrnpf, Prmt1, and Ubap2l expression, normalized to Actb, in mouse pancreatic epithelial cells in which MycERT2 was activated with 4-OHT for the indicated time points. Data represent the mean ± SEM from three biological replicates. One-way ANOVA followed by Tukey’s multiple comparison test was used. ns: not significant. Source data are provided as a Source Data file.
Fig. 8
Fig. 8. Inhibition of PRMT1 impedes tumor growth.
a Caspase-3/7 activity assay showing quantification of % apoptotic cells (left) and representative images (right) of MIA-PaCa2 cells treated with the indicated TC-E 5003 doses for 16 h (n = 2 independent experiments). The cells labeled in green are undergoing apoptosis. Scale bar: 100 μm. b Cell viability assay showing dose-response curves for MYC-high organoids hF3 (N = 4), hF23 (N = 3), and hT3 (N = 3) and MYC-low organoids hM19A (N = 4), hM1E (N = 4), and hF44 (N = 4) treated with the indicated PRMT1 inhibitors for 5 days. c Tumor weights, normalized to vehicle, from mice orthotopically transplanted with FC1245 parental cells and treated 10 days post-transplant with AMI-408 or vehicle (n = 4) or with TC-E 5003 or vehicle (n = 7) for 2 weeks. d Representative images (top) and quantification (bottom) of Ki67-stained tumor sections from mice treated with vehicle or AMI-408 (N = 16 from 4 fields per sample) or with vehicle or TC-E 5003 (N = 14 from 2 fields per sample). Scale bar: 100 µm. e Model showing that the HNRNPF SE regulates tumor growth by driving the expression of HNRNPF. In turn, hnRNP F regulates Prmt1 mRNA levels. Prmt1 asymmetrically dimethylates Ubap2l, which regulates the expression of rRNA and ribosomal proteins to control protein translation. Increased protein translation leads to increased tumor growth. Myc transcriptionally coordinates this entire program. The figure was partly generated using Servier Medical Art, provided by Servier, licensed under a Creative Commons Attribution 3.0 unported license. Data represent the mean ± SEM in (ac). Data in (a) represent means and the range. Box plots in (d) indicate median (middle line), 25th, 75th percentile (box), minima and maxima (whiskers). One-way ANOVA with Tukey’s multiple comparison test was used to compare IC50s in (b). For both PRMT1-2e and TC-E 5003, hM19A vs hF3, hF23 or hT3 p < 0.0001, hM1E vs hF3, hF23 or hT3 p < 0.0001, hF44 vs hF3, hF23 or hT3 p < 0.0001. The remaining comparisons were not significant. An unpaired two-tailed t-test was performed in (c) and a two-tailed Mann–Whitney test in (d). ns: not significant. Source data are provided as a Source Data file.

References

    1. Rahib L, et al. Projecting cancer incidence and deaths to 2030: the unexpected burden of thyroid, liver, and pancreas cancers in the United States. Cancer Res. 2014;74:2913–2921. - PubMed
    1. Siegel RL, Miller KD, Fuchs HE, Jemal A. Cancer statistics, 2022. CA Cancer J. Clin. 2022;72:7–33. - PubMed
    1. Waters, A. M. & Der, C. J. KRAS: the critical driver and therapeutic target for pancreatic cancer. Cold Spring Harb. Perspect. Med.8, a031435 (2018). - PMC - PubMed
    1. Chen H, Liu H, Qing G. Targeting oncogenic Myc as a strategy for cancer treatment. Signal Transduct. Target. Ther. 2018;3:5. - PMC - PubMed
    1. Hong S. RNA binding protein as an emerging therapeutic target for cancer prevention and treatment. J. Cancer Prev. 2017;22:203–210. - PMC - PubMed

Publication types