. 2023 Sep 6;14(1):5480.
doi: 10.1038/s41467-023-41160-6.

Cold-activated brown fat-derived extracellular vesicle-miR-378a-3p stimulates hepatic gluconeogenesis in male mice

Affiliations

Cold-activated brown fat-derived extracellular vesicle-miR-378a-3p stimulates hepatic gluconeogenesis in male mice

Jinhong Xu et al. Nat Commun. .

Abstract

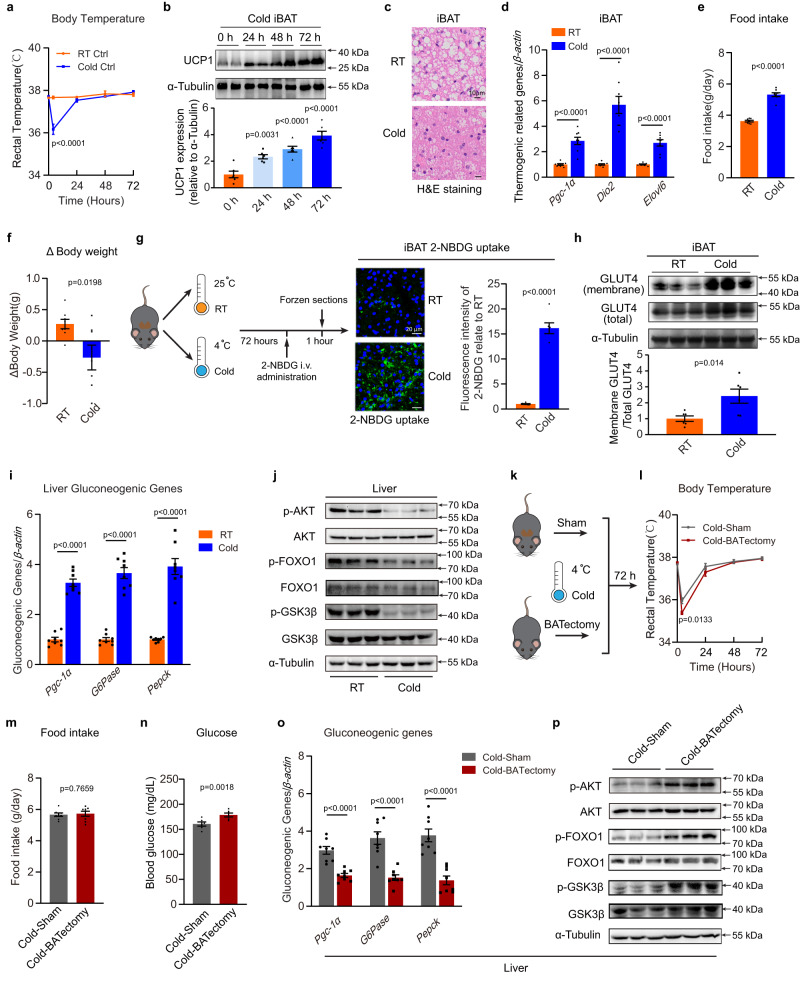
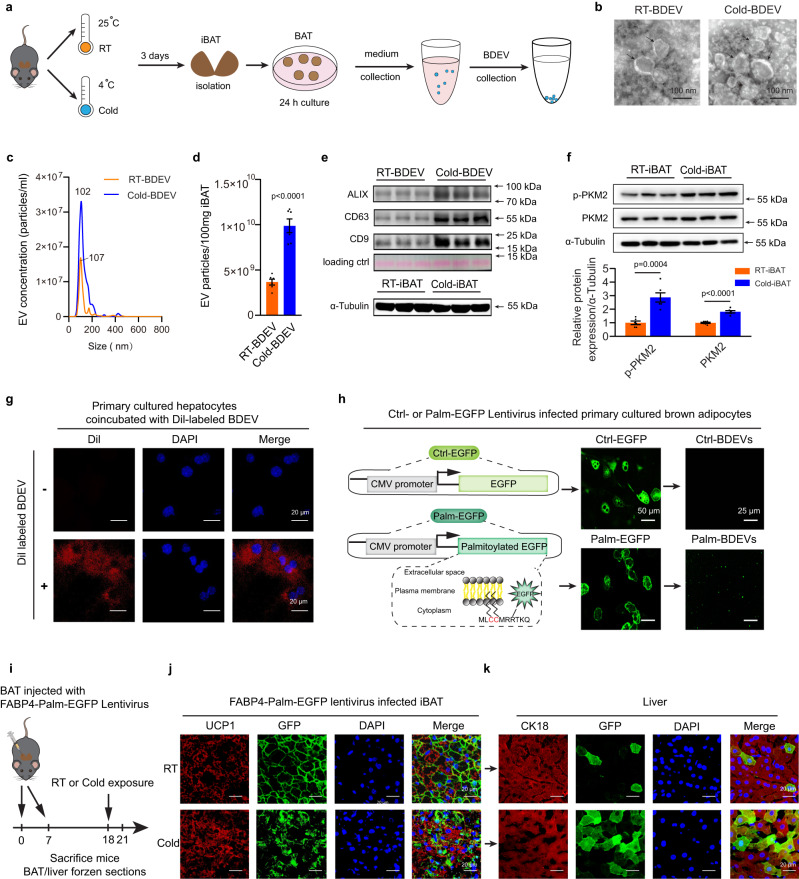
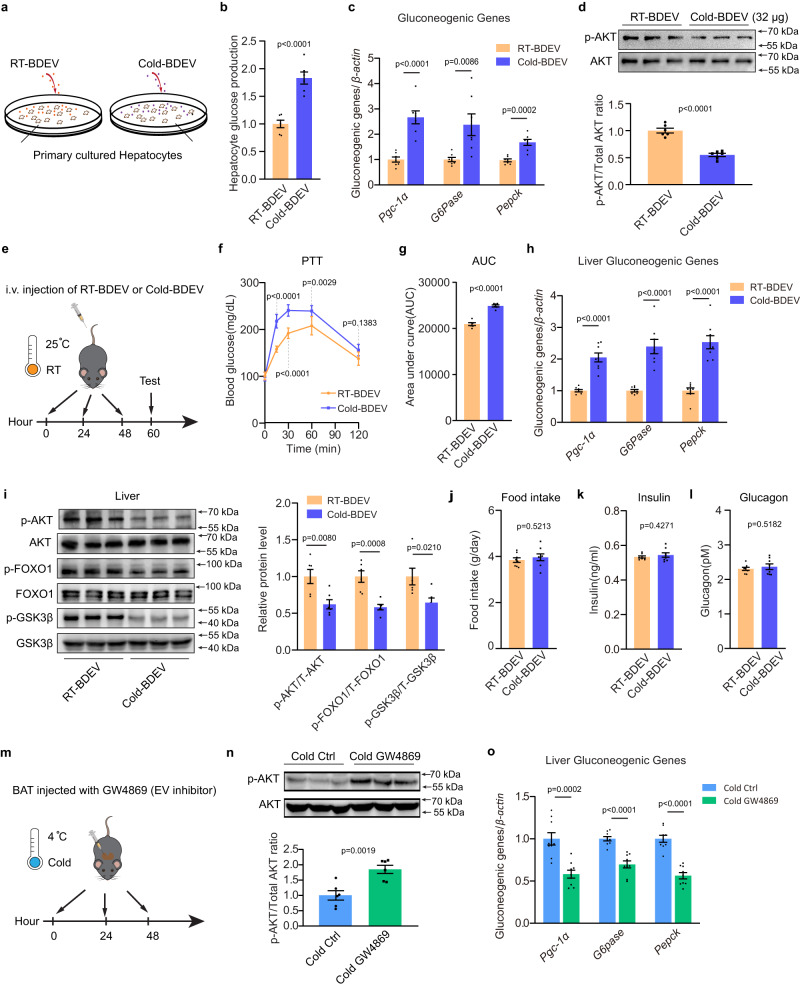
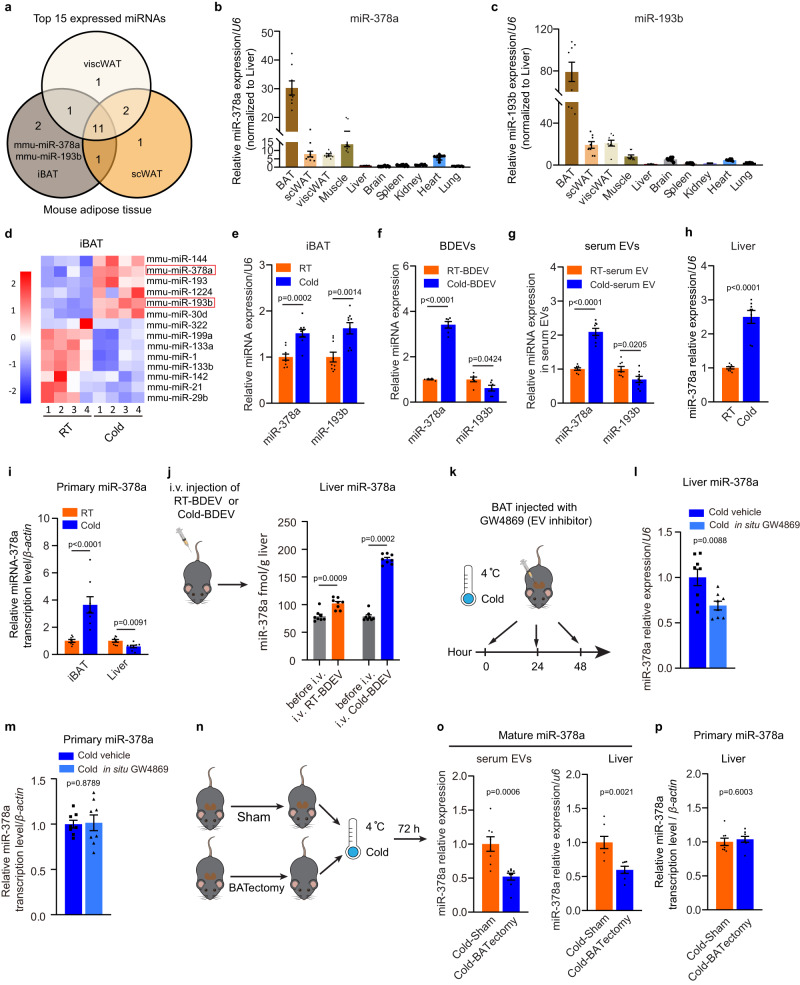
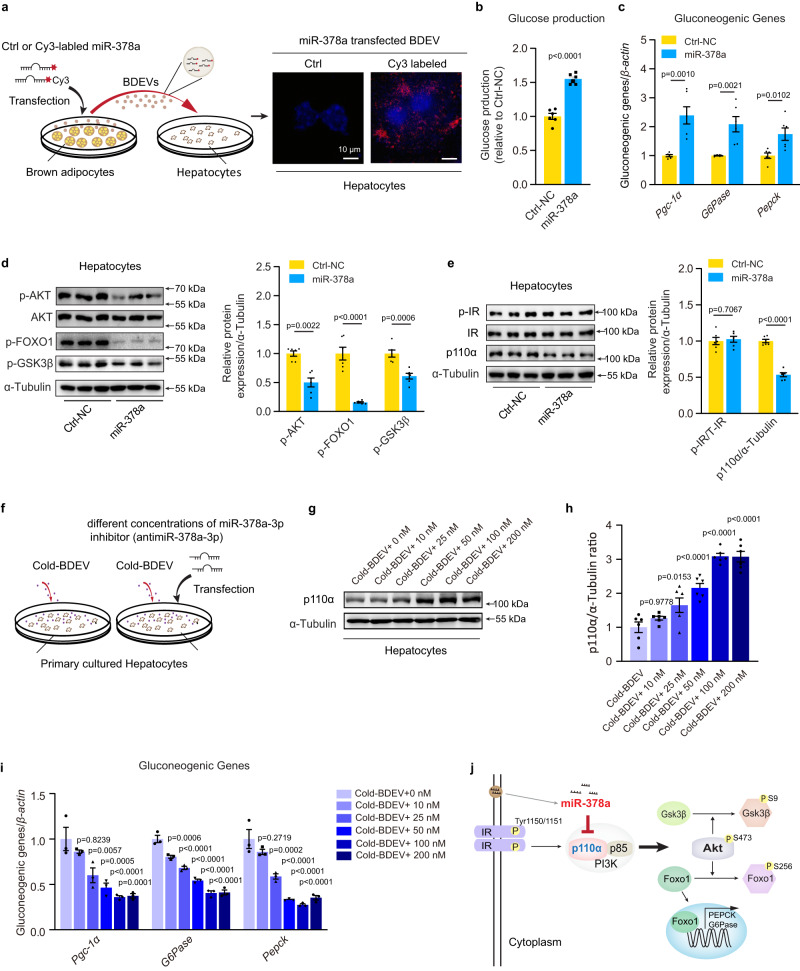
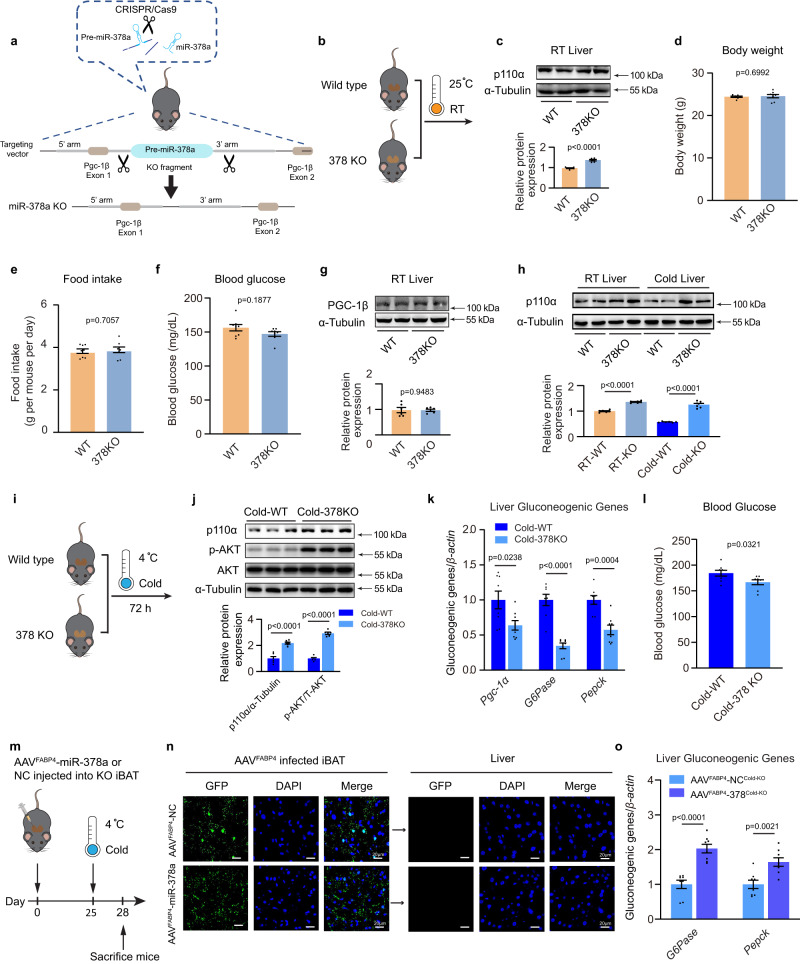
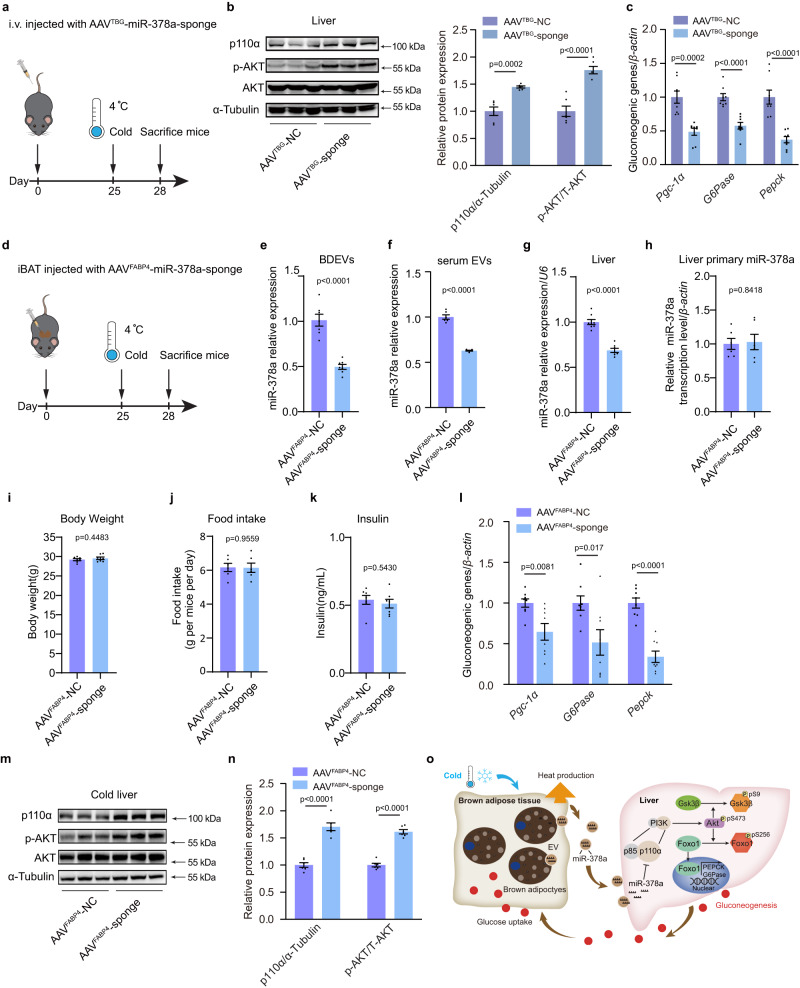
During cold exposure, activated brown adipose tissue (BAT) takes up a large amount of circulating glucose to fuel non-shivering thermogenesis and defend against hypothermia. However, little is known about the endocrine function of BAT controlling glucose homoeostasis under this thermoregulatory challenge. Here, we show that in male mice, activated BAT-derived extracellular vesicles (BDEVs) reprogram systemic glucose metabolism by promoting hepatic gluconeogenesis during cold stress. Cold exposure facilitates the selective packaging of miR-378a-3p-one of the BAT-enriched miRNAs-into EVs and delivery into the liver. BAT-derived miR-378a-3p enhances gluconeogenesis by targeting p110α. miR-378 KO mice display reduced hepatic gluconeogenesis during cold exposure, while restoration of miR-378a-3p in iBAT induces the expression of gluconeogenic genes in the liver. These findings provide a mechanistic understanding of BDEV-miRNA as stress-induced batokine to coordinate systemic glucose homoeostasis. This miR-378a-3p-mediated interorgan communication highlights a novel endocrine function of BAT in preventing hypoglycemia during cold stress.


Conflict of interest statement

The authors declare no competing interests.

Figures

Fig. 1
Fig. 1. BAT stimulates hepatic gluconeogenesis upon cold exposure.
aj Eight-week-old male C57BL6/J mice were placed in RT (25 °C) or cold (4 °C) for 72 hours and fasted for 4 hours before sacrifice. a Rectal temperature at 0, 4, 24, 48, and 72 h (n = 6 biological replicates, from 2 independent experiments). b Western blotting and densitometry analysis of UCP1 protein levels in iBAT (n = 6 biological replicates, from 3 independent experiments). c H&E staining, scale bars:10 μm. (n = 6 each group, 3 random fields per sample, representative images were shown). d Relative expression of thermogenic-related genes in iBAT, e food intake and f body weight change (n = 8 biological replicates, from 2 independent experiments). g Experimental schematic (left panel), fluorescence image of 2-NBDG uptake into iBAT (medium panel, scale bars: 20 μm), and densitometry analysis of positive signals (right panel) (n = 3 each group, 5 random fields per sample, representative images were shown). h Western blotting and densitometry analysis of GLUT4 expression in the membrane and total fractions of iBAT. (n = 6 each group, from 2 independent experiments). i Relative expression of gluconeogenic-related genes in the liver (n = 8 each group, from 2 independent experiments). j Western blotting analysis of total and phosphorylated AKT, FOXO1 and GSK3β in liver. (n = 6 for each group, from 2 independent experiments). kp Eight-week-old male C57BL6/J mice underwent BATectomy or a sham procedure. Following a 10-day recovery period, the mice were placed in cold for 72 h and fasted for 4 h before sacrifice. k Experimental schematic. l Rectal temperature at 0, 4, 24, 48, and 72 h (n = 6 biological replicates, from 2 independent experiments). m Food intake, n blood glucose and o relative expression of gluconeogenic-related genes in liver (n = 8 each group, from 2 independent experiments). p Western blotting analysis of total and phosphorylated AKT, FOXO1 and GSK3β in liver. (n = 6 each group, from 2 independent experiments). Data presented as mean ± sem. Statistical analysis was performed two-way ANOVA followed by Bonferroni’s multiple comparisons test a, l, one-way ANOVA followed by Bonferroni’s multiple comparisons test b and others performed two-sided unpaired t-test. Source data are provided as a Source Data file.
Fig. 2
Fig. 2. Cold exposure induces BAT-derived EV secretion and delivery into the liver.
ae iBAT-derived extracellular vesicle (BDEV) collection. Eight-week-old male C57BL6/J mice placed in RT (25 °C) or cold (4 °C) for 72 h. 100 mg RT-BAT or Cold-BAT was cultured for EV collection. a Experimental schematic. b Representative transmission electron microscopy (TEM) image. Scale bar: 100 nm. (n = 3 each group, 5 random fields per sample, representative images were shown). c Nanoparticle tracking analysis (NTA) of RT-BDEVs and Cold-BDEVs (n = 6 each group, from 2 independent experiments). d Quantification of RT-BDEVs and Cold-BDEVs from 100 mg iBAT (n = 6 each group, from 2 independent experiments). e Western blotting detection of EV markers ALIX, CD63 and CD9 in the RT-BDEVs and Cold-BDEVs. (n = 6 each group, from 2 independent experiments). f Western blotting and densitometry of total and phosphorylated PKM2 in the RT-iBAT and Cold-iBAT (n = 6 each group, from 2 independent experiments). g Confocal microscopy image of primary cultured hepatocytes co-incubation with fluorescent Dil-labelled BDEVs for 6 h. Scale bar: 20 μm. (n = 3 each group, 5 random fields per sample, representative images were shown). h Schematic diagram of the EGFP expression reporters used. Palmitoylated GFP (Palm-EGFP) was used for EV membrane labelling (lower left panel). Microscopy images of primary cultured brown adipocytes infected with lentivirus expressing Ctrl-EGFP or Palm-EGFP reporters (medium panel, scale bar: 50 μm) and their derived BDEVs (right panel, scale bar: 25 μm). (n = 3 each group, 5 random fields per sample, representative images were shown). ik In vivo FABP4-palm-EGFP-labelled BDEV tracking into the liver. Using multipoint injection, 1×10⁸ lentiviral transduction vectors (TUs) expressing Palm-EGFP were inoculated into iBAT, and the mice were housed at RT or cold-exposed for 72 hours prior to sacrifice. i Experimental schematic. j, k Representative confocal microscopy image of co-immunostaining and GFP signal (green) in the iBAT (UCP1, red) j and the liver (CK18, red) k (n = 3 each group, 5 random fields per sample, representative images were shown). Scale bar: 20 μm. Data presented as mean ± sem. Statistical analysis was performed using two-sided unpaired t-test d, f. Source data are provided as a Source Data file.
Fig. 3
Fig. 3. Activated BAT-derived EVs (Cold-BDEVs) enhances hepatic gluconeogenesis.
ad 4 × 106 primary hepatocytes were cocultured with equal proteins of RT-BDEVs or Cold-BDEVs (32 μg) for 48 hours. a Schematic diagram. b Glucose output assay of hepatocytes (n = 6 biological replicates, from 2 independent experiments). c Relative mRNA expression of gluconeogenic genes in hepatocytes (n = 7 biological replicates, from 2 independent experiments). d Western blotting and densitometry analysis of phosphorylated and total AKT in hepatocytes (n = 6 biological replicates, from 2 independent experiments). el Eight-week-old male C57BL6/J mice were administered 80 μg equal protein of RT-BDEVs or Cold-BDEVs once daily for a total of 3 injections, and subsequent studies were performed 12 hours after the last injection. The mice were fasted for 4 h before sacrifice. e Schematic diagram. f Glucose levels during i.p. pyruvate tolerance tests (PTTs) (n = 6 each group, from 2 independent experiment). g Area under the curve of PTT, as indicated in Fig. 3f (n = 6 each group, from 2 independent experiment). h Relative mRNA expression of gluconeogenic genes in the liver (n = 8 each group, from 2 independent experiments). i Western blotting and densitometry analysis of phosphorylated and total AKT, FOXO1 and GSK3β in the liver. (n = 6 each group, from 2 independent experiment). Food intake j, serum insulin k and serum glucagon l levels in BDEV treated mice (n = 8 each group, from 2 independent experiments). mo Cold-exposed eight-week-old male C57BL6/J mice were injected in situ with either GW4869 or control vehicle at 0, 24, and 48 h (for a total of 3 injections) and subsequent studies were performed 4 h after the last injection. The mice were fasted for 4 h before sacrifice. m Schematic diagram. n Western blotting and densitometry analysis of phosphorylated and total AKT in the liver (n = 6 each group, from 2 independent experiments). o Relative mRNA expression of gluconeogenic genes in the liver (n = 9 each group, from 3 independent experiments). Data presented as mean ± sem. Statistical analysis was performed using two-way ANOVA followed by Bonferroni’s multiple comparisons test f and others performed two-sided unpaired t-test. Source data are provided as a Source Data file.
Fig. 4
Fig. 4. Cold exposure increases miR-378a-3p expression in BDEVs.
a Venn diagram depicting the number fat depot-specific miRNAs within the top 15 expressed miRNAs in each indicated fat depot (n = 6 each group, mixed samples). b, c qPCR analysis of the relative levels of miR-378a-3p b and miR-193b-3p c (n = 8 each group, from 2 independent experiments). d Heatmap showing Z scores of miRNA expression in iBAT of mice placed at RT or cold for 72 h (GSE 41306, n = 4 per group). ei Eight-week-old male C57BL6/J mice were placed in RT or cold for 72 hours. eg qPCR analysis of the levels of miR-378a-3p and miR-193b-3p in iBAT (e, n = 9 each group, from 2 independent experiments); in the equal amounts of RT-BDEVs or Cold-BDEVs (f, n = 6 each group, from 2 independent experiments) and serum-EVs from the same volume of serum (g, n = 8 each group, from 2 independent experiments). h qPCR analysis of the relative level of miR-378a-3p in liver (n = 8 each group, from 2 independent experiments). i qPCR analysis of the relative level of primary miR-378a-3p in iBAT and liver (n = 8 each group, from 2 independent experiments). j Eight-week-old male C57BL6/J mice treated with BDEVs each day for 3 injections (left panel). qPCR analysis of the absolute level of miR-378a in the liver 12 h post last injection. (n = 8 each group, from 2 independent experiments). km Cold-exposed eight-week-old male C57BL6/J mice were injected in situ with either GW4869 or control vehicle. Schematic diagram k; qPCR analysis of the relative miR-378a-3p level l and primary miR-378a-3p level m in liver. (n = 8 each group, from 2 independent experiments) np Sham-operated mice or mice with BATectomy were cold-exposed for 72 h. Experimental schematic n; qPCR analysis of the relative miR-378a-3p levels in the serum-EVs and liver o and primary miR-378a-3p in liver p (n = 8 each group, from 2 independent group). Mice were fasted for 4 h before sacrifice. Data presented as mean ± sem. Statistical analysis was performed using Mann Whitney test (two tailed) (j, o left panel) and others performed two-sided unpaired t-test. Source data are provided as a Source Data file.
Fig. 5
Fig. 5. Cold-BDEV-derived miR-378a-3p enhances gluconeogenesis in cultured hepatocytes by targeting p110α.
a Experimental procedure for primary cultured hepatocytes cocultured with miR-378a-3p-overexpressing BDEVs. Primary cultured brown adipocytes were transfected with a Cy3-labelled miR-378a-3p mimic, the EVs secreted by adipocytes were cocultured with primary cultured hepatocytes (left panel). Images of hepatocytes incubated with BDEVs bearing Cy3-tagged miR-378a-3p for 6 hours. Untreated hepatocytes were used as a negative control (right panel). Scale bar: 10 μm. be Primary cultured hepatocytes were transfected with miR-378a-3p for 48 h. Hepatocytes treated with scrambled nucleotide were used as a control. (n = 6 biologically replicates for each group, from 2 independent experiment). b The glucose output assay of administered hepatocytes. c qPCR analysis of the relative expression levels of gluconeogenic genes in hepatocytes. d Western blotting and densitometry analysis of p-AKT, p-FOXO1, and p-GSK3β in hepatocytes. α-Tubulin was used as an internal control. e Western blotting and densitometry analysis of phosphorylated IR, total IR, and p110α in hepatocytes transfected with NC nucleotides or miR-378a-3p mimic for 48 hours. fi 4 × 106 primary cultured hepatocytes transfected with different doses of anti-miR-378a (0 nM, 10 nM, 25 nM, 50 nM, 100 nM, 200 nM) and co-incubation with 32 μg Cold-BDEVs for 48 h. f Schematic diagram. g, h Western blotting detection and densitometry analysis of p110α in hepatocytes. (n = 6 each group, from 2 independent experiment). i Relative mRNA expression of gluconeogenic genes in hepatocytes (n = 3 biological replicates). j Graphic illustration of the miR-378a-3p targeting pathway in hepatocytes. Statistical analysis was performed using one-way ANOVA followed by Bonferroni’s multiple comparisons test h, i and others performed two-sided unpaired t-test. Source data are provided as a Source Data file.
Fig. 6
Fig. 6. Overexpression of miR-378a-3p in BAT regulates liver gluconeogenesis in mice.
am iBAT-specific overexpression of miR-378a-3p induced with adeno-associated virus constructed under the adipose tissue-specific promoter FABP4 (AAVFABP4-378a), a total of 50 μl of 1 ×10⁹ Vg/μl of each AAV was injected into the iBAT in situ of eight-week-old male C57BL6/J mice. Control mice were injected with scrambled Control (AAVFABP4-NC). 28 days post AAV injection, mice were fasted 4 h, followed by qRT-PCR analysis of the relative miR-378a-3p expression level in b iBAT; c serum EVs; and d livers (n = 8 each group, from 2 independent experiments). e Relative level of primary miR-378a-3p in the iBAT and liver (n = 8 each group, from 2 independent experiments); f body weight; g food intake; h serum insulin level; i serum glucagon level; j blood glucose level; (n = 8 each group, from 2 independent experiments); k qPCR analysis of the mRNA levels of gluconeogenic genes in the liver (n = 8 each group, from 2 independent experiments); l Western blotting for p-IR, p-AKT, total IR, AKT and p110α in the liver and m densitometry analysis of p-IR, p-AKT, and p110α. α-Tubulin was used as an internal control (n = 6 each group, from 2 independent experiments). Data presented as mean ± s.e.m. All statistical analysis was performed using two-sided unpaired t-test. Source data are provided as a Source Data file.
Fig. 7
Fig. 7. Restoration of miR-378a-3p in iBAT rescues hepatic gluconeogenesis in miR-378 KO mice.
a Schematic diagram of the miR-378 gene genomic locus and construction for miR-378 KO (378 KO) mice. bg Eight-week-old male miR-378 KO mice and control WT littermates housed at RT. b Schematic diagram. c Western blotting and densitometry analysis of p110α and in liver (n = 6 each group, from 3 independent experiments). d Body weight; e food intake; f blood glucose (n = 8 each group, from 2 independent experiments); g western blotting and densitometry analysis of PGC-1β in liver (n = 6 each group, from 3 independent experiments). h Western blotting and densitometry analysis of p110α in the liver of WT and KO mice at RT or cold for 72 h (n = 6 each group, from 3 independent experiments). il Eight-week-old male miR-378 KO mice and control WT littermates were cold-exposed for 72 h. i Schematic illustration. j Western blotting and densitometry analysis of p110α, p-AKT, and total AKT in the liver (n = 6 each group, from 2 independent experiments). k qPCR analysis of gluconeogenic genes in the liver (n = 8 for each group, from 2 independent experiments). l Blood glucose in mice following cold exposure (n = 8 each group, from 2 independent experiments). mo iBAT-specific overexpression of miR-378a-3p induced with adeno-associated virus constructed under the adipose tissue-specific promoter FABP4 (AAVFABP4-378a), a total of 50 μl of 1 ×10⁹ Vg/μl of each AAV was injected into the iBAT in situ of eight-week-old male 378KO mice. Control mice were injected with AAVFABP4-NC. m Schematic illustration. n Representative confocal microscopy image of GFP signal (green) in the iBAT (left panel) and the liver (right panel) of mice infected with AAV (n = 3 each group, 5 random fields per sample, representative images were shown). Scale bar: 20 μm. o qRT-PCR analysis of the gluconeogenic genes in the livers of cold-exposed KO mice expressing miR-378a (n = 8 each group, from 2 independent experiments). Mice were fasted for 4 h before sacrifice. Data presented as mean ± sem. Statistical analysis was performed using Mann Whitney test (two-tailed) f and others performed two-sided unpaired t-test. Source data are provided as a Source Data file.
Fig. 8
Fig. 8. Depletion of miR-378a-3p in BAT impairs cold-induced hepatic gluconeogenesis.
ac Liver-specific reduction of miR-378a-3p induced with AAV construct under the liver tissue-specific promoter TBG (AAVTBG-sponge), a total of 100 μl of 1 × 109 Vg/μl of each AAV was injected through the tail vein for eight-week-old male C57BL6/J mice. Control mice were injected with AAVTBG-NC. a Schematic figure. b Western blotting for p-AKT, AKT, and p110α in the liver (left panel) and densitometry analysis (right panel), α-Tubulin was used as an internal control (n = 6 each group, from 2 independent experiments). c qPCR analysis of the mRNA levels of gluconeogenic genes in the liver (n = 8 for each group, from 2 independent experiments). dn iBAT-specific reduction of miR-378a-3p induced with adeno-associated virus constructed under the adipose tissue-specific promoter FABP4 (AAVFABP4-sponge), a total of 50 μl of 1 × 109 Vg/μl of each AAV was injected into the iBAT in situ of eight-week-old male C57BL6/J mice. Control mice were injected with AAV9- scrambled Control (NC). qPCR analysis of the relative miR-378a-3p expression level in e BDEVs (n = 7,7); f serum EVs(n = 6,6); and g livers (n = 8,7). h Relative level of primary miR-378a-3p in the liver (n = 6 for each group, from 2 independent experiments). i body weight (n = 7,7); j food intake (n = 6,6); k serum insulin level (n = 7 each group, from 2 independent experiments). l qPCR analysis of the mRNA levels of gluconeogenic genes in the liver (n = 8 each group, from 2 independent experiments). m Western blotting for p-AKT, AKT, p110α and α-Tubulin in the liver and n densitometry analysis of p-AKT, and p110α. α-Tubulin was used as an internal control (n = 6 for each group, from 2 independent experiments). o Graphic illustration of the cold-activated BDEVs-miR-378a-3p stimulates hepatic gluconeogenesis. Mice were fasted for 4 h before the test. Data presented as mean ± sem. All statistical analysis was performed using two-sided unpaired t-test. Source data are provided as a Source Data file.

References

    1. Sidossis L, Kajimura S. Brown and beige fat in humans: thermogenic adipocytes that control energy and glucose homeostasis. J. Clin. Invest. 2015;125:478–486. doi: 10.1172/JCI78362. - DOI - PMC - PubMed
    1. Cannon B, Nedergaard J. Brown adipose tissue: function and physiological significance. Physiol. Rev. 2004;84:277–359. doi: 10.1152/physrev.00015.2003. - DOI - PubMed
    1. Iwen KA, et al. Cold-induced brown adipose tissue activity alters plasma fatty acids and improves glucose metabolism in men. J. Clin. Endocrinol. Metab. 2017;102:4226–4234. doi: 10.1210/jc.2017-01250. - DOI - PubMed
    1. Bartelt A, et al. Brown adipose tissue activity controls triglyceride clearance. Nat. Med. 2011;17:200–205. doi: 10.1038/nm.2297. - DOI - PubMed
    1. van Marken Lichtenbelt WD, et al. Cold-activated brown adipose tissue in healthy men. N. Engl. J. Med. 2009;360:1500–1508. doi: 10.1056/NEJMoa0808718. - DOI - PubMed

Publication types