. 2023 Sep 6;14(1):5471.
doi: 10.1038/s41467-023-41283-w.

Bacteroides Fragilis in the gut microbiomes of Alzheimer's disease activates microglia and triggers pathogenesis in neuronal C/EBPβ transgenic mice

Affiliations

Bacteroides Fragilis in the gut microbiomes of Alzheimer's disease activates microglia and triggers pathogenesis in neuronal C/EBPβ transgenic mice

Yiyuan Xia et al. Nat Commun. .

Abstract

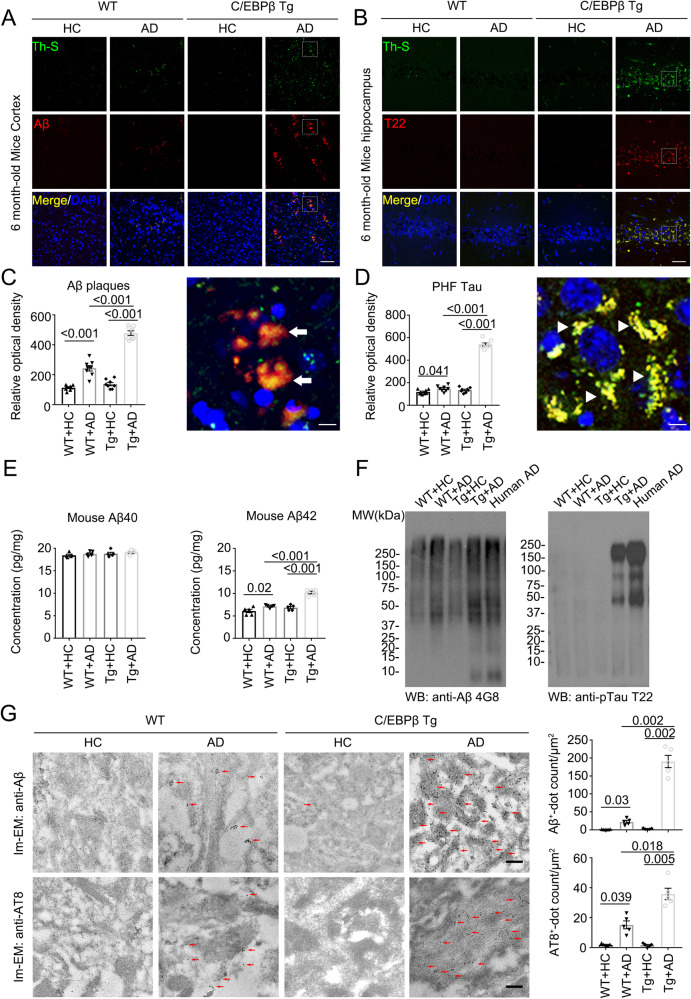
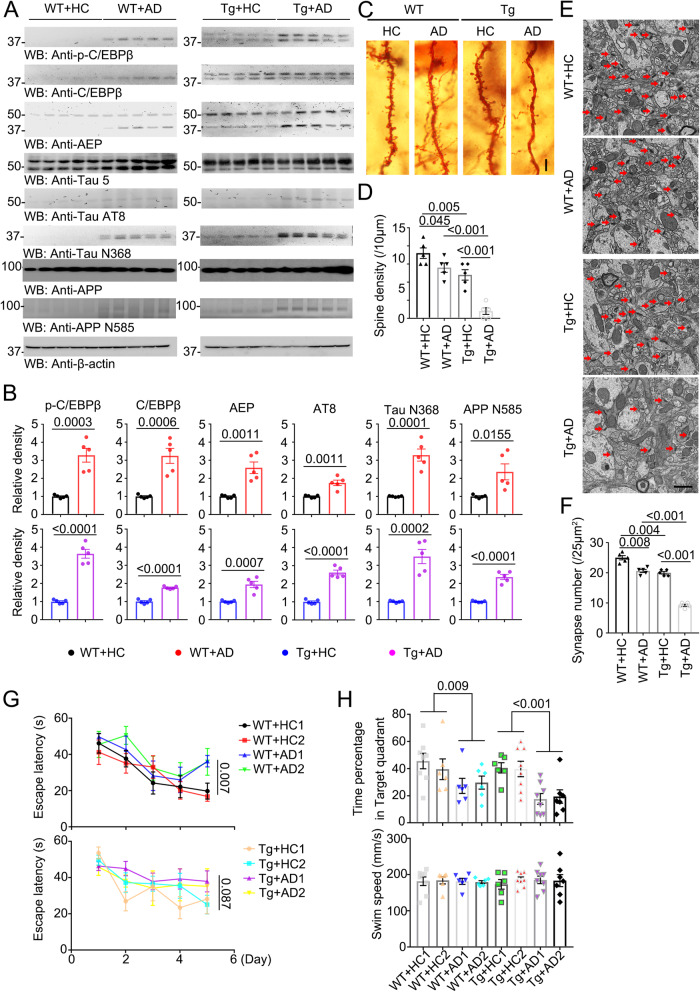
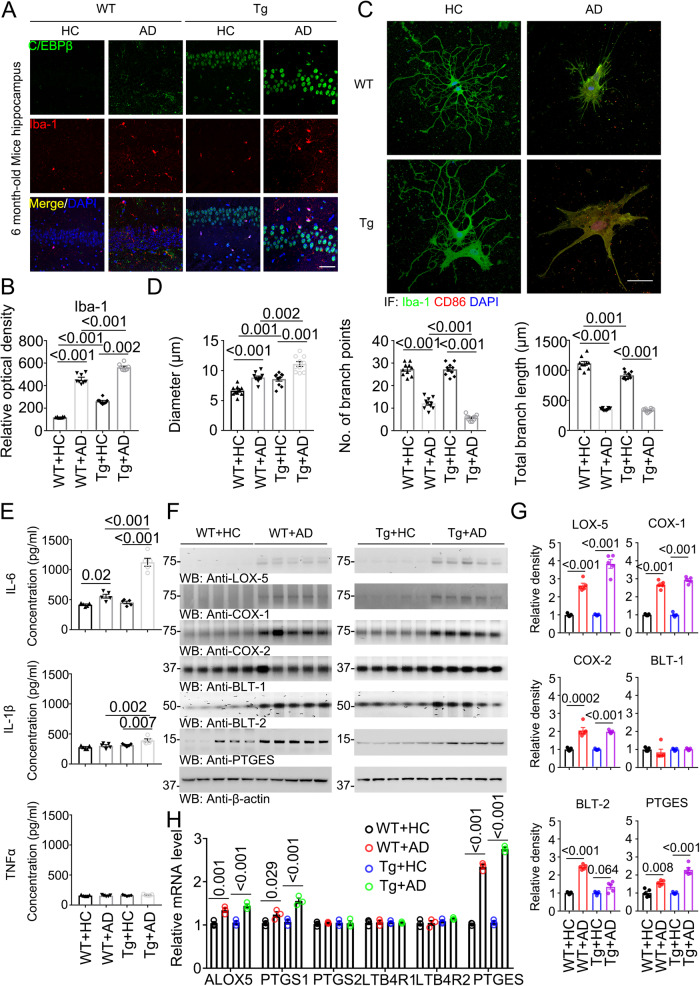
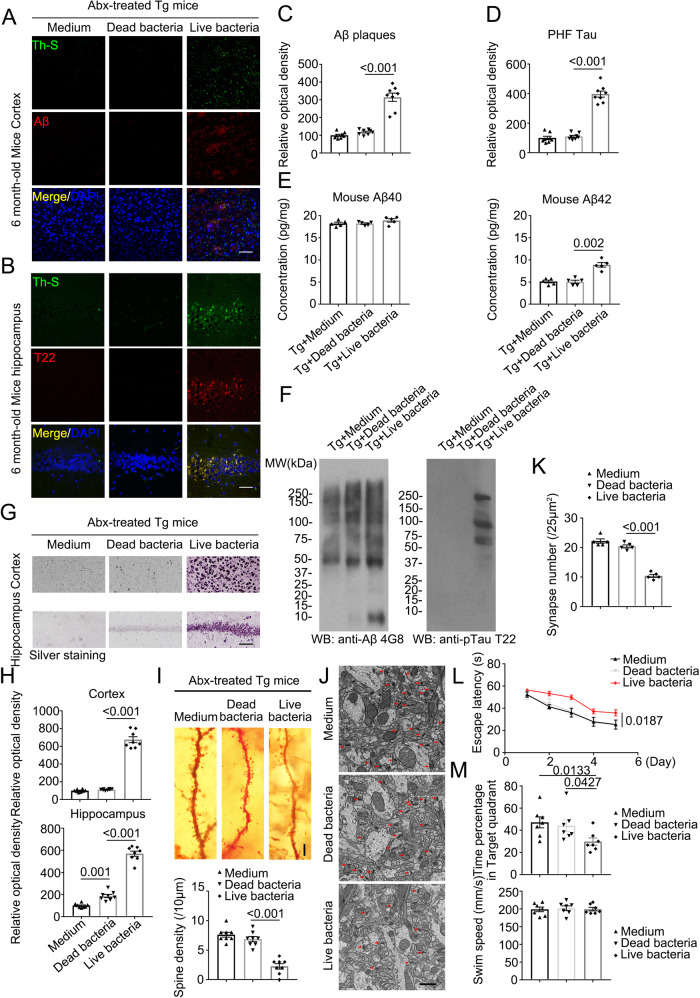
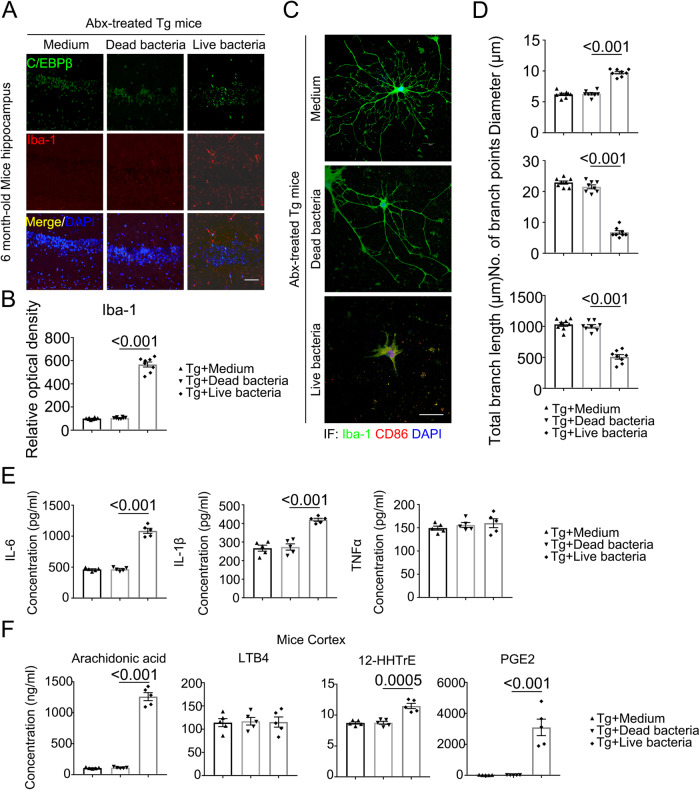
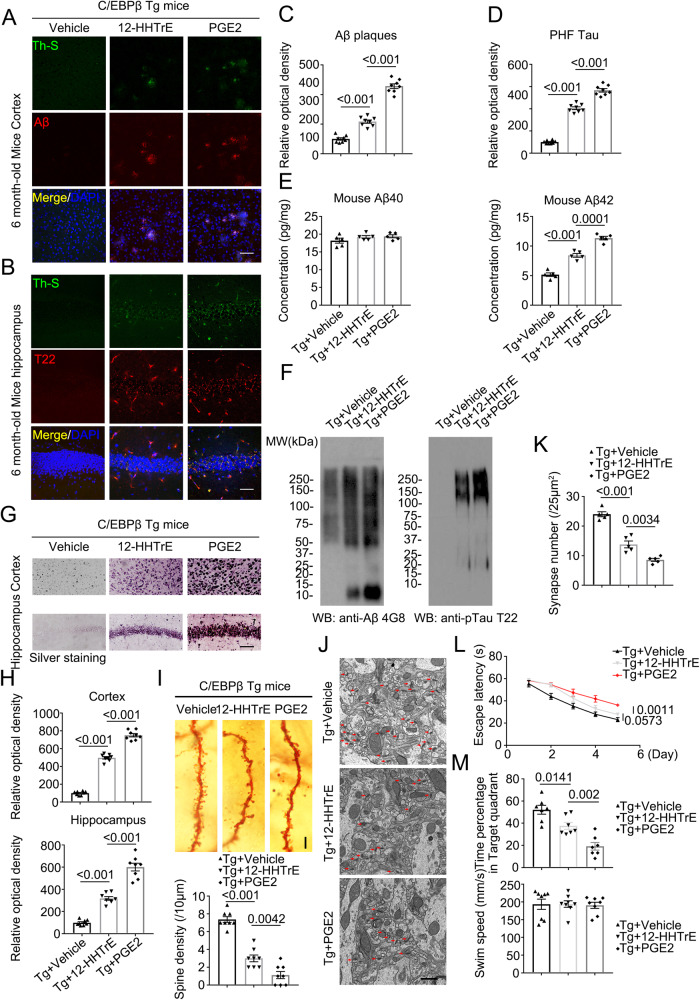
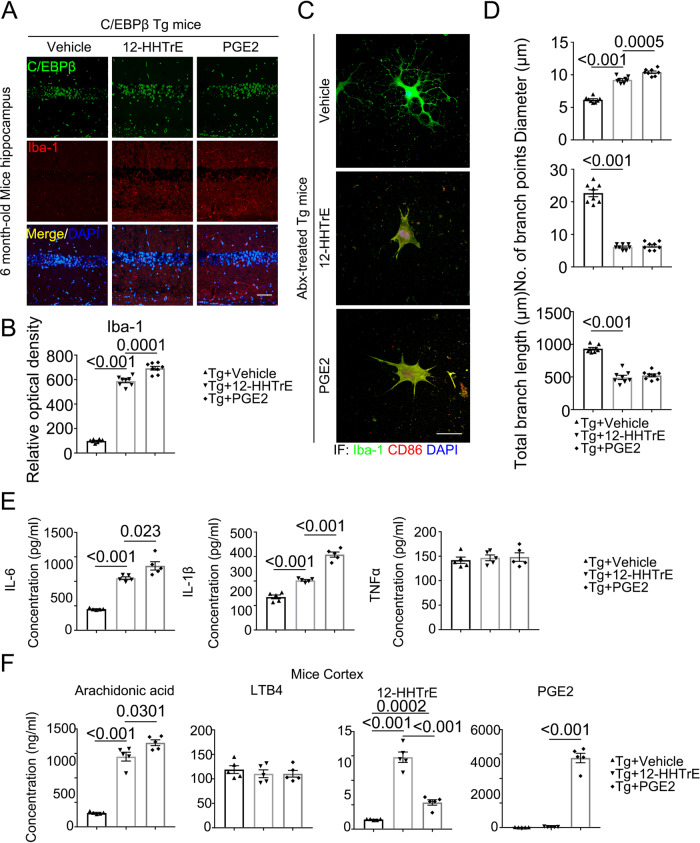
Gut dysbiosis contributes to Alzheimer's disease (AD) pathogenesis, and Bacteroides strains are selectively elevated in AD gut microbiota. However, it remains unknown which Bacteroides species and how their metabolites trigger AD pathologies. Here we show that Bacteroides fragilis and their metabolites 12-hydroxy-heptadecatrienoic acid (12-HHTrE) and Prostaglandin E2 (PGE2) activate microglia and induce AD pathogenesis in neuronal C/EBPβ transgenic mice. Recolonization of antibiotics cocktail-pretreated Thy1-C/EBPβ transgenic mice with AD patient fecal samples elicits AD pathologies, associated with C/EBPβ/Asparaginyl endopeptidase (AEP) pathway upregulation, microglia activation, and cognitive disorders compared to mice receiving healthy donors' fecal microbiota transplantation (FMT). Microbial 16S rRNA sequencing analysis shows higher abundance of proinflammatory Bacteroides fragilis in AD-FMT mice. Active components characterization from the sera and brains of the transplanted mice revealed that both 12-HHTrE and PGE2 activate primary microglia, fitting with poly-unsaturated fatty acid (PUFA) metabolites enrichment identified by metabolomics. Strikingly, recolonization with live but not dead Bacteroides fragilis elicited AD pathologies in Thy1-C/EBPβ transgenic mice, so did 12-HHTrE or PGE2 treatment alone. Collectively, our findings support a causal role for Bacteroides fragilis and the PUFA metabolites in activating microglia and inducing AD pathologies in Thy1- C/EBPβ transgenic mice.


Conflict of interest statement

The authors declare no competing interest.

Figures

Fig. 1
Fig. 1. AD humanized Abx-treated mice display increased AD pathologies compared with HC humanized Abx-treated mice in WT and C/EBPβ Tg mice.
A, B Immunofluorescent staining of Aβ (red) and Th-S (green) in the frontal cortex region of brains, Th-S (green) and T22 (red) in the hippocampus CA1 region of brains from 6-month-old AD humanized Abx-treated mice and HC humanized Abx-treated mice. Scale bar: 40 μm. C Quantitative analysis of Aβ and Th-S positive plaques (left panel, n = 8 biologically independent samples in each group, data are shown as mean ± SEM. one-way ANOVA and Bonferroni’s multiple comparison test). A high magnification picture showed Aβ plaques (Arrow) were significantly increased in AD humanized Abx-treated mice brain (right panel, Scale bar: 10 μm). D Quantitative analysis of T22 and Th-S positive PHFs (left panel, n = 8 biologically independent samples in each group, data are shown as mean ± SEM. one-way ANOVA and Bonferroni’s multiple comparison test). A high magnification picture showed PHF Tau (Arrowhead) were significantly increased in AD humanized Abx-treated mice brain (right panel, Scale bar: 10 μm). E40 and Aβ42 concentrations in the cortex of AD or HC humanized Abx-treated mice were measured using mouse Aβ40 and Aβ42 ELISA kit. the concentration of Aβ42, not Aβ40 was significantly increased in AD humanized Abx-treated mice compared with HC humanized Abx-treated mice cortex. (n = 5 biologically independent samples in each group, data are shown as mean ± SEM, one-way ANOVA and Bonferroni’s multiple comparison test). F Enrichment of aggregated Tau and Aβ in the detergent-insoluble fractions of mouse brains and AD human cortex. Sarkosyl-insoluble fractions were blotted with antibodies against Aβ (4G8), or Tau T22 for Tau oligomers (representative of 3 mice). G immunogold EM showed the aggregated extracellular Aβ and intracellular AT8 in the hippocampus neurons of AD or HC humanized Abx-treated mice. Fibrils like structures (arrows) were highly increased in AD humanized Abx-treated mice (left panels, Scale bar: 200 nm). Quantitative analysis of Aβ and AT8 positive dots. (Right panel, n = 5 biologically independent samples in each group, data are shown as mean ± SEM, one-way ANOVA and Bonferroni’s multiple comparison test).
Fig. 2
Fig. 2. AD humanized Abx-treated mice display increased toxic proteins and declining cognitive functions compared with HC humanized Abx-treated mice in WT and C/EBPβ Tg mice.
A Immunoblot showing p-C/EBPβ, C/EBPβ, AEP, APP and tau expression and processing in 6-month-old mouse brains of AD or HC humanized Abx-treated mice. B Quantitative analysis of immunoblot. The bands of p-C/EBPβ, C/EBPβ, AEP, AT8, TauN368, and APPN585 were measured with image J and normalized with β-actin. (n = 5 biologically independent samples in each group, data are shown as mean ± SEM, two-tailed Student’s t test). C The dendritic spines from the apical dendritic layer of the hippocampus CA1 region were analyzed by Golgi staining. Scale bar: 10 μm. D Quantitative analysis of Golgi staining, (n = 5 biologically independent samples in each group, data are shown as mean ± SEM, one-way ANOVA and Bonferroni’s multiple comparison test). E Electron microscopy analysis of synapses, the number of synapses in CA1 region of AD humanized Abx-treated mice were decreased compared with HC humanized Abx-treated mice. Arrows indicate the synapses. Scale bar, 1 μm. F Quantitative analysis of synapses in CA1, (n = 5 biologically independent samples mice per group, mean ± SEM. one-way ANOVA and Bonferroni’s multiple comparison test). (G & H) Morris Water Maze analysis of cognitive functions. AD humanized Abx-treated mice exacerbated the learning and memory dysfunctions, but does not affect motor function. (mean ± SEM., one-way ANOVA and Bonferroni’s multiple comparison test). WT + HC1 (n = 8 biologically independent samples); WT + HC2 (n = 6 biologically independent samples); WT + AD1 (n = 6 biologically independent samples); WT + AD2 (n = 6 biologically independent samples); Tg+HC1 (n = 6 biologically independent samples); Tg +HC2 (n = 8 biologically independent samples); Tg +AD1 (n = 8 biologically independent samples); Tg +AD2 (n = 7 biologically independent samples).
Fig. 3
Fig. 3. AD humanized Abx-treated mice display increased activated microglia and inflammatory cytokines compared with HC humanized Abx-treated mice in WT and C/EBPβ Tg mice.
A Immunofluorescent staining of Iba-1 (red) and C/EBPβ (green) in the hippocampus CA1 region of the 6-month-old mice brains from AD or HC humanized Abx-treated mice. Scale bar: 40 μm. B Quantitative analysis of Iba-1 optical density (n = 8 biologically independent samples in each group, data are shown as mean ± SEM, one-way ANOVA and Bonferroni’s multiple comparison test). C The high magnification of immunofluorescent staining of Iba-1 (green) and CD86 (red) positive microglia in the hippocampus CA1 region of the brains from AD or HC humanized Abx-treated mice. Scale bar: 40 μm. D Quantitative analysis of diameter, number of branch points, and total branch length in Iba-1 (green) positive microglia. (n = 8 biologically independent samples in each group, data are shown as mean ± SEM, one-way ANOVA and Bonferroni’s multiple comparison test). E Proinflammatory cytokine IL-1β, IL-6 and TNFα concentrations in the brain lysates from AD or HC humanized Abx-treated mice, respectively. (n = 5 biologically independent samples in each group, data are shown as mean ± SEM, one-way ANOVA and Bonferroni’s multiple comparison test). F Immunoblot showing arachidonic acid metabolism products LOX-5, COX-1, COX-2, BLT-1, BLT-2, and PTGES expression and processing in mouse brains of AD or HC humanized Abx-treated mice. G Quantitative analysis of immunoblot. The bands of LOX-5, COX-1, COX-2, BLT-1, BLT-2, and PTGES were measured with image J and normalized with β-actin. (n = 5 biologically independent samples in each group, data are shown as mean ± SEM, two-tailed Student’s t test). H Quantitative RT-PCR analysis of the brain samples from AD or HC humanized Abx-treated mice. Comparing C/EBPβ targeted arachidonic acid pathway genes. (n = 3 in each group, data are shown as mean ± SEM, two-tailed Student’s t test).
Fig. 4
Fig. 4. Live bacteria treated mice display increased AD pathologies and impaired cognitive functions compared with control mice in C/EBPβ Tg mice.
A, B Immunofluorescent staining of Aβ (red) in the frontal cortex region of brains, and T22 (red) in the hippocampus CA1 region of brains from 6-month-old Abx-treated C/EBPβ Tg mice after medium, dead bacteria, or live bacteria (Bacteroides fragilis) gavage for 2 months. Scale bar: 40 μm. C, D Quantitative analysis of positive plaques and PHFs (left panel, n = 8 biologically independent samples/group, data are shown as mean ± SEM, one-way ANOVA and Bonferroni’s multiple comparison test). E Mouse Aβ40 and Aβ42 ELISA. The concentration of Aβ42, not Aβ40 was significantly increased in Bacteroides fragilis gavage Abx-treated C/EBPβ Tg mice compared with medium, or dead bacteria gavage Abx-treated C/EBPβ Tg mice cortex. (n = 5 biologically independent samples/group, data are shown as mean ± SEM, one-way ANOVA and Bonferroni’s multiple comparison test). F Sarkosyl-insoluble fractions were blotted with antibodies against Aβ (4G8), or Tau T22 for Tau oligomers (representative of 3 mice). G Silver staining in cortex and hippocampus. Scale bar: 50 μm. H Quantitative analysis of G (n = 8 biologically independent samples/group, data are shown as mean ± SEM, one-way ANOVA and Bonferroni’s multiple comparison test). I The dendritic spines from the apical dendritic layer of the hippocampus CA1 region were analyzed by Golgi staining. (Upper panel, Scale bar: 10 μm). Quantitative analysis of Golgi staining (n = 8 biologically independent samples/group, data are shown as mean ± SEM, one-way ANOVA and Bonferroni’s multiple comparison test) (lower panel). J Electron microscopy analysis of synapses. Arrows indicate the synapses. Scale bar, 1 μm. K Quantitative analysis of synapses in CA1, (n = 5 biologically independent samples/group, mean ± SEM, one-way ANOVA and Bonferroni’s multiple comparison test). L, M Morris Water Maze analysis of cognitive functions. Abx-treated C/EBPβ Tg mice after live bacteria (Bacteroides fragilis) gavage exacerbated the learning and memory dysfunctions, but did not affect motor function. (mean ± SEM.; n = 7 biologically independent samples/group, one-way ANOVA and Bonferroni’s multiple comparison test).
Fig. 5
Fig. 5. Live bacteria treated mice display increased activated microglia and inflammatory cytokines compared with control mice in C/EBPβ Tg mice.
A Immunofluorescent staining of Iba-1 (red) and C/EBPβ (green) in the hippocampus CA1 region of the brains from 6-month-old Abx-treated C/EBPβ Tg mice after medium, dead bacteria, or live bacteria (Bacteroides fragilis) gavage for 2 months. Scale bar: 40 μm. B Quantitative analysis of Iba-1 optical density (n = 8 biologically independent samples in each group, data are shown as mean ± SEM, one-way ANOVA and Bonferroni’s multiple comparison test). C The high magnification of immunofluorescent staining of Iba-1 (green) and CD86 (red) positive microglia in the hippocampus CA1 region of the brains from Abx-treated C/EBPβ Tg mice after medium, dead bacteria, or live bacteria (Bacteroides fragilis) gavage for 2 months. Scale bar: 40 μm. D Quantitative analysis of diameter, number of branch points, and total branch length in Iba-1 (green) positive microglia. (n = 8 biologically independent samples in each group, data are shown as mean ± SEM, one-way ANOVA and Bonferroni’s multiple comparison test). E proinflammatory cytokine IL-1β, IL- 6 and TNFα concentrations in the brain lysates from Abx-treated C/EBPβ Tg mice after medium, dead bacteria, or live bacteria (Bacteroides fragilis) gavage for 2 months, respectively. (n = 5 biologically independent samples in each group, data are shown as mean ± SEM, one-way ANOVA and Bonferroni’s multiple comparison test). F Concentrations of arachidonic acid (AA) and its metabolites in Abx-treated C/EBPβ Tg mice after medium, dead bacteria, or live bacteria (Bacteroides fragilis) gavage cortex. (n = 5 biologically independent samples in each group, data are shown as mean ± SEM, one-way ANOVA and Bonferroni’s multiple comparison test).
Fig. 6
Fig. 6. 12-HHTrE and PGE2 treated mice display increased AD pathologies and impaired cognitive functions in C/EBPβ Tg mice.
A, B Immunofluorescent staining of Aβ (red) in the frontal cortex region of brains, and T22 (red) in the hippocampus CA1 region of brains from 6-month-old vehicle, 12-HHTrE, or PGE2-treated C/EBPβ Tg mice. Mice received IP injection of the diluted 12-HHTrE, or PGE2 solution at the dose of 5 mg/kg twice a week for 4 weeks. Scale bar: 40 μm. C, D Quantitative analysis of positive plaques and PHFs (left panel, n = 8 biologically independent samples in each group, data are shown as mean ± SEM, one-way ANOVA and Bonferroni’s multiple comparison test). E Mouse Aβ40 and Aβ42 ELISA. (n = 5 biologically independent samples in each group, data are shown as mean ± SEM, one-way ANOVA and Bonferroni’s multiple comparison test). F Sarkosyl-insoluble fractions were blotted with antibodies against Aβ (4G8), or Tau T22 for Tau oligomers (representative of 3 mice). G Silver staining in cortex and hippocampus. Scale bar: 50 μm. H Quantitative analysis of (G). (n = 8 biologically independent samples in each group, data are shown as mean ± SEM, one-way ANOVA and Bonferroni’s multiple comparison test). I The dendritic spines from the apical dendritic layer of the hippocampus CA1 region were analyzed by Golgi staining. (upper panel, Scale bar: 10 μm). Quantitative analysis of Golgi staining (n = 8 biologically independent samples in each group, data are shown as mean ± SEM, one-way ANOVA and Bonferroni’s multiple comparison test) (lower panel). J Electron microscopy analysis of synapses, the number of synapses in CA1 region of 12-HHTrE, or PGE2-treated C/EBPβ Tg mice were decreased compared with vehicle-treated mice. Arrows indicate the synapses. Scale bar, 1 μm. K Quantitative analysis of synapses in CA1, (n = 5 biologically independent samples per group, mean ± SEM, one-way ANOVA and Bonferroni’s multiple comparison test). L, M Morris Water Maze analysis of cognitive functions. 12-HHTrE, or PGE2-treated C/EBPβ Tg mice exacerbated the learning and memory dysfunctions, but does not affect motor function. (mean ± SEM.; n = 7 biologically independent samples per group, one-way ANOVA and Bonferroni’s multiple comparison test).
Fig. 7
Fig. 7. 12-HHTrE and PGE2 treated mice display increased activated microglia and inflammatory cytokines in C/EBPβ Tg mice.
A Immunofluorescent staining of Iba-1 (red) and C/EBPβ (green) in the hippocampus CA1 region of the brains from 6-month-old vehicle, 12-HHTrE, or PGE2-treated C/EBPβ Tg mice. Scale bar: 40 μm. B Quantitative analysis of Iba-1 optical density (n = 8 biologically independent samples in each group, data are shown as mean ± SEM, one-way ANOVA and Bonferroni’s multiple comparison test). C The high magnification of immunofluorescent staining of Iba-1 (green) and CD86 (red) positive microglia in the hippocampus CA1 region of the brains from vehicle, 12-HHTrE, or PGE2-treated C/EBPβ Tg mice. Scale bar: 40 μm. D Quantitative analysis of diameter, number of branch points, and total branch length in Iba-1 (green) positive microglia. (n = 8 biologically independent samples in each group, data are shown as mean ± SEM, one-way ANOVA and Bonferroni’s multiple comparison test). E Proinflammatory cytokine IL-1β, IL-6 and TNFα concentrations in the brain lysates from vehicle, 12-HHTrE, or PGE2-treated C/EBPβ Tg mice, respectively. (n = 5 biologically independent samples in each group, data are shown as mean ± SEM, one-way ANOVA and Bonferroni’s multiple comparison test). F Concentrations of arachidonic acid (AA) and its metabolites in vehicle, 12-HHTrE, or PGE2-treated C/EBPβ Tg mice cortex. (n = 5 biologically independent samples in each group, data are shown as mean ± SEM, one-way ANOVA and Bonferroni’s multiple comparison test).

References

    1. Akiyama H, et al. Inflammation and Alzheimer’s disease. Neurobiol. Aging. 2000;21:383–421. doi: 10.1016/S0197-4580(00)00124-X. - DOI - PMC - PubMed
    1. Heneka MT, Kummer MP, Latz E. Innate immune activation in neurodegenerative disease. Nat. Rev. Immunol. 2014;14:463–477. doi: 10.1038/nri3705. - DOI - PubMed
    1. Cagnin A, et al. In-vivo measurement of activated microglia in dementia. Lancet. 2001;358:461–467. doi: 10.1016/S0140-6736(01)05625-2. - DOI - PubMed
    1. Erny D, et al. Host microbiota constantly control maturation and function of microglia in the CNS. Nat. Neurosci. 2015;18:965–977. doi: 10.1038/nn.4030. - DOI - PMC - PubMed
    1. Medzhitov R. Recognition of microorganisms and activation of the immune response. Nature. 2007;449:819–826. doi: 10.1038/nature06246. - DOI - PubMed

Publication types

LinkOut - more resources