. 2023 Sep 6;13(1):14669.
doi: 10.1038/s41598-023-41567-7.

Conjugation of microbial-derived gold nanoparticles to different types of nucleic acids: evaluation of transfection efficiency

Affiliations

Conjugation of microbial-derived gold nanoparticles to different types of nucleic acids: evaluation of transfection efficiency

P Pourali et al. Sci Rep. .

Abstract

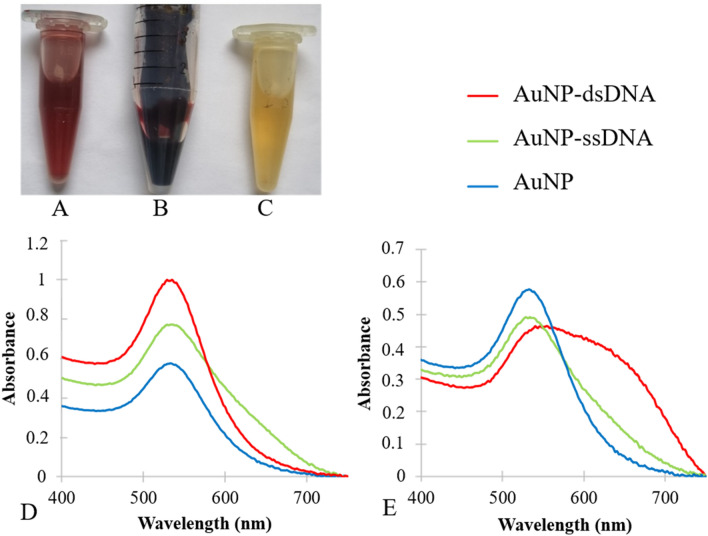
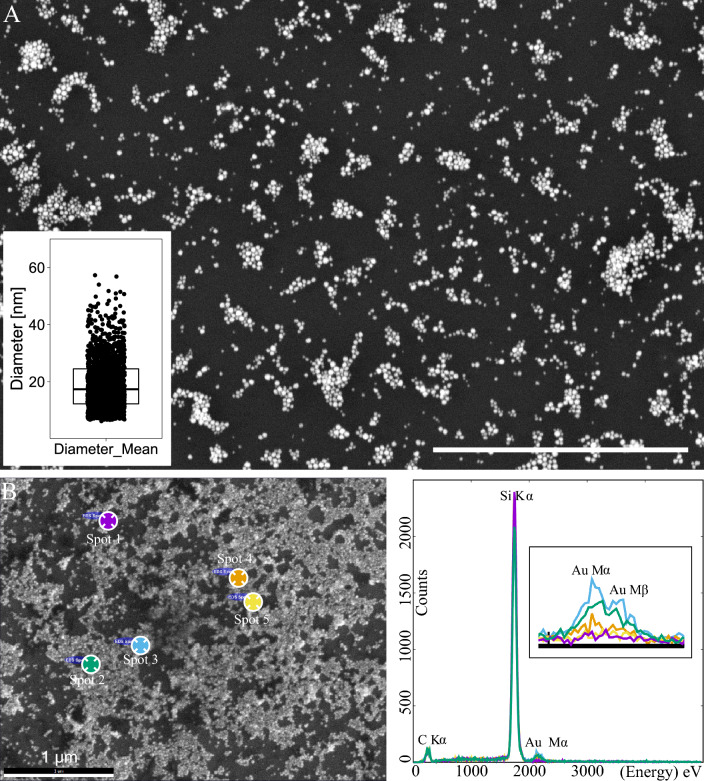
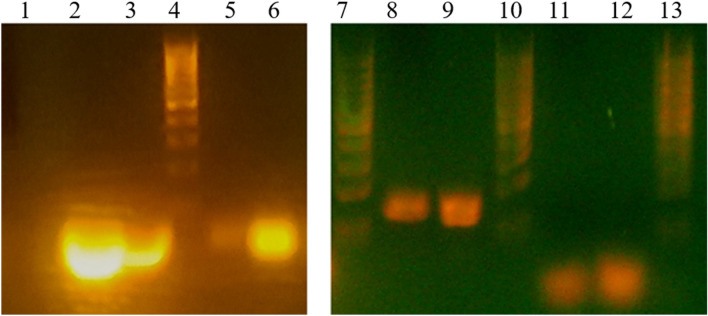
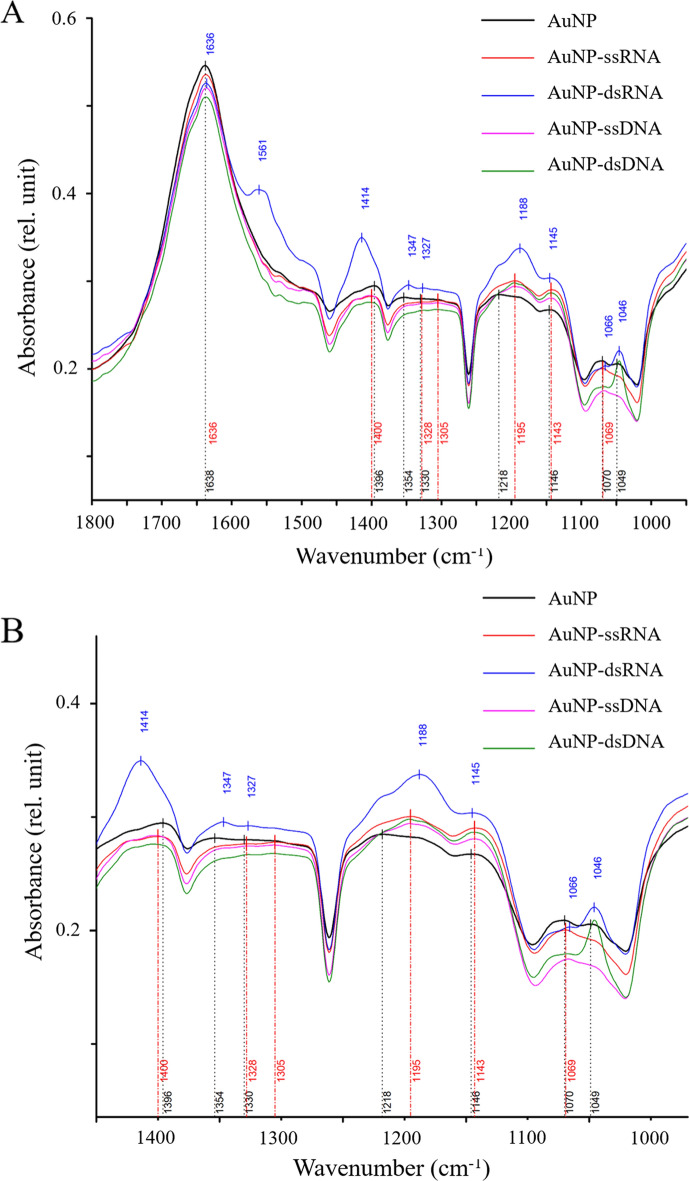
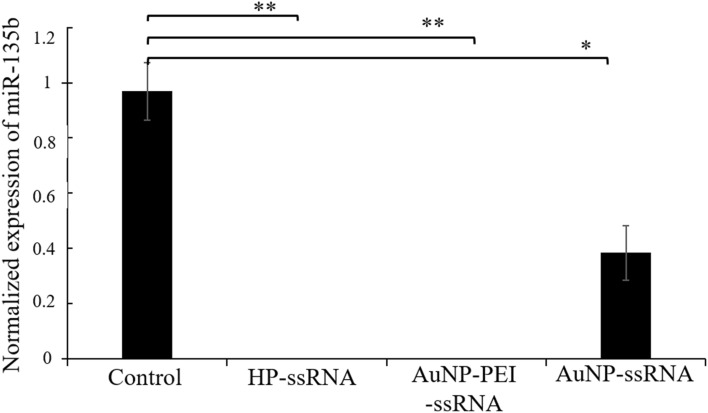
In this study, gold nanoparticles produced by eukaryotic cell waste (AuNP), were analyzed as a transfection tool. AuNP were produced by Fusarium oxysporum and analyzed by spectrophotometry, transmission electron microscopy (TEM), scanning electron microscopy (SEM), and energy dispersive X-ray spectroscopy (EDS). Fourier transform infrared spectroscopy (FTIR) and dynamic light scattering (DLS) were used before and after conjugation with different nucleic acid (NA) types. Graphite furnace atomic absorption spectroscopy (GF-AAS) was used to determine the AuNP concentration. Conjugation was detected by electrophoresis. Confocal microscopy and quantitative real-time PCR (qPCR) were used to assess transfection. TEM, SEM, and EDS showed 25 nm AuNP with round shape. The amount of AuNP was 3.75 ± 0.2 µg/µL and FTIR proved conjugation of all NA types to AuNP. All the samples had a negative charge of - 36 to - 46 mV. Confocal microscopy confirmed internalization of the ssRNA-AuNP into eukaryotic cells and qPCR confirmed release and activity of carried RNA.


Conflict of interest statement

The authors declare no competing interests.

Figures

Figure 1
Figure 1
The produced AuNP, their spectrophotometry results before and after conjugation with NAs. (A) The color-changed supernatant after incubation with HAuCl4⋅3H2O (B), AuNP after washing, and (C) control supernatant. (D) AuNP-dsRNA and AuNP-ssRNA compared to AuNP. The maximum absorption peak of AuNP was 533 nm. (E) AuNP-dsDNA and AuNP-ssDNA compared to AuNP. The Supplementary Tables 1 and 2 show the absorbance values of each conjugate.
Figure 2
Figure 2
TEM images of AuNP with a round or polygonal shape and a size distribution of less than 40 nm. (A) and (B) show the same AuNP (before and after sonication) used for conjugation with different types of nucleic acids. Scale bars = 200 nm for the main images and 50 nm for the inserts. The inserts in the lower panels show the size distribution of the AuNP as a boxplot of the mean diameter of the particles shown in the corresponding panel.
Figure 3
Figure 3
SEM and EDS analysis of AuNP deposited on glow discharge activated silicon wafers and coated with 10 nm carbon. (A) SEM Analysis of AuNP used for conjugation with different types of NAs; a CBS detector at 3 kV. The insert shows the size distribution of AuNP as a boxplot of the mean diameter of the particles. (B) The EDS analysis of the same sample at 10 kV; an ETD detector image with the marked positions of the spectrum acquisition on the left and the corresponding spectra on the right. The insert in the spectra part of B shows the magnified region of Au Mα and Mβ lines with a noticeable difference of the spectra from the background (spots 1 and 5) and the AuNP (spots 2, 3, and 4). Scale bars = 1 µm.
Figure 4
Figure 4
Electrophoretic mobility. Lanes 4, 7, 10 and 13 correspond to the MassRuler low range DNA ladder. Lane 1 is the control AuNP, lane 2 control dsRNA, lane 6 AuNP-dsRNA, lane 3 control ssRNA, lane 5 AuNP-ssRNA. Lane 9 control dsDNA, lane 8 AuNP-dsDNA, lane 11 control ssDNA, and lane 12 is AuNP-ssDNA.
Figure 5
Figure 5
IR Spectra of all AuNP conjugates compared to AuNP as control. (A) The spectra are in the range 900–4000 cm−1. (B) Detailed spectra from the range of 900–1800 cm−1.
Figure 6
Figure 6
Internalization of AuNP-ssDNA- and AuNP-ssRNA- by 4T1 and NIH/3T3 cells. The cells were incubated with conjugates for 30 min or 24 h. Yellow arrows point to the internalized complexes. Cell nuclei are in blue, F-actin filaments are in red, and AuNP-carried NAs are in green. Scale bar = 20 µm.
Figure 7
Figure 7
qPCR-based detection of miR-135b level in 4T1 cells incubated with different conjugates. Control cells incubated only with PBS, cells incubated with HP-ssRNA, AuNP-PEI-ssRNA, and AuNP-ssRNA, respectively. Values of p ≤ 0.05 (*) and p ≤ 0.01 (**) were considered statistically significant between groups.

Similar articles

Cited by

References

    1. Pourali P, et al. Histopathological study of the maternal exposure to the biologically produced silver nanoparticles on different organs of the offspring. Naunyn Schmiedebergs Arch. Pharmacol. 2020;393:867–878. doi: 10.1007/s00210-019-01796-y. - DOI - PubMed
    1. Hainfeld JF, et al. Gold nanoparticle hyperthermia reduces radiotherapy dose. Nanomed. Nanotechnol. Biol. Med. 2014;10:1609–1617. doi: 10.1016/j.nano.2014.05.006. - DOI - PMC - PubMed
    1. Arvizo R, Bhattacharya R, Mukherjee P. Gold nanoparticles: Opportunities and challenges in nanomedicine. Expert Opin. Drug Deliv. 2010;7:753–763. doi: 10.1517/17425241003777010. - DOI - PMC - PubMed
    1. Nel A, Xia T, Mädler L, Li N. Toxic potential of materials at the nanolevel. Science. 2006;311:622–627. doi: 10.1126/science.1114397. - DOI - PubMed
    1. Pourali P, et al. Biosynthesis of gold nanoparticles by two bacterial and fungal strains, Bacillus cereus and Fusarium oxysporum, and assessment and comparison of their nanotoxicity in vitro by direct and indirect assays. Electron. J. Biotechnol. 2017;29:86–93. doi: 10.1016/j.ejbt.2017.07.005. - DOI

Publication types