. 2023 Nov;28(11):4777-4792.
doi: 10.1038/s41380-023-02241-6. Epub 2023 Sep 6.

Circadian rhythm disruptions associated with opioid use disorder in synaptic proteomes of human dorsolateral prefrontal cortex and nucleus accumbens

Affiliations

Circadian rhythm disruptions associated with opioid use disorder in synaptic proteomes of human dorsolateral prefrontal cortex and nucleus accumbens

Stephanie Puig et al. Mol Psychiatry. 2023 Nov.

Abstract

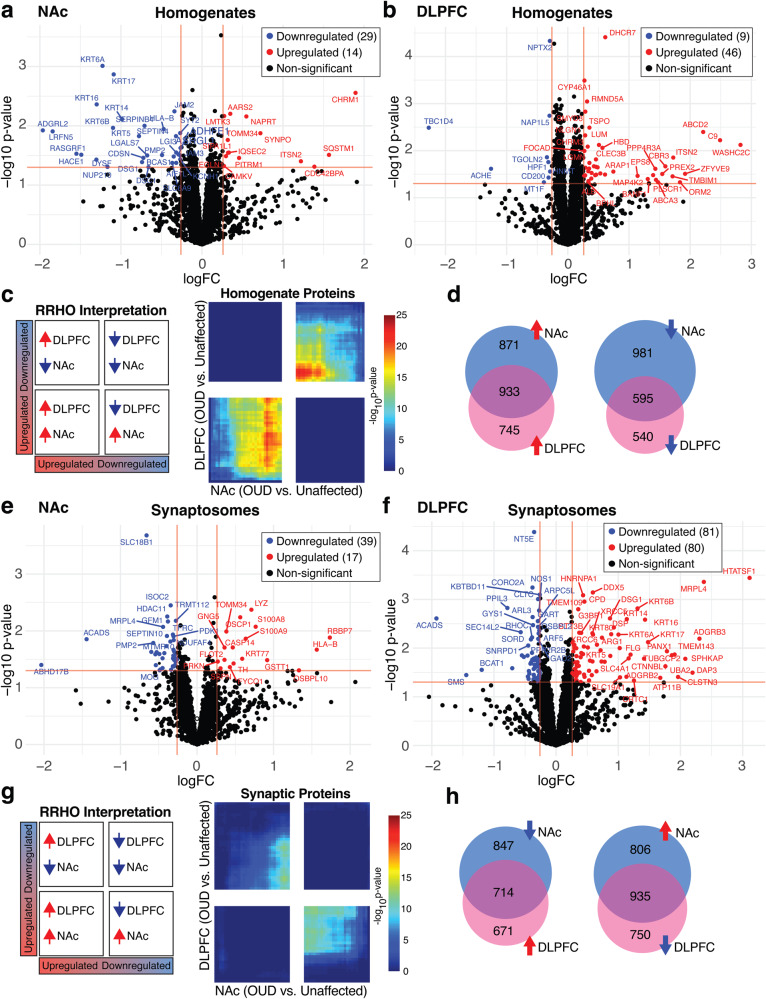
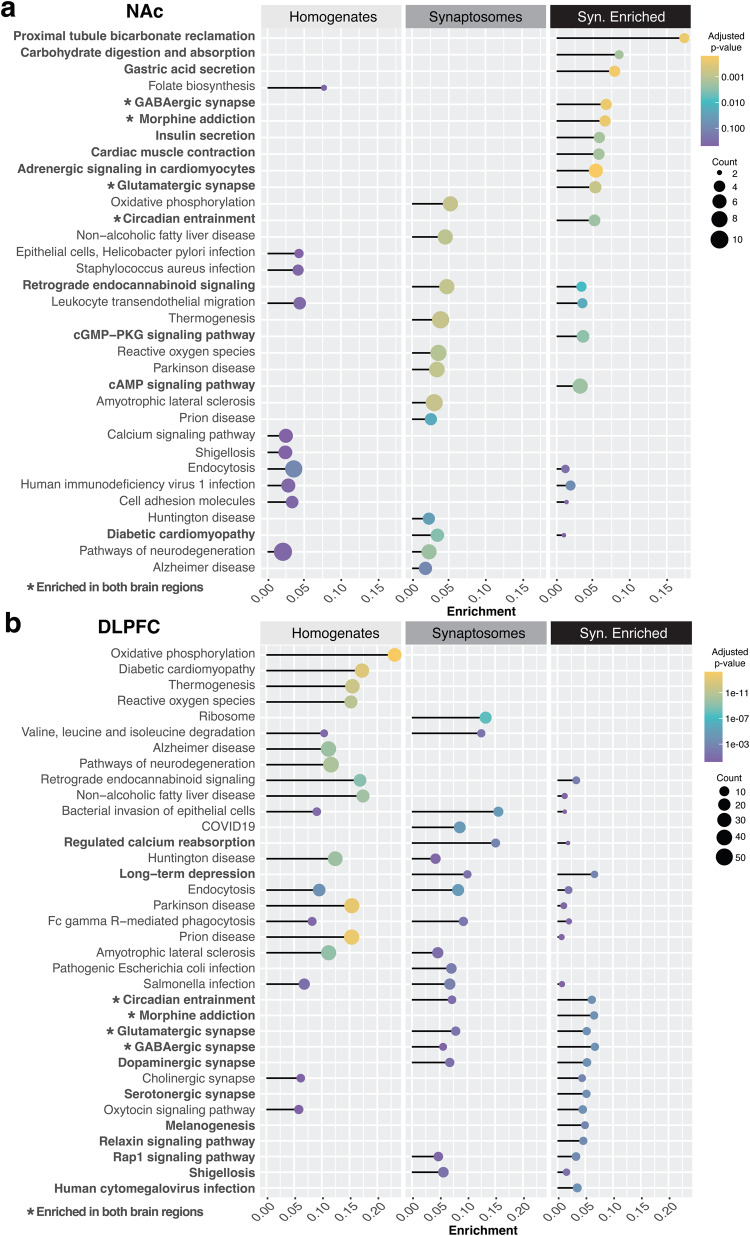
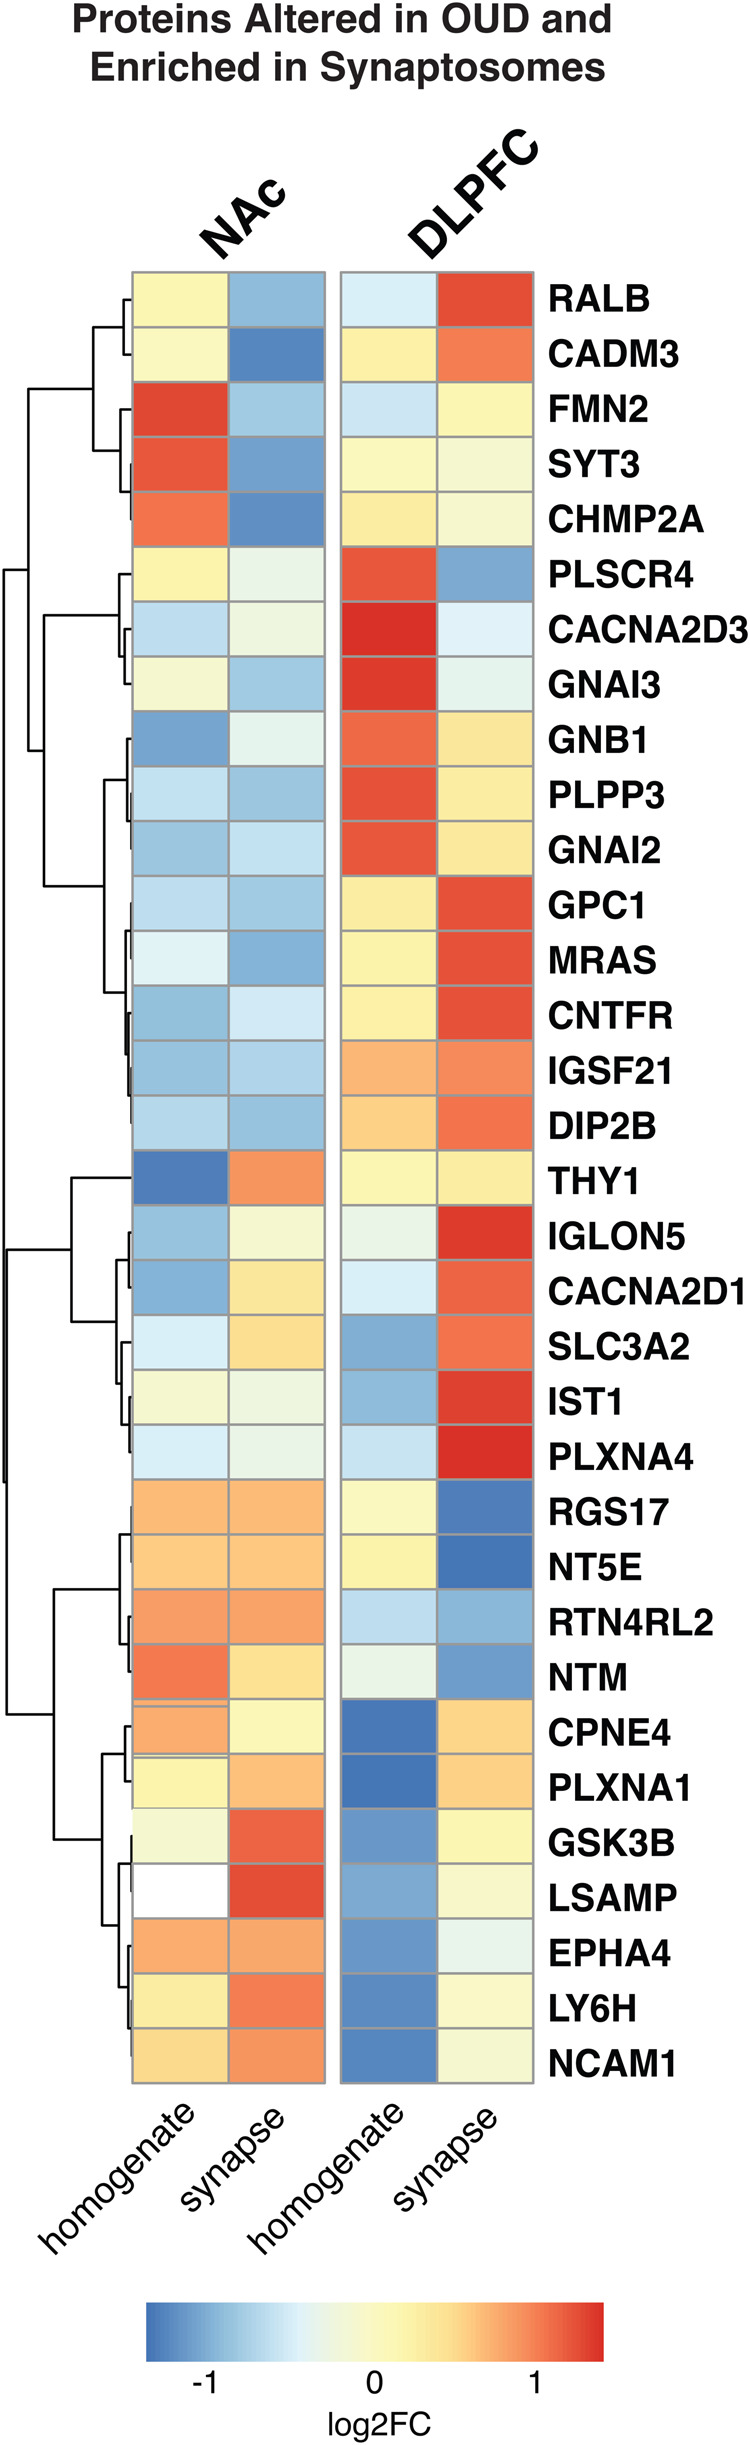
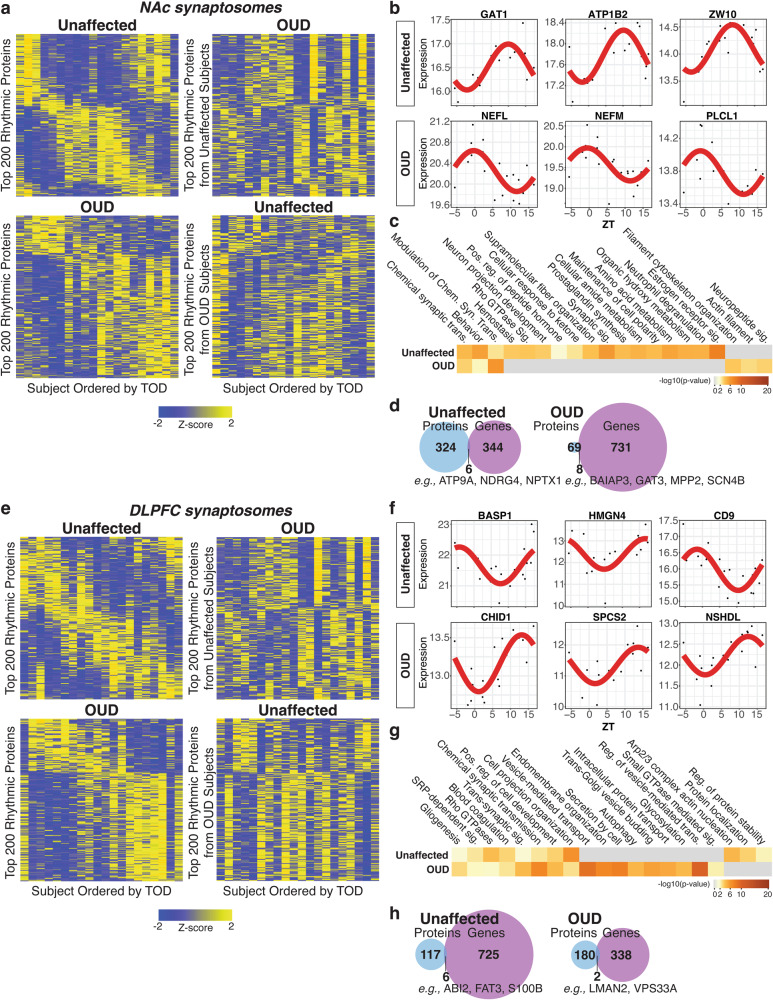
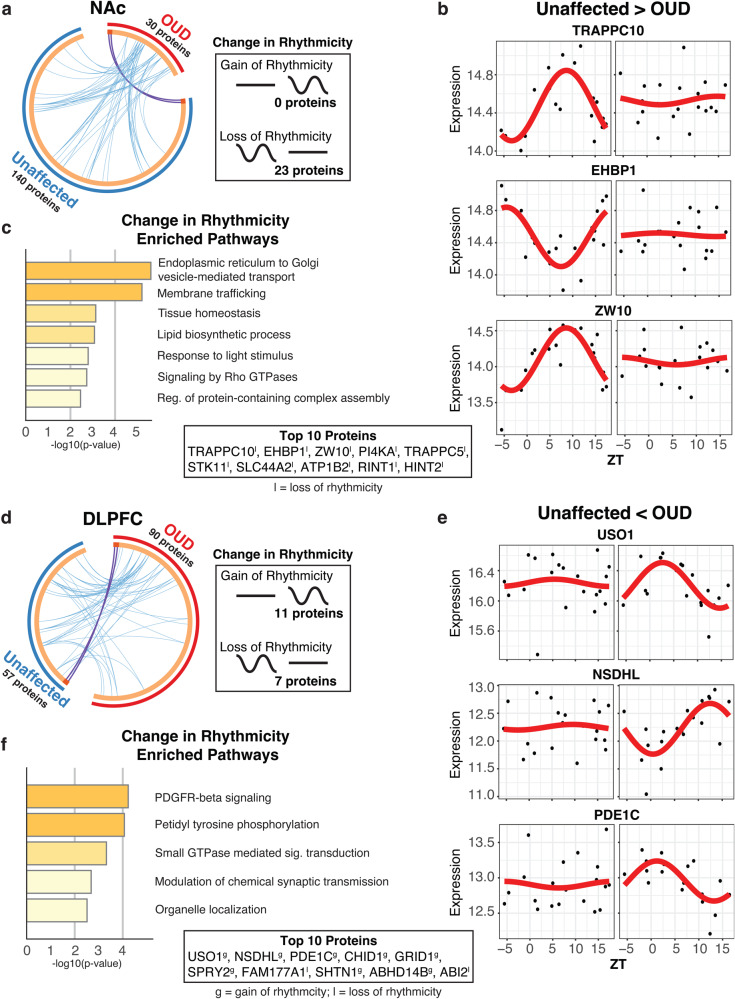
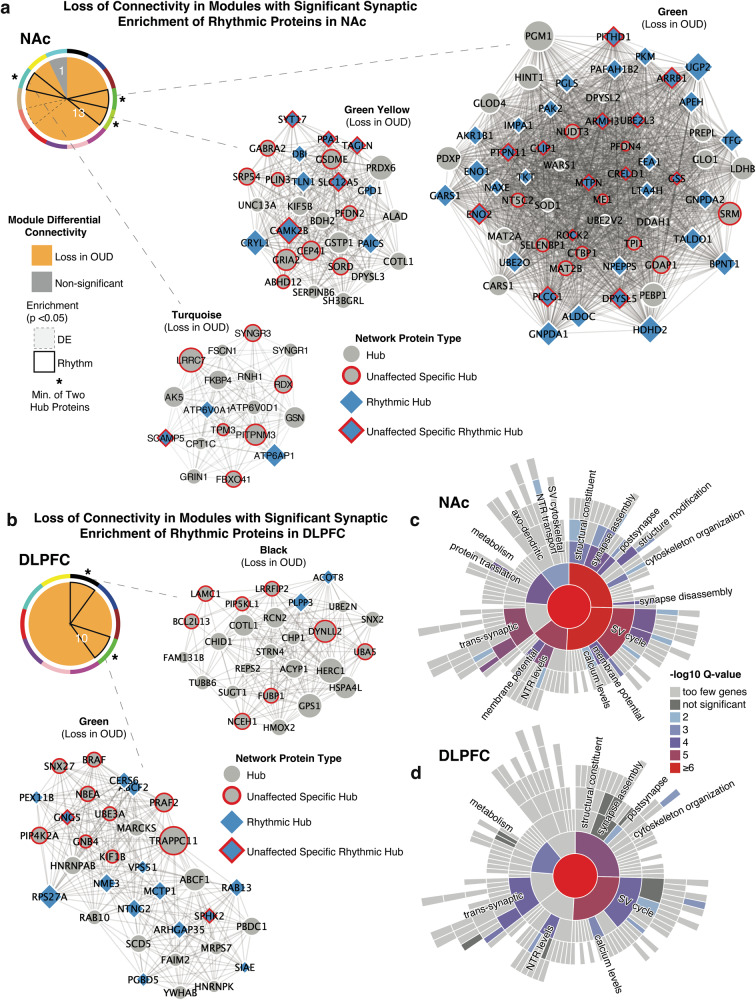
Opioid craving and relapse vulnerability is associated with severe and persistent sleep and circadian rhythm disruptions. Understanding the neurobiological underpinnings of circadian rhythms and opioid use disorder (OUD) may prove valuable for developing new treatments for opioid addiction. Previous work indicated molecular rhythm disruptions in the human brain associated with OUD, highlighting synaptic alterations in the dorsolateral prefrontal cortex (DLPFC) and nucleus accumbens (NAc)-key brain regions involved in cognition and reward, and heavily implicated in the pathophysiology of OUD. To provide further insights into the synaptic alterations in OUD, we used mass-spectrometry based proteomics to deeply profile protein expression alterations in bulk tissue and synaptosome preparations from DLPFC and NAc of unaffected and OUD subjects. We identified 55 differentially expressed (DE) proteins in DLPFC homogenates, and 44 DE proteins in NAc homogenates, between unaffected and OUD subjects. In synaptosomes, we identified 161 and 56 DE proteins in DLPFC and NAc, respectively, of OUD subjects. By comparing homogenate and synaptosome protein expression, we identified proteins enriched specifically in synapses that were significantly altered in both DLPFC and NAc of OUD subjects. Across brain regions, synaptic protein alterations in OUD subjects were primarily identified in glutamate, GABA, and circadian rhythm signaling. Using time-of-death (TOD) analyses, where the TOD of each subject is used as a time-point across a 24-h cycle, we were able to map circadian-related changes associated with OUD in synaptic proteomes associated with vesicle-mediated transport and membrane trafficking in the NAc and platelet-derived growth factor receptor beta signaling in DLPFC. Collectively, our findings lend further support for molecular rhythm disruptions in synaptic signaling in the human brain as a key factor in opioid addiction.


Conflict of interest statement

The authors report no competing interests.

Figures

Fig. 1
Fig. 1. Proteomic alterations in tissue homogenates from NAc and DLPFC in subjects with OUD.
a Log2FC plotted relative to −log10 p value by volcano plot for DE proteins in NAc homogenates. b Log2FC plotted relative to −log10 p value by volcano plot for DE proteins in DLPFC homogenates. c RRHO plot indicating weak overlap or concordance of protein alterations between DLPFC and NAc in OUD subjects. d Venn diagrams of downregulated and upregulated proteins between NAc and DLPFC homogenates. e Log2FC plotted relative to −log10 p value by volcano plot for DE proteins in NAc synaptosomes. f Log2FC plotted relative to −log10 p value by volcano plot for DE proteins in DLPFC synaptosomes. g RRHO plot indicating very weak discordance of protein expression alterations in OUD between DLPFC and NAc synaptosomes. h Venn diagrams of downregulated and upregulated proteins between NAc and DLPFC synaptosomes. Horizontal red lines indicate significance cutoffs of p < 0.05, with vertical red lines represent log2FC ± 0.26 (a, b, e, and f). Proteins that reached both unadjusted p < 0.05 and log2FC ± 0.26 were identified as DE proteins, upregulated labeled as red circles and downregulated labeled as blue circles.
Fig. 2
Fig. 2. Differential enrichment of synaptic proteins between NAc and DLPFC associated with OUD.
Lollipop plot showing pathways enriched from DE proteins in synaptosomes relative to homogenates in a NAc and b DLPFC. Adjusted p value by color. Size of the circle represents counts of proteins within pathways. The enrichment score is calculated as the count of proteins identified as DE in OUD subjects divided by the count of proteins in the background of the respective ontological pathway. Bolded text with stars represents pathways enriched in both brain regions. Bolded only text represents pathways enriched in synaptosomes of the region analyzed. Also see Supplementary Table S11 for Enrichment in NAc Synaptosomes; Supplementary Table S12 for Enrichment in DLPFC Synaptosomes. NAc nucleus accumbens, DLPFC dorsolateral prefrontal cortex.
Fig. 3
Fig. 3. Alterations in protein synaptic enrichments in DLPFC and NAc associated with OUD.
Heatmap highlighting top differentially expressed proteins in homogenates and synaptosomes in NAc and DLPFC of OUD subjects compared to unaffected controls. Warmer colors indicate increasing log2FC and highly enriched proteins in OUD. In contrast, cooler colors indicate decreasing log2FC and negative enrichment of proteins in OUD synaptosomes. Proteins are filtered for FDR < 0.10.
Fig. 4
Fig. 4. Diurnal rhythms of protein expression in DLPFC and NAc synaptosomes associated with OUD.
a Top left: Heatmap highlighting top 200 rhythmic proteins from NAc synaptosomes of unaffected subjects. Top right: Rhythmic proteins in unaffected subjects were plotted in OUD subjects to show disruption of protein rhythmicity. Bottom left: Heatmap highlighting top 200 rhythmic proteins from NAc synaptosomes of OUD subjects. Bottom right: rhythmic proteins in OUD subjects were plotted in unaffected subjects to show gain of protein rhythmicity in OUD. Heatmaps were generated by performing supervised clustering of expression of selected top 200 rhythmic proteins. Subjects were ordered by TOD to visualize expression levels over a period of 24 h. Yellow color indicates increased Z-score and higher protein expression, while blue color indicates decreased Z-score and lower protein expression. b Scatterplots of top rhythmic proteins in NAc synaptosomes from unaffected and OUD subjects. Scatterplots were generated to represent expression rhythms for individual proteins. The x-axis represents TOD on the ZT scale and protein expression level is on y-axis, with each dot representing a subject. The red line is the fitted sinusoidal curve to reflect temporal rhythms. c Pathway enrichment analysis comparing rhythmic proteins in NAc synaptosomes from unaffected and OUD subjects. Warmer colors indicate increasing −log10 p value and highly rhythmic pathways in each group. d Venn diagrams showing low overlap of rhythmic proteins and genes in NAc synaptosomes from unaffected and OUD subjects. e Top left: Heatmap highlighting top 200 rhythmic proteins from DLPFC synaptosomes of unaffected subjects. Top right: Rhythmic proteins in unaffected subjects were plotted in OUD subjects to show disruption of protein rhythmicity. Bottom left: heatmap highlighting top 200 rhythmic proteins from DLPFC synaptosomes of OUD subjects. Bottom right: rhythmic proteins in OUD subjects were plotted in unaffected subjects to show gain of protein rhythmicity in OUD. f Scatterplots of top rhythmic proteins in DLPFC synaptosomes from unaffected and OUD subjects. g Pathway enrichment analysis comparing top 200 rhythmic proteins found in DLPFC synaptosomes from unaffected and OUD subjects. h Venn diagrams showing low overlap of rhythmic proteins and genes in DLPFC synaptosomes from unaffected and OUD subjects. Also see Supplementary Fig. S1 for protein expression rhythm heatmaps in unaffected homogenates; Supplementary Fig. S2 for protein expression heatmaps in OUD homogenates; Supplementary Table S13 for NAc Homogenates Rhythms in Unaffected subjects; Supplementary Table S14 for NAc Homogenates Rhythms in OUD subjects; Supplementary Table S15 for DLPFC Homogenates Rhythms in Unaffected subjects; Supplementary Table S16 for DLPFC Homogenates Rhythms in OUD subjects; Supplementary Table S17 for NAc Synaptosomes Rhythms in Unaffected subjects; Supplementary Table S18 for NAc Synaptosomes Rhythms in OUD subjects; Supplementary Table S19 for DLPFC Synaptosomes Rhythms in Unaffected subjects; Supplementary Table S20 for DLPFC Synaptosomes Rhythms in OUD subjects; TOD time of death; NAc nucleus accumbens; DLPFC dorsolateral prefrontal cortex.
Fig. 5
Fig. 5. Altered rhythmicity of the synaptic proteome in DLPFC and NAc associated with OUD.
Comparison of rhythmic proteins between unaffected and OUD subjects in synaptosomes from NAc and DLPFC. a Circoplot highlights few rhythmic proteins that were identical (purple lines) and shared ontology (light blue lines) between unaffected and OUD subjects in NAc synaptosomes. Change in rhythmicity analysis in NAc Synaptosomes revealed that 0 proteins gained rhythmicity, while 23 lost rhythmicity in OUD subjects. b Scatterplots of top proteins that lost rhythmicity in NAc synaptosomes between unaffected and OUD subjects. Scatterplots were generated to represent expression rhythms for individual proteins. The x-axis represents TOD on the ZT scale and protein expression level is on y-axis, with each dot representing a subject. The red line is the fitted sinusoidal curve to reflect temporal rhythms. c Pathway enrichment on proteins that changed rhythmicity between unaffected and OUD subjects in NAc synaptosomes. d Circoplot highlights few rhythmic proteins that were identical (purple lines) and shared ontology (light blue lines) between unaffected and OUD subjects in DLPFC synaptosomes. Change in rhythmicity analysis in DLPFC Synaptosomes revealed that 11 proteins gained rhythmicity, while 7 lost rhythmicity. e Scatterplots of top proteins that lost rhythmicity in DLPFC synaptosomes between unaffected and OUD subjects. f Pathway enrichment on proteins that changed rhythmicity between unaffected and OUD subjects in DLPFC synaptosomes. Also see Fig. S3 for gain/loss rhythmicity proteins in NAc and DLPFC homogenates; Supplementary Fig. S4 for DLPFC synaptosomes enriched gain and lost rhythm pathways; Table S21 for gain/loss rhythmicity protein list in NAc homogenates; Supplementary Table S22 for gain/loss rhythmicity protein list in DLPFC homogenates; Supplementary Table S23 for gain/loss rhythmicity protein list in NAc synaptosomes; Supplementary Table S24 for gain/loss rhythmicity protein list in DLPFC synaptosomes. TOD time of death, NAc nucleus accumbens, DLPFC dorsolateral prefrontal cortex.
Fig. 6
Fig. 6. Altered protein networks in NAc and DLPFC synaptosomes associated with OUD.
Weight Gene Correlation Network Analysis (WGCNA) was used to generate protein co-expression modules from each brain region separately. The identified modules that survived module preservation analysis were arbitrarily assigned colors. Pie charts generated from module differential connectivity (MDC) analysis summarize modules that gained or lost connectivity between unaffected and OUD subjects in NAc (a) and DLPFC (b). a Comparing module connectivity between unaffected and OUD subjects in NAc synaptosomes identified 13 modules that lost connectivity in OUD, while 1 remained unchanged. Modules turquoise, green–yellow and green were composed of several rhythmic protein hubs and showed loss in connectivity in OUD. b Comparing module connectivity between unaffected and OUD subjects in DLPFC synaptosomes revealed all identified modules lost connectivity in OUD. Modules Green and Black were composed of several rhythmic hubs and showed loss of connectivity in OUD. c Synaptic enrichment analysis of protein networks that lost connectivity in NAc synaptosomes. d Synaptic enrichment analysis of protein networks that lost connectivity in DLPFC synaptosomes. Also see Figure S5 for WGCNA dendrograms on NAc and DLPFC homogenates; Fig. S6 for WGCNA dendrograms on NAc and DLPFC synaptosomes; Figure S7 for modules from NAc homogenates; Fig. S8 for modules from NAc synaptosomes; Figure S9 for modules from DLPFC homogenates; Fig. S10 for modules from DLPFC synaptosomes; Fig. S11 for additional MDC summaries; Supplementary Table S25 for WGCNA module assignments and proteins; Supplementary Table S26 for MDC analysis. DE differentially expressed, NAc nucleus accumbens, DLPFC dorsolateral prefrontal cortex.

Update of

Similar articles

Cited by

References

    1. National Institute on Drug Abuse. Drug overdose death rates. National Institute on Drug Abuse; 2023. https://nida.nih.gov/research-topics/trends-statistics/overdose-death-rates. Accessed 23 March 2023.
    1. Xue X, Zong W, Glausier JR, Kim S-M, Shelton MA, Phan BN, et al. Molecular rhythm alterations in prefrontal cortex and nucleus accumbens associated with opioid use disorder. Transl Psychiatry. 2022;12:1–13. - PMC - PubMed
    1. Seney ML, Kim S-M, Glausier JR, Hildebrand MA, Xue X, Zong W, et al. Transcriptional alterations in dorsolateral prefrontal cortex and nucleus accumbens implicate neuroinflammation and synaptic remodeling in opioid use disorder. Biol Psychiatry. 2021;90:550–62. - PMC - PubMed
    1. Nagamatsu ST, Rompala G, Hurd YL, Núñez-Rios DL, Montalvo-Ortiz JL, Traumatic Stress Brain Research Group. CpH methylome analysis in human cortical neurons identifies novel gene pathways and drug targets for opioid use disorder. Front Psychiatry. 2022;13:1078894. - PMC - PubMed
    1. Jacobs MM, Ökvist A, Horvath M, Keller E, Bannon MJ, Morgello S, et al. Dopamine receptor D1 and postsynaptic density gene variants associate with opiate abuse and striatal expression levels. Mol Psychiatry. 2013;18:1205–10. - PMC - PubMed