. 2023 Sep;621(7980):868-876.
doi: 10.1038/s41586-023-06498-3. Epub 2023 Sep 6.

Spatial predictors of immunotherapy response in triple-negative breast cancer

Affiliations

Spatial predictors of immunotherapy response in triple-negative breast cancer

Xiao Qian Wang et al. Nature. 2023 Sep.

Abstract

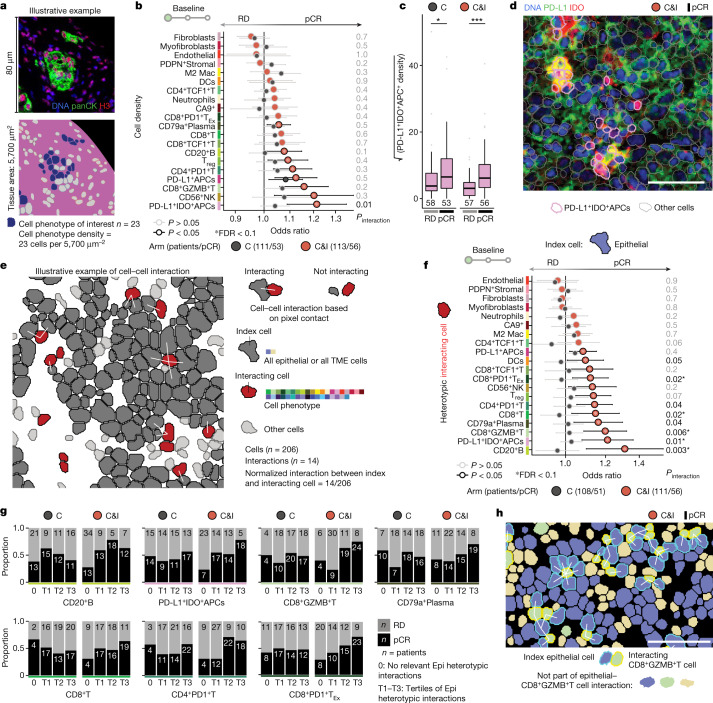
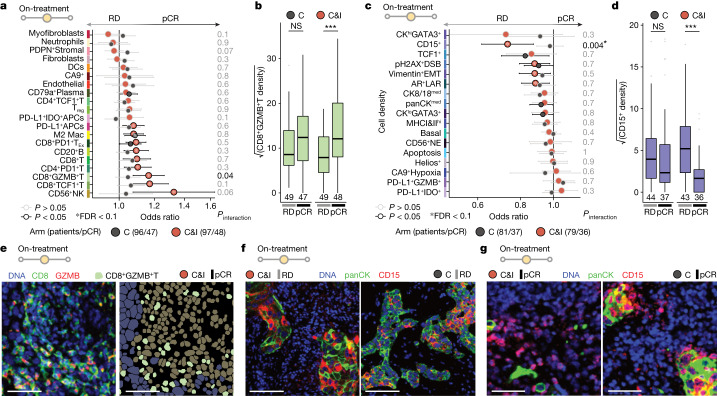
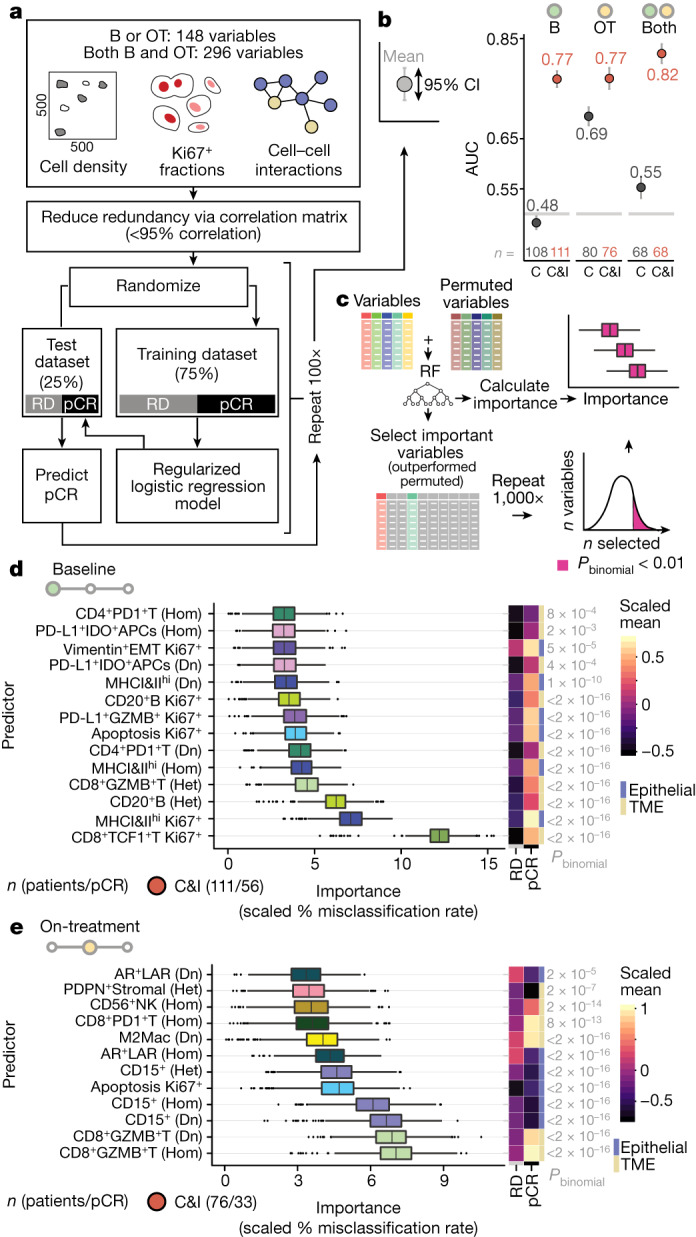
Immune checkpoint blockade (ICB) benefits some patients with triple-negative breast cancer, but what distinguishes responders from non-responders is unclear1. Because ICB targets cell-cell interactions2, we investigated the impact of multicellular spatial organization on response, and explored how ICB remodels the tumour microenvironment. We show that cell phenotype, activation state and spatial location are intimately linked, influence ICB effect and differ in sensitive versus resistant tumours early on-treatment. We used imaging mass cytometry3 to profile the in situ expression of 43 proteins in tumours from patients in a randomized trial of neoadjuvant ICB, sampled at three timepoints (baseline, n = 243; early on-treatment, n = 207; post-treatment, n = 210). Multivariate modelling showed that the fractions of proliferating CD8+TCF1+T cells and MHCII+ cancer cells were dominant predictors of response, followed by cancer-immune interactions with B cells and granzyme B+ T cells. On-treatment, responsive tumours contained abundant granzyme B+ T cells, whereas resistant tumours were characterized by CD15+ cancer cells. Response was best predicted by combining tissue features before and on-treatment, pointing to a role for early biopsies in guiding adaptive therapy. Our findings show that multicellular spatial organization is a major determinant of ICB effect and suggest that its systematic enumeration in situ could help realize precision immuno-oncology.


Conflict of interest statement

C.-S.H. has received research grants for his institution from Aston Sci, AstraZeneca, Daiichi Sankyo, EirGenix, Eli Lilly, Gilead, MSD, Novartis, OBI Pharma, Pfizer, Roche and Seagen; honoraria for speakers’ bureaus from AstraZeneca, Daiichi Sankyo, Eli Lilly, Novartis, Pfizer and Roche; support for attending meetings from Pfizer; and has served on Advisory Boards for AstraZeneca, Daiichi Sankyo, Eli Lilly, Novartis, Pfizer and Roche. D.E. has received consulting fees from AstraZeneca, Daichii Sankyo, Gilead, Novartis, MSD, Roche, Pfizer and Seagen; honoraria for lectures from Amgen, AstraZeneca, Daichii Sankyo, Novartis, MSD, Roche and Pfizer; and support for attending meetings from Pfizer and Roche. B.B. has received honoraria for speaker bureaus from MDS, Roche, Novartis, Pfizer, Palex, AstraZeneca and Lilly; and has served on advisory boards for MSD, Roche and Daichii Sankyo. C.Z. has received grants from Eisai, Pharmamar, Eli Lilly, Celgene, MSD, GSK, Amgen and Daichii Sankyo, and for him and his institution from Roche, Novartis, AstraZeneca, Pfizer, Tesaro, Pierre Fabre, Ist. Gentili, Teva and Seagen; support for attending meetings from Roche, Novartis, Pfizer, Pharmamar, Tesaro, Pierre Fabre, Ist. Gentili and Celgene; has served on advisory boards for Roche, Eisai, Novartis, AstraZeneca, Pfizer, Pharmamar, Amgen, Tesaro, QuintilesIMS, Eli Lilly, Celgene, MSD, GSK and Daichii Sankyo; and has received other financial and non-financial interests from Roche, Novartis, AstraZeneca, Pfizer, Amgen, Tesaro, QuintilesIMS, MSD, GSK and Daichii Sankyo. M.T. has received research grants from Endomag and Exact Sciences; trial honoraria from AstraZeneca, Biom’Up, Celgene, Clearcut, Novartis, pfm medical, Roche and RTI Surgical; honoraria for speakers’ bureaus from Amgen, Art Tempi, AstraZeneca, Clovis, Connect Medica, Eisai, Exact Sciences, Gedeon Richter, Gilead Science, GSK, Hexal, I-Med-Institute, Jörg Eickeler, Laborarztpraxis Walther et al., Lilly, MCI, Medscape, MSD, Medtronic, Novartis, Onkowissen, Pfizer, pfm medical, Roche, Seagen, Streamed Up, Sysmex, Vifor and Viatris; support for attending meetings from Amgen, Art Tempi, AstraZeneca, Clearcut, Clovis, Connect Medica, Daiichi Sankyo, Eisai, Exact Sciences, Hexal, I-Med-Institute, Lilly, MCI, Medtronic, MSD, Norgine, Novartis, Pfizer, pfm Medical, Roche, RTI Surgical and Seagen; has served on advisory boards for Agendia, Amgen, AstraZeneca, Aurikamed, Becton/Dickinson, Biom’Up, ClearCut, Clovis, Daiichi Sankyo, Eisai, Exact Sciences, Gilead Science, Grünenthal, GSK, Lilly, MSD, Norgine, Neodynamics, Novartis, Onkowissen, Organon, Pfizer, pfm Medical, Pierre Fabre, Roche, RTI Surgical, Seagen, Sirius Medical and Sysmex; has received trial funding from Amgen, ClearCut, Clovis, pfm medical, Roche and Servier; and has received Congress support from Amgen, AstraZeneca, Celgene, Daiichi Sankyo, Hexal, Neodynamics, Novartis, Pfizer and Roche. A.A. has received consulting fees from Daichii Sankyo, Roche, Pfizer and Bayer Spain; payment for expert testimony from Pfizer; has served on Advisory Boards for Lilly and Gilead; and has received other services from GSK. E.M.C. has received consulting fees from Roche, Lilly, AstraZeneca, Daiichi Sankyo, Novartis, Pfizer and MSD; honoraria for speakers’ bureaus from Lilly and Roche; and support for attending meetings from Pfizer and Roche. R.G. has received consulting fees from Celgene, Novartis, Roche, BMS, Takeda, Abbvie, AstraZeneca, Jaanssen, MSD, Merk, Gilead, Daiichi Sankyo and Sanofi; support for attending meetings from Roche, Amgen, Janssen, AstraZeneca, Novartis, MSD, Celgene, Gilead, BMS, Abbvie and Daiichi Sankyo; has served on Advisory Boards for Celgene, Novartis, Roche, BMS, Takeda, Abbvie, AstraZeneca, Jaanssen, MSD, Merk, Gilead, Daiichi Sankyo and Sanofi; and has received other financial or non-financial interests from Celgene, Roche, Merk, Takeda, AstraZeneca, Novartis, Amgen, BMS, MSD, Sandoz, Abbvie, Gilead, Daiichi Sankyo, Eli Lilly and Novo Nordisk. B.G. was supported by the National Research, Development, and Innovation Office (PharmaLab, RRF-2.3.1-21-2022-00015). M.C. has received a research grant from Roche. C.M.K. has received grants from the Mater Foundation and HRB Grant/Hospital Co investment and from the Irish Cancer Society; honoraria for educational events from Exact Sciences, AstraZeneca and Daiichi Sankyo; support for attending meetings from Roche; and has participated in Steering Committees for the PALLAS trial, the PenelopeB trial and Destiny Breast 11. L.D.M. has received honoraria for speakers’ bureaus from Roche, Novartis, Eli Lilly, MDS, Pfizer, Ipsen and from Novartis for her institution; support for attending meetings from Roche, Pfizer, Celgene, AstraZeneca and Daiichi Sankyo; and has served on advisory boards for Roche, Eli Lilly, Novartis, MSD, Pfizer, Genomic Health, Pierre Fabre, Daiichi Sankyo, Seagen, Gilead, Exact Sciences, GSK and Agendia. R.S.S. is an employee, stockholder and patent holder of Oncocyte, Inc. G.V. has received grants from Roche/Genentech and AstraZeneca for his institution; consulting fees from Roche/Genentech, AstraZeneca, MDS Oncology and Daiichi Sankyo; honoraria for lectures from Roche/Genentech, AstraZeneca and Daiichi Sankyo; support for attending meetings from Roche/Genentech; and has served on Advisory Boards for Roche/Genentech, AstraZeneca, Pfizer, MDS Oncology and Novartis. L.G. has received consulting fees from Novartis and Odonate Therapeutics; honoraria for lectures from Roche; and support for attending meetings from Pfizer; is co-inventor of ‘European Patent Application Nos. 12195182.6 and 12196177.5 titled PDL-1 expression in anti-HER2 therapy’—Roche—Issued (no compensation provided); has served on advisory boards for AstraZeneca, Celgene, Genentech, Merk Sharp & Dohme, Roche, Pfizer and Sanofi Aventis; and is Chair of the Breast Cancer Research Committee of Fondazione Michelangelo. G.B. has received consulting fees from Roche, AstraZeneca, Novartis, MSD, Sanofi, Daiichi Sankyo and Exact Science; honoraria for speakers’ bureaus from Roche, Pfizer, AstraZeneca, Lilly, Novartis, Neopharm Israel, MSD, Chugai, Daiichi Sankyo, EISAI and Exact Science; support for attending meetings from Roche, Pfizer and AstraZeneca; and has served on advisory boards for Roche, Pfizer, Daiichi Sankyo, Lilly, MSD, Novartis, AstraZeneca, Genomic Health, EISAI, Gilead and Seagen. The other authors declare no competing interests.

Figures

Fig. 1
Fig. 1. IMC workflow of the NeoTRIP immunotherapy trial.
a, Flowchart of longitudinal tumour sampling from the NeoTRIP randomized clinical trial for high parameter imaging. b, Antibody panel targeting 43 protein markers expressed by epithelial (blue), TME (gold) or both (grey) cells. c, Schematic illustration of region of interest (ROI) selection for targeted multiplexed imaging by IMC, guided by an adjacent haematoxylin and eosin (H&E) section. d, Representative images of protein expression (cropped to fit; white scale bar, 50 µm). e, Semi-supervised workflow for distinguishing epithelial and TME cells from multiplexed images. f, Heatmap of median expression values for 17 epithelial cell phenotypes clustered using the proteins depicted on the x axis; right-sided grey bar chart depicts the number of cells per phenotype. g, As for f, for 20 TME cell phenotypes. C, chemotherapy; C&I, chemotherapy and immunotherapy; DC, dendritic cell; Mac, macrophage; NE, neuroendocrine; pCR, pathological complete response; TN, triple negative.
Fig. 2
Fig. 2. Spatial predictors of immunotherapy response at baseline.
a, Schematic illustrating cell phenotype density calculation. b, Odds ratios for associations between cell density and pCR for TME cell phenotypes. c, Boxplot of PD-L1+IDO+APC density across treatment arms and response. Boxes show 25th, 50th and 75th centiles; whiskers indicate 75th centile plus 1.5 × inter-quartile range and 25th centile less 1.5 × inter-quartile range; points beyond whiskers are outliers. *P < 0.05, ***P < 0.001, based on two-sided Wilcoxon tests. d, Representative image of a tumour from a responder treated with immunotherapy with high PD-L1+IDO+APC density. e, Schematic illustrating principles of homotypic and heterotypic cell–cell interaction metrics. f, Odds ratios for associations between heterotypic epithelial-to-TME cell phenotypes and pCR. For b and f, Odds ratios are derived from univariate logistic regression: circles represent point estimates and whiskers indicate 95% confidence intervals. Depicted P values are derived from a term for interaction between the predictor and treatment in logistic regression models (including separate terms for the predictor and treatment). Asterisks indicate associations with an FDR < 0.1 by the Benjamini–Hochberg method. g, Bar charts of the proportion of tumours achieving pCR in patients with no selected epithelial–TME interactions per arm (0) or increasing tertiles of epithelial–TME interactions per arm (T1–T3). Numbers on bars are absolute numbers of patients in each category. h, Representative image of a tumour from a responder treated with immunotherapy with high baseline epithelial–CD8+GZMB+T cell interactions. All images were median filtered; white scale bar, 50 µm. RD, residual disease; Epi, epithelial.
Fig. 3
Fig. 3. Proliferative fractions of cancer and TME cell phenotypes predict response to immunotherapy.
a, Schematic illustrating calculation of cell phenotype-specific proliferative fractions (proportion of Ki67+ cells). b,c, Odds ratios for associations between proliferative fraction and pCR for epithelial (b) and TME (c) cell phenotypes. Odds ratios are derived from univariate logistic regression: circles represent point estimates and whiskers indicate 95% confidence intervals. Depicted P values are derived from a term for interaction between the predictor and treatment in logistic regression models (including separate terms for the predictor and treatment) and have not been adjusted for multiple tests. Asterisks indicate associations with an FDR < 0.1 by the Benjamini–Hochberg method. d, Bar charts of the proportion of tumours achieving pCR in patients with no Ki67+ cells of the selected phenotype per arm (0) or increasing proportion of Ki67+ cells per arm, as quantified by tertiles (T1–T3). Absolute numbers of patients in each category are depicted inside bar charts. e, Relationship between proliferative fraction of CD8+TCF1+T cells and MHCI&IIhi cells. ρ is Spearman rank correlation coefficient. Shaded area represents 95% confidence interval of the loess regression line. f,g, Representative images of tumours from immunotherapy-treated responders with high proliferative fractions of MHCI&IIhi cells (f) and CD8+TCF1+T cells (g). White scale bar, 100 µm.
Fig. 4
Fig. 4. Cell phenotypes predictive of immunotherapy response early on-treatment.
a, Odds ratios for associations between cell density and pCR for epithelial cell phenotypes. b, Boxplot of CD8+GZMB+T epithelial cell density across treatment arms and response. c, Odds ratios for associations between cell density and pCR for epithelial cell phenotypes. For a and c, odds ratios are derived from univariate logistic regression: circles represent point estimates and whiskers indicate 95% confidence intervals. Depicted P values are derived from a term for interaction between the predictor and treatment in logistic regression models (including separate terms for the predictor and treatment) and have not been adjusted for multiple tests. Asterisks indicate associations with an FDR < 0.1 by the Benjamini–Hochberg method. d, Boxplot of CD15+ cell density across treatment arms and response. For b and d, boxes show 25th, 50th and 75th centiles; whiskers indicate 75th centile plus 1.5 × inter-quartile range and 25th centile less 1.5 × inter-quartile range; points beyond whiskers are outliers. ***P < 0.001, based on two-sided Wilcoxon tests. e, Representative image of a tumour from an immunotherapy-treated responder with high on-treatment CD8+GZMB+T cell density. On the left are the imaging data and on the right are the cell phenotype masks. White scale bar, 50 µm. f, Representative images of CD15 mosaic expression pattern on-treatment in two tumours. White scale bar, 100 µm. g, Representative image of CD15+ tumours with CD15+ TME cells nearby. White scale bar, 50 µm. All images are median filtered. NS, not significant.
Fig. 5
Fig. 5. Dynamics of immunotherapy response.
a, Boxplots depicting distributions of epithelial, immune and stromal cell proportions per patient separated by timepoint, treatment arm and response. (Spurious epithelial cell detections in the post-treatment arm among responders were removed.) b, Boxplots depicting proportion distributions per patient of key leukocytes: B (CD20+B, CD79a+Plasma), Macs & DCs (M2 Mac, DCs, PD-L1+ APCs, PD-L1+IDO+ APCs) and T (all T cell phenotypes, including Treg cells) cells, relative to all TME cells, separated by timepoint, treatment arm and response. For a and b, n denotes number of patients. c, Trends of TME cell composition enriched or depleted across timepoint, treatment arm and response, depicted as a line plot with scaled mean (Z-scores) derived from proportions of each cell phenotype within their compartment. Circle sizes are inversely proportional to scaled variance. Numbers of patients per timepoint are indicated in the legend. Cell phenotypes with the most distinct differences between dynamics of treatment arm and response are shaded and represented as boxplots in d, e and f. df, Boxplots depicting CD8+PD1+TEx cells (d), CD8+GZMB+T cells (e) and CD15+ cells (f) as a proportion of all TME cells (d,e) or all epithelial cells (f) per patient across treatment arms, response and timepoints. Cell phenotypes with the largest differences in dynamics between treatment arms are depicted. *P < 0.05, **P < 0.01, based on two-sided Wilcoxon tests. For all boxplots (a, b, d, e and f), boxes show 25th, 50th and 75th centiles; whiskers indicate 75th centile plus 1.5 × inter-quartile range and 25th centile less 1.5 × inter-quartile range; points beyond whiskers are outliers. B, baseline; OT, on-treatment; PT, post-treatment.
Fig. 6
Fig. 6. Multivariate modelling to predict ICB response.
a, Analytical workflow for predictive modelling using multitiered multiplexed imaging data. Three models were trained using (1) baseline variables alone, (2) on-treatment variables alone or (3) combining baseline and on-treatment variables. b, AUC statistics for prediction probabilities derived from multivariate regularized logistic regression models to predict pCR. AUCs were computed using random held-out test data repeated 100 times, as described in a; circles are mean AUCs, error bars are 95% confidence intervals. c, Diagram illustrating variable importance analysis including all predictors described in a. d,e, Boxplots depicting baseline (d) and on-treatment (e) predictors of immunotherapy response (associated with a Pbinomial < 0.01) ranked by importance in the model. On the right are heatmaps showing scaled mean values by response. Pbinomial indicates P values derived from variable importance analysis illustrated in c. For all boxplots, boxes show 25th, 50th and 75th centiles; whiskers indicate 75th centile plus 1.5 × inter-quartile range and 25th centile less 1.5 × inter-quartile range; points beyond whiskers are outliers. Dn, density; Het, heterotypic interactions; Hom, homotypic interactions; RF, random forest.
Extended Data Fig. 1
Extended Data Fig. 1. Localisation of proteins expressed by both epithelial and TME cells.
White scale bars represent 50 µm.
Extended Data Fig. 2
Extended Data Fig. 2. Analysis of intratumoural heterogeneity across ROIs.
a, Bar plots showing the distribution of ROIs per tumour per timepoint separately for epithelial (blue) or TME cells (beige). b, Boxplots comparing the Pearson correlations of cell phenotype proportions for epithelial cell phenotypes (blue) and TME cell phenotypes (beige) between ROIs for each tumour. Values above whiskers are the percentage of correlations greater than 0.5. c, Boxplots showing variance of the proportion of each cell phenotype across ROIs for each tumour by timepoint. For all boxplots, boxes show 25th, 50th, and 75th centiles; whiskers indicate 75th centile plus 1.5x inter-quartile range and 25th centile less 1.5x inter-quartile range; points beyond whiskers are outliers.
Extended Data Fig. 3
Extended Data Fig. 3. Detection of carboplatin in situ during therapy.
a, Mean intracellular carboplatin detected per tumour by timepoint and arm. b, Amount of carboplatin detected in macrophages, epithelial cells and other TME cells by timepoint and arm. For both (a) and (b), Boxes show 25th, 50th, and 75th centiles; whiskers indicate 75th centile plus 1.5x inter-quartile range and 25th centile less 1.5x inter-quartile range; points beyond whiskers are outliers. ***P < 0.001 based on two-sided Wilcoxon tests. c, Representative images of carboplatin distribution in breast tumour tissue at baseline, on-treatment and post-treatment reveal co-localisation with CD68 indicating uptake by macrophages. White scale bars represent 100 µm. Baseline, B; On-treatment, OT; Post-treatment, PT; Chemotherapy, C; Chemotherapy and immunotherapy, C&I.
Extended Data Fig. 4
Extended Data Fig. 4. Flow chart of detailed cell phenotyping methodology.
a, Workflow showing different approaches to characterising epithelial and TME cells as well as phenotyping the cells by compartment. Depicted cell segmentations are for illustration only. b, Curation of cells as epithelial or TME depends on visual inspection of cell morphology and staining patterns of specified markers. Cancer cells characterised by low cytokeratin and increased mesenchymal protein expression were frequent, and only reliably identified by multi-tiered and semi-supervised methods. White scale bars represent 50 µm.
Extended Data Fig. 5
Extended Data Fig. 5. Illustrative examples of multiplexed images and corresponding cell phenotype assignments.
a, Example of epithelial cell phenotypes and their protein expression b, Example of TME cell phenotypes and their protein expression. White scale bar is 50 µm.
Extended Data Fig. 6
Extended Data Fig. 6. Associations between PD-L1 status and high dimensional imaging data.
a, Representative images comparing the staining pattern of two different antibody clones targeting PD-L1. White scale bar represents 50µm. b, Boxplots of PD-L1 expression by IMC in tumour and TME cells separated by clinical PD-L1 status. Boxes show 25th, 50th, and 75th centiles; whiskers indicate 75th centile plus 1.5x inter-quartile range and 25th centile less 1.5x inter-quartile range; points beyond whiskers are outliers. c, Associations between cell phenotypes and clinical PD-L1 status depicted as log2 odds ratios derived from binomial generalised linear models where PD-L1 status was a predictor of cell phenotype proportion. Bar charts depict cell phenotype proportion relative to epithelial or TME cells, split by PD-L1 status. Immunohistochemistry, IHC.
Extended Data Fig. 7
Extended Data Fig. 7. Associations between cell phenotypes, tumour infiltrating lymphocytes, and TNBC subtypes.
a, Levels of lymphocyte density by IMC compared to intratumoural tumour infiltrating lymphocytes (iTILs) or stromal TILs (sTILs) per tumour per timepoint. ρ is Spearman rank correlation coefficient. An outlier tumour with high lymphocyte density post-treatment in IMC but low iTILs/sTILs is highlighted with a representative IMC image (lymphocyte lineage markers combined in red). b, Odds ratios from generalised linear models depicting associations between proportions of TME and epithelial cell phenotypes and levels of sTILs at baseline. Circles are point estimates and horizontal bars are 95% confidence intervals; circle size is inversely proportional to the standard error. c, Associations between cell phenotypes and TNBC subtypes depicted as log2 odds ratios where tumour subtype predicts cell phenotype proportion relative to all other subtypes. Number of tumours per subtype depicted in bottom right of each panel. Bar charts depict proportion of cell phenotype relative to all epithelial or TME cells within a given tumour subtype. Circles are point estimates and horizontal bars, where visible, are 95% confidence intervals; circle size is inversely proportional to the standard error. Basal-like 1, BL1; Basal-like 2, BL2; Luminal androgen receptor, LAR; Mesenchymal, M; Mesenchymal stem-like, MSL; Tumour infiltrating lymphocytes, TILs.
Extended Data Fig. 8
Extended Data Fig. 8. Baseline predictors of immunotherapy response.
a, Odds ratios for associations between cell density and pCR for epithelial cell phenotypes. b, Proportion of TME cells interacting with epithelial cells and the proportion of heterotypic to homotypic interactions per tumour. c, Representative images of tumours with few, some, and many heterotypic interactions relative to total cell count. For all images, white scale bar represents 50 µm and a median filter was applied. df, Odds ratios for associations between cell-cell interactions and pCR among epithelial-to-epithelial cells (d), TME-to-epithelial cells (e) and TME-to-TME cells (f). For a, df, Odds ratios are derived from univariate logistic regression: circles represent point estimates and whiskers indicate 95% confidence intervals. Depicted P-values are derived from a term for interaction between the predictor and treatment in logistic regression models (including separate terms for the predictor and treatment) and have not been adjusted for multiple tests. Asterisks indicate P-values associated with false discovery rate <0.1 using the Benjamini-Hochberg method. False discovery rate, FDR; Pathological complete response, pCR; Residual disease, RD; Chemotherapy, C; Chemotherapy and immunotherapy, C&I.
Extended Data Fig. 9
Extended Data Fig. 9. Correlations between cell phenotype density and cell-cell interactions.
a, Heatmap depicting associations between density of a cell phenotype and interactions between that cell phenotype and all epithelial or TME cells as indicated by the index cell headings. Numbers are spearman rank correlation coefficients. bi, Scatterplots illustrating selected relationships between density and cell-cell interactions indicated in (a). ρ denotes Spearman rank correlation coefficient. Zeros have been retained for each plot by adding a value 0.3x the smallest value per plot before taking the log value. Baseline, B; On-treatment, OT.
Extended Data Fig. 10
Extended Data Fig. 10. Differential T cell activation by cancer cell contact and proliferation status.
a, Representative image of interactions between CD8 T cells and epithelial cells. b, Boxplots of mean expression levels (per tumour) of activation markers for T cells in contact or not in contact with cancer cells at baseline. c, Proportion of T cells positive for Ki67 in contact or not in contact with tumour cells at baseline. d, Boxplots of mean expression levels of activation markers in Ki67+ versus Ki67 CD8+TCF1+T cells at baseline. e, Proportion of Ki67+ and Ki67 CD8+TCF1+T cells in contact with cancer cells at baseline. f, An example of a baseline tumour with Ki67+ and Ki67CD8+TCF1+T cells in contact with cancer cells. g, Proportion of Ki67+ and Ki67 CD8+TCF1+T cells in contact with MHCII+ cancer cells at baseline. h, Boxplots of mean expression levels of activation markers in Ki67+ versus Ki67 CD8+TCF1+T cells early on-treatment for each treatment arm. i, Proportion of Ki67+ epithelial, immune and stromal cells by timepoint, treatment arm and response. Note all values are the mean per tumour (i.e., each tumour contributes one data point per measurement). For all boxplots, boxes show 25th, 50th, and 75th centiles; whiskers indicate 75th centile plus 1.5x inter-quartile range and 25th centile less 1.5x inter-quartile range; points beyond whiskers are outliers. Asterisks denote P-values < 0.05 (*), < 0.01 (**) or < 0.001 (***) based on two-sided Wilcoxon tests. A median-filter was applied to a and, for all images, white scale bar is 50 µm. Baseline, B; On-treatment, OT; Chemotherapy, C; Chemotherapy and immunotherapy, C&I.
Extended Data Fig. 11
Extended Data Fig. 11. Early on-treatment predictors of immunotherapy response.
a - d, Odds ratios for associations between cell-cell interactions and pCR among epithelial-to-TME (a), epithelial-to-epithelial (b), TME-to-epithelial (c) and TME-to-TME (d) cells. e, f, Odds ratios for associations between proliferative fraction and pCR for Epithelial (e) and TME (f) cell phenotypes. Odds ratios are derived from univariate logistic regression: circles represent point estimates and whiskers indicate 95% confidence intervals. Depicted P-values are derived from a term for interaction between the predictor and treatment in logistic regression models (including separate terms for the predictor and treatment) and have not been adjusted for multiple tests. Asterisks indicate P-values associated with false discovery rate <0.1 using the Benjamini-Hochberg method. False discovery rate, FDR; Tumour microenvironment, TME; Pathological complete response, pCR; Residual disease, RD; Chemotherapy, C; Chemotherapy and immunotherapy, C&I.
Extended Data Fig. 12
Extended Data Fig. 12. Representative images of a tumour across timepoints.
a, Representative image of a tumour from a patient who responded to immunotherapy treatment illustrating changes in GZMB+ cells. b, Representative image of a tumour from a patient with residual disease following neoadjuvant immunotherapy treatment illustrating changes in CD15+ cells over time. White scale bar is 100 µm. Pathological complete response, pCR; Residual disease, RD; Chemotherapy, C; Chemotherapy and immunotherapy, C&I.

References

    1. Schmid P, et al. Event-free survival with pembrolizumab in early triple-negative breast cancer. N. Engl. J. Med. 2022;386:556–567. - PubMed
    1. Pardoll DM. The blockade of immune checkpoints in cancer immunotherapy. Nat. Rev. Cancer. 2012;12:252–264. - PMC - PubMed
    1. Giesen C, et al. Highly multiplexed imaging of tumor tissues with subcellular resolution by mass cytometry. Nat. Methods. 2014;11:417–422. - PubMed
    1. Adams S, et al. Current landscape of immunotherapy in breast cancer: a review. JAMA Oncol. 2019;5:1205–1214. - PMC - PubMed
    1. Bianchini G, Balko JM, Mayer IA, Sanders ME, Gianni L. Triple-negative breast cancer: challenges and opportunities of a heterogeneous disease. Nat. Rev. Clin. Oncol. 2016;13:674–690. - PMC - PubMed

Publication types

MeSH terms