. 2023 Sep;621(7978):423-430.
doi: 10.1038/s41586-023-06500-y. Epub 2023 Sep 6.

Pervasive downstream RNA hairpins dynamically dictate start-codon selection

Affiliations

Pervasive downstream RNA hairpins dynamically dictate start-codon selection

Yezi Xiang et al. Nature. 2023 Sep.

Abstract

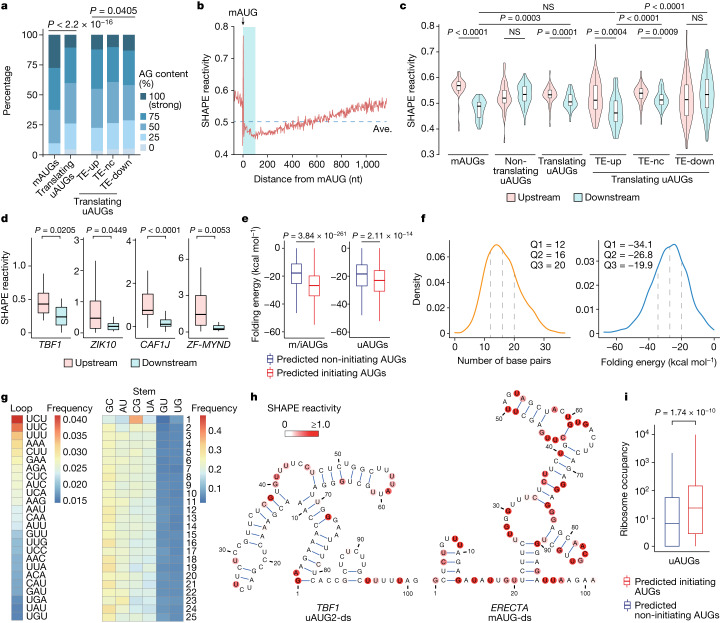
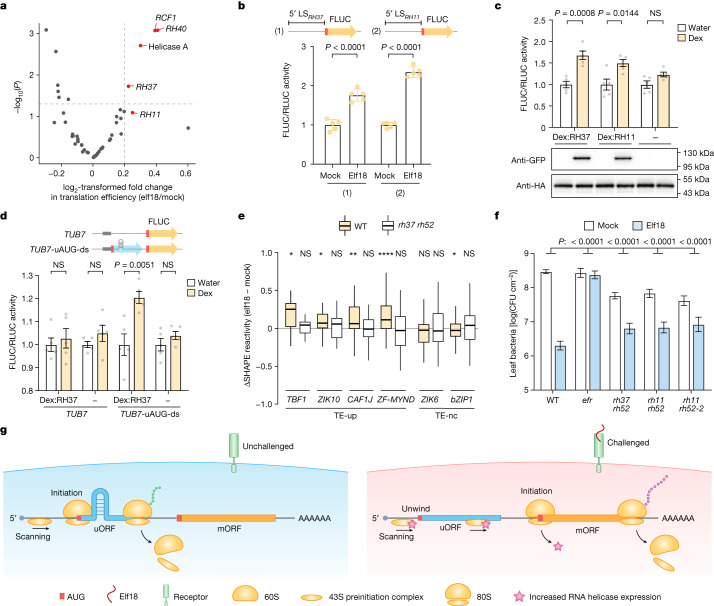
Translational reprogramming allows organisms to adapt to changing conditions. Upstream start codons (uAUGs), which are prevalently present in mRNAs, have crucial roles in regulating translation by providing alternative translation start sites1-4. However, what determines this selective initiation of translation between conditions remains unclear. Here, by integrating transcriptome-wide translational and structural analyses during pattern-triggered immunity in Arabidopsis, we found that transcripts with immune-induced translation are enriched with upstream open reading frames (uORFs). Without infection, these uORFs are selectively translated owing to hairpins immediately downstream of uAUGs, presumably by slowing and engaging the scanning preinitiation complex. Modelling using deep learning provides unbiased support for these recognizable double-stranded RNA structures downstream of uAUGs (which we term uAUG-ds) being responsible for the selective translation of uAUGs, and allows the prediction and rational design of translating uAUG-ds. We found that uAUG-ds-mediated regulation can be generalized to human cells. Moreover, uAUG-ds-mediated start-codon selection is dynamically regulated. After immune challenge in plants, induced RNA helicases that are homologous to Ded1p in yeast and DDX3X in humans resolve these structures, allowing ribosomes to bypass uAUGs to translate downstream defence proteins. This study shows that mRNA structures dynamically regulate start-codon selection. The prevalence of this RNA structural feature and the conservation of RNA helicases across kingdoms suggest that mRNA structural remodelling is a general feature of translational reprogramming.


Conflict of interest statement

X.D. is a founder of Upstream Biotechnology and a member of its scientific advisory board, as well as a member of the scientific advisory board of Inari Agriculture and Aferna Bio. K.M.W. is an advisor to and holds equity in Ribometrix. X.D. and Y.X. are listed as co-inventors on a patent application (no. 63/432,775) related to this work. The remaining other authors declare no competing interests.

Figures

Fig. 1
Fig. 1. Translational dynamics of uORF-containing transcripts.
a, Volcano plot of global changes in translational efficiency during PTI. TE-up, transcripts with upregulated translational efficiency (P < 0.05, log2-transformed fold change > 0.16); TE-nc, transcripts with no changes in translational efficiency (P > 0.05); TE-down, transcripts with downregulated translational efficiency (P < 0.05, log2-transformed fold change < –0.16). b, Number and percentage of transcripts with translating uAUGs in the TE-up, TE-nc and TE-down groups. Two-tailed Fisher’s exact test was used to determine the P value of the difference between groups. c, Box plot of ribosome occupancy (normalized read counts) on translating uAUGs in the TE-up (n = 347), TE-nc (n = 2,312), and TE-down (n = 192) transcripts in the mock condition. P values were calculated by two-tailed Mann–Whitney tests. Boxes, interquartile range (IQR); centre lines, median; whiskers, values within 1.5 × IQR of the top and bottom quartiles. d, Histograms with density curves of log2-transformed fold change of ribosome occupancy on translating uAUGs in the TE-up, TE-nc and TE-down transcripts in response to elf18 treatment. μ, average log2 transformed fold change value. P values were calculated by two-tailed paired t-tests. e, Ribosome occupancy on the uORF(s) in four TE-up transcripts, namely TBF1, ZIK10, CAF1J and ZF-MYND (AT1G70160.1), in response to mock and elf18 treatment. P values were calculated by two-tailed Student’s t-tests. NS, not significant. Values are mean ± s.d. (n = 3 independent biological replicates).
Fig. 2
Fig. 2. Global SHAPE-MaP and deep learning analyses reveal hairpin structures downstream of mAUGs and uAUGs that have a role in dictating translation initiation.
a, Kozak sequence contexts (AG content) flanking mAUGs and translating uAUGs. P values were calculated by two-sided chi-squared test. b, Average SHAPE reactivities across all expressed transcripts aligned by start codons of CDS in the mock condition. Red line, average reactivity for every three nucleotides. Ave., average SHAPE reactivity across all of the nucleotides. Blue shading, 100 nt downstream of mAUG. c, Violin plots showing comparisons of SHAPE reactivities 50 nt upstream and 50 nt downstream of mAUGs or uAUGs in the mock condition. d, Box plots showing differences in SHAPE reactivities 50 nt upstream and 50 nt downstream of translating uAUGs in four TE-up transcripts. Only the major inhibitory uAUGs (that is, uAUG2s in TBF1 and ZIK10) are shown. e, Box plots showing the differences in folding energy of RNA secondary structures downstream of predicted initiating and non-initiating AUGs. m/iAUGs, mAUGs and internal AUGs. f, Distributions of base-pair numbers and folding energies of RNA secondary structures downstream of predicted initiating AUGs. g, Heat maps showing the frequencies of nucleotides in the loop and the stem of hairpin structures downstream of predicted initiating AUGs that are significantly distinct from the background (P = 1.4 × 10–109 for the loop and P = 1.5 × 10–79 for the stem, calculated by chi-squared test). Numbers 1 to 25 show the position of each base pair, which were counted starting from the end of the loop. h, Models of RNA secondary structures downstream of uAUG2 (uAUG2-ds) of TBF1 and mAUG (mAUG-ds) of ERECTA. i, Box plot showing the difference in ribosome occupancy on predicted initiating and non-initiating uAUGs. For ce,i, boxes, IQR; centre lines, median; whiskers, values within 1.5 × IQR of the top and bottom quartiles. P values were calculated by two-tailed Mann–Whitney tests.
Fig. 3
Fig. 3. RNA secondary structures downstream of uAUGs dynamically regulate translation.
a, elf18-induced average changes in SHAPE reactivity downstream of translating uAUGs in TE-up (red) or TE-nc and TE-down (grey) transcripts. b, elf18-induced changes in SHAPE reactivity across nucleotides downstream of major inhibitory translating uAUGs of four TE-up transcripts. Red bars, nucleotides with median-to-high SHAPE reactivities. Blue asterisks, elf18-induced increases in SHAPE reactivities. c, In vivo SHAPE-MaP probing of TBF1 and TBF1-uAUG2-Δds (left) and dual-luciferase assay on their activities in controlling FLUC translation (right). 5′ LSTBF1, TBF1 5′ leader sequence. TBF1-F and TBF1-uAUG2-Δds-F, FLUC fused in-frame with the first 66 nt of uORF2 (uORF2*). d, Addition of uAUG and/or dsRNA structures affects synthetic reporter translation. All reporters have the same 5′ leader sequence length but different folding energies in the downstream region (100 nt) of uAUG: TUB7, TUB7-m1 and TUB7-m2 (−9.8 kcal mol−1); TUB7-m5 (−14.3 kcal mol−1); TUB7-m4 (−16.9 kcal mol−1); TUB7-m3, TUB7-m6 and TUB7-m7 (−23.6 kcal mol−1). e, Addition of an artificial hairpin downstream of uAUG2 further inhibits mammalian ATF4 translation. mORF*-FLUC, FLUC fused in-frame with the first 84 nt of ATF4 mORF. ATF4-m2, uAUG2 mutated to AAG. ATF4-uAUG2-ds, the downstream region of uAUG2 substituted with a hairpin without changing its length. ATF4-m2-ds, ATF4-uAUG2-ds with uAUG2 mutated to AAG. ATF4-F and ATF4-uAUG2-ds-F, FLUC fused in-frame with uORF2. f,g, Translation of mammalian BRCA1 is regulated by uAUGs (f) and their downstream dsRNA structures detected by in vivo SHAPE-MaP (g). Boxes, IQR; centre lines, median; whiskers, values within 1.5 × IQR of the top and bottom quartiles. P values for cf, two-tailed Student’s t-test; for g, two-tailed Mann–Whitney tests. Values are mean ± s.d. (n = 5 biological replicates in c,d; n = 4 biological replicates in e,f). For d,f, different letters indicate statistically significant differences (P < 0.05).
Fig. 4
Fig. 4. RNA helicases unwind RNA secondary structures downstream of uAUGs to alleviate repression of mAUG translation.
a, Volcano plot of changes in translational efficiency for 54 known Arabidopsis RNA helicases after treatment with elf18. b, Translational responses of the 5′ leader sequences of RH37 (5′ LSRH37) and RH11 (5′ LSRH11) to elf18. P values were calculated by two-tailed Student’s t-test. Values are mean ± s.d. (n = 5 independent biological replicates). c, Effect of dex-induced expression of YFP-tagged RNA helicases (RH37 and RH11) (bottom) on translation of the 35S:TBF1 5LS-FLUC/35S:RLUC dual-luciferase reporter (top). HA-tagged RLUC levels were detected as internal controls. d, Effect of dex-induced expression of YFP-tagged RH37 on translation of the TUB7 synthetic reporters (top). For c,d, P values were calculated by two-tailed Student’s t-test. Values are mean ± s.e.m. (n = 5 independent biological replicates). e, Box plots of in planta changes in SHAPE reactivity in the endogenous uAUG-ds regions of four TE-up and two TE-nc transcripts in wild-type (WT) and the helicase-mutant (rh37rh52) plants. For transcripts with two translating uAUGs (TBF1, ZIK10, ZIK6 and bZIP1), changes in the downstream region of the major inhibitory uAUGs (that is, uAUG2-ds) are shown. Data were analysed by two-tailed Wilcoxon signed-rank tests. *P < 0.05, **P < 0.01, ****P < 0.0001. Boxes, IQR; centre lines, median; whiskers, values within 1.5 × IQR of the top and bottom quartiles. f, Elf18-induced protection against Psm ES4326 in wild-type plants and helicase mutants (n = 12 plants). Bacterial growth (in colony-forming units; CFU) was measured two days after inoculation and is shown as mean ± s.e.m. P values were calculated by two-way ANOVA. The experiment was repeated twice with similar results. g, A model of RNA-secondary-structure-mediated translational regulation of uORF-containing transcripts during PTI.
Extended Data Fig. 1
Extended Data Fig. 1. Quality and reproducibility of RNA-seq and Ribo-seq data.
a, BioAnalyzer profiles showed high quality of the Ribo-seq libraries. Apart from the internal standard sized at 35 bp and 10,380 bp, a single peak at around 150 bp was present in all the libraries for mock and elf18 treatment in all three biological replicates (Reps 1–3). b, Length distribution of reads from the Ribo-seq libraries. c,d, Correlations among the three replicates of RNA-seq (c) and Ribo-seq (d) data from mock- and elf18-treated samples. Data are shown as correlations of log2(RPKM+1) for all the genes. r, Pearson correlation coefficient. e, Metagene analysis on the average read counts surrounding start and stop codons for reads at different lengths (top). P-site offsets were detected at the length of 13–15 nt surrounding start codons and at the length of 17–19 nt surrounding stop codons (bottom). 5′ LS, 5′ leader sequence. f, Power spectral density of normalized Ribo-seq read counts in the 300-nt window downstream of the start codon shows 3-nt periodicity. The units are (normalized read counts)^2 per nucleotide period. g, Total RNA-seq and Ribo-seq read distribution in 5′ LS, CDS, and 3′ UTR of the 13,051 expressed transcripts (n = 13,051). Boxes, IQR. Centre lines, median. Whiskers, values within 1.5 × IQR of the top and bottom quartiles. Grey circles represent RPKM values for individual outlier transcripts. h, Metagene analysis across normalized transcript for Ribo-seq reads in all the mock and elf18-induced samples with the read length ranging from 24 nt to 35 nt. 5′ LS, 5′ leader sequence. 3′ UTR, 3′ untranslated region.
Extended Data Fig. 2
Extended Data Fig. 2. Global analysis of translational dynamics and dual-luciferase reporter study of uAUG-containing transcripts.
a, Flow chart of RNA-seq and Ribo-seq data analysis. b, Strategy for the identification of translating mAUGs and uAUGs (see Methods for details). c, Dual-luciferase reporter study (top) of translational responses of the 5′ leader sequences of 20 TE-up transcripts to elf18 induction (bottom). FLUC reporter without the inserted test sequence was used as a negative control (Neg Ctl). P values were calculated by two-tailed Student’s t-test. Values are mean ± s.e.m. (n = 5 biological replicates). d,e, GO enrichment analysis on the 1,157 TE-up transcripts (d) and 1,150 TE-down transcripts (e). The size of the dot represents the number of genes that fall into each group. The colour of the dot represents adjusted P value.
Extended Data Fig. 3
Extended Data Fig. 3. Quality and reproducibility of global and targeted in planta SHAPE-MaP.
a, Flow chart of in planta SHAPE-MaP protocol. b, Comparison of in vivo Arabidopsis 18S rRNA secondary structure detected using the dimethyl sulfate (DMS)-based method performed in a previous study and the SHAPE-MaP protocol adapted in this study. Nucleotides 32–518 of the 18S rRNA phylogenetic secondary structure are shown in the model and are colour-coded with SHAPE reactivities generated in this study. c, Pearson correlation among the four SHAPE-MaP biological replicates (by transcript) under each treatment condition. Nucleotides in 2,488 transcripts with read depth > 4,000 in all the replicates under all the conditions were used for the analysis. Boxes, IQR. Centre lines, median. Whiskers, values within 1.5 × IQR of the top and bottom quartiles. Circles represent Pearson correlation values for outliers. d, Cumulative fraction on the mutation rates of four nucleotides under each treatment condition.
Extended Data Fig. 4
Extended Data Fig. 4. In vivo and in vitro SHAPE-MaP analyses depict RNA structural features.
a, Cumulative fraction of the SHAPE reactivities of nucleotides in the 5′ leader sequence, CDS and 3′ UTR in mock- and elf18-treated samples. b, Average in vivo and in vitro SHAPE reactivities in the 5′ leader sequence (5′ LS), CDS and 3′ UTR across all expressed transcripts in the mock-treated samples aligned by the start and stop codons of CDS. Brown horizontal line marks the average in vivo SHAPE reactivity across all the nucleotides in mock-treated samples. c, Violin plots show the comparisons of in vivo and in vitro SHAPE reactivities of the 50 nt downstream regions of translating uAUGs in the TE-up transcripts and mAUGs in all expressed transcripts, as well as the 50 nt upstream region of stop codons in all expressed transcripts under the mock condition. d, Box plot shows the difference in in vitro SHAPE reactivities in the 50 nt upstream and the 50 nt downstream of uAUG2 in the TBF1 transcript. e, Box plot shows the comparison of in vivo and in vitro SHAPE reactivities of the uAUG2-ds region in the TBF1 transcript. For ce, boxes represent IQR, centre lines mark median and whiskers indicate values within 1.5 × IQR of the top and bottom quartiles. P values were analysed by two-tailed Mann–Whitney tests.
Extended Data Fig. 5
Extended Data Fig. 5. Deep learning analysis of the SHAPE-MaP data suggests that downstream double-stranded structures have a role in dictating AUG selection for translation initiation.
a, Flow chart of TISnet. The RNA secondary structures downstream of AUGs were predicted by RNAfold constrained by SHAPE reactivities. TISnet predicted the probability of initiating AUG by integrating the RNA primary sequence and secondary structure information. AUGs with probability ≥ 0.9 are defined as predicted initiating AUGs, and AUGs with probability < 0.9 are defined as predicted non-initiating AUGs. b, The input data and architecture of TISnet. The input data of TISnet include RNA sequences encoded by one-hot encoding, and secondary structures encoded to 0 or 1. The TISnet architecture includes squeeze-excitation block, residual block (2D) and residual block (1D) adapted by the PrismNet model. c, The receiver operating characteristic (ROC) curves of the TISnet models trained with both the sequence and the structure information (red line), or solely with the sequence information (blue line), or solely with the structure information (green line). The AUC (area under the ROC curve) scores of three models are shown. d, Box plot of the overall probabilities predicted by the TISnet model using downstream regions of mAUGs and internal AUGs (left) or translating and non-translating uAUGs (right). Boxes, IQR. Centre lines, median. Whiskers, values within 1.5 × IQR of the top and bottom quartiles. P values were analysed by two-tailed Mann–Whitney tests. Number of AUGs for the analysis: mAUGs, n = 2,857; internal AUGs, n = 7,143; translating uAUGs, n = 712; non-translating uAUGs, n = 314 (normalized read counts at these uAUGs = 0). e,f, Examples of RNA structural models of downstream regions of predicted initiating AUGs (e) and non-initiating AUGs (f).
Extended Data Fig. 6
Extended Data Fig. 6. Characterization of class 1 AUG-ds.
a, Pie plots show the percentage of different AUG-ds classes located in downstream regions of total predicted initiating AUGs (left), mAUGs in total predicted initiating AUGs (middle) and translating uAUGs in total predicted initiating AUGs (right). Each class of elements are defined by a group of hairpin elements with similar sequence patterns (see Methods for details). b, The secondary structure models of mAUG-ds in the LRR1 transcript and uAUG2-ds in the ZF-MYND transcript in class 1. c, The position weight matrix (PWM) of the sequence motif of two stems and loop of the class 1 AUG-ds. d, Distribution of the distance between uAUG and the first nucleotide of the downstream hairpin element. Blue dashed lines represent the bottom (Q1), middle (Q2) and top (Q3) quartiles.
Extended Data Fig. 7
Extended Data Fig. 7. uAUG-ds dynamically regulates translation in plants and mammalian cells.
a, Overview of in vivo SHAPE reactivities across the 5′ leader sequences of TBF1 (top) and TBF1-uAUG2-Δds (bottom) expressed in N. benthamiana. The mutated uAUG-ds region is highlighted in blue. b, DNA gel electrophoresis showing the 5′ RACE results of TBF1, TUB7 and their mutation variants (corresponding to Fig. 3c,d). c, Effects of different strengths of dsRNA structures on the translation of the synthetic reporter (no uAUG). The dsRNA structures were introduced without changing the length of 5′ leader sequences. Folding energies were calculated for the region (blue) 54–153 nt downstream of the 5′ end. 5′ LSTUB7, the 5′ leader sequence of TUB7. Data were analysed by two-tailed Student’s t-test. Different letters indicate statistically significant differences (P < 0.05). Values are mean ± s.d. (n = 5 independent biological replicates). d, In-vitro-transcribed RNAs used in transfecting HEK293FT cells (corresponding to Fig. 3e,f and Extended Data Fig. 7e,f). e, Translational regulatory activity of the Arabidopsis TBF1 5′ leader sequence (5′ LSTBF1) is maintained in HEK293FT cells. Mutagenesis of the 5′ leader sequence of TBF1 showed that, in HEK293FT cells, as in Arabidopsis, the double-stranded structure downstream of uAUG2 is required for inhibiting the reporter translation (top) by enhancing translation initiation from uAUG2 (bottom). TBF1-F and TBF1-uAUG2-Δds-F are FLUC fused in-frame with the first 66 nt of uORF2 (uORF2*). P values were calculated by two-tailed Student’s t-test. Values are mean ± s.d. (n = 4 independent biological replicates). f, Effects of uAUG and RNA double-stranded structures on the synthetic reporter translation in HEK293FT cells. Data were analysed by two-tailed Student’s t-test. Values are mean ± s.d. (n = 4 independent biological replicates). In c,e,f, each dot represents a biological replicate.
Extended Data Fig. 8
Extended Data Fig. 8. Structural similarities of Arabidopsis RNA helicases RH11, RH37 and RH52 to yeast Ded1p and mammalian DDX3X.
a, Protein sequence alignment of Arabidopsis RH11, RH37 and RH52 with their homologues in five other angiosperm species: Amborella trichopoda (Atrichopoda), Zea mays (Zmays), Oryza sativa (Osativa), Solanum lycopersicum (Slycopersicum), Medicago truncatula (Mtruncatula), together with yeast Ded1p, human DDX3X and Arabidopsis eIF4A homologues. Numbers following each name are PACIDs. ESPript 3.0 (ref. ) was used for visualization of protein sequence alignment. Human DDX3X structure elements were used as references. b, Domain conservation of Arabidopsis RH11, RH37, RH52, eIF4A1, eIF4A2 and eIF4A3 with DDX3X/Ded1p regarding the nine sequence motifs (in the boxes and illustrated from N terminus to C terminus). Conserved domains are indicated with red asterisks. c,d, Pairwise alignment of yeast Ded1p with Arabidopsis RH11, RH37 and RH52 (c) and with Arabidopsis eIF4A1 and eIF4A2 (d) shows that RH11, RH37 and RH52, but not eIF4A1 and eIF4A2, are structurally similar to Ded1p. Protein structures were predicted by AlphaFold, and superimposed and visualized by PyMol v.1.3.
Extended Data Fig. 9
Extended Data Fig. 9. Genotyping and phenotypes of the helicase mutants.
ac, Schematics of CRISPR experiments and the Sanger sequencing results from rh37 rh52 (a), rh11 rh52 (b) and rh11 rh52-2 (c) double mutants. Short blue line, guide RNA; red dot at the end of the short blue line, PAM sequence. d, Representative morphology of WT, efr, rh37 rh52, rh11 rh52 and rh11 rh52-2 plants before the elf18-induced protection assay. Higher-order mutants rh37 rh11+/ rh52, rh37+/ rh11 rh52, and rh37+/ rh11 rh52-2 are included in the photo to show their growth defect. e, Western blotting shows that the helicase double mutant (rh37 rh52) specifically compromises the elf18-mediated increases in protein levels from translating uAUG-containing transcripts (ARF2 and CH1), but not from transcripts without translating uAUGs (RBOHD and ICS1). The relative band intensity of the immunoblot (represented by numbers below the blot) was normalized to mock for each background. The experiment was repeated twice with similar results.
Extended Data Fig. 10
Extended Data Fig. 10. Proposed mechanism for translational regulation of non-uAUG-containing transcripts.
a, Percentage comparison of translating uAUG-containing, non-uAUG-containing and all transcripts with increased or decreased translation efficiency after elf18 induction (TE-up or TE-down). TE-up: transcripts with upregulated TE (P value < 0.05, log2-transformed fold change > 0.16); TE-down: transcripts with downregulated TE (P value < 0.05, log2-transformed fold change < –0.16). b, GO enrichment analysis on the non-uAUG-containing transcripts. c, A proposed model of mAUG-ds-mediated translational regulation of non-uAUG-containing transcripts during PTI.

Comment in

References

    1. Zhang H, Wang Y, Lu J. Function and evolution of upstream ORFs in eukaryotes. Trends Biochem. Sci. 2019;44:782–794. doi: 10.1016/j.tibs.2019.03.002. - DOI - PubMed
    1. Barbosa C, Peixeiro I, Romao L. Gene expression regulation by upstream open reading frames and human disease. PLoS Genet. 2013;9:e1003529. doi: 10.1371/journal.pgen.1003529. - DOI - PMC - PubMed
    1. Zhang H, et al. Determinants of genome-wide distribution and evolution of uORFs in eukaryotes. Nat. Commun. 2021;12:1076. doi: 10.1038/s41467-021-21394-y. - DOI - PMC - PubMed
    1. Medenbach J, Seiler M, Hentze MW. Translational control via protein-regulated upstream open reading frames. Cell. 2011;145:902–913. doi: 10.1016/j.cell.2011.05.005. - DOI - PubMed
    1. Aitken CE, Lorsch JR. A mechanistic overview of translation initiation in eukaryotes. Nat. Struct. Mol. Biol. 2012;19:568–576. doi: 10.1038/nsmb.2303. - DOI - PubMed

Publication types

MeSH terms

LinkOut - more resources