. 2023 Sep;621(7978):415-422.
doi: 10.1038/s41586-023-06506-6. Epub 2023 Sep 6.

Polθ is phosphorylated by PLK1 to repair double-strand breaks in mitosis

Affiliations

Polθ is phosphorylated by PLK1 to repair double-strand breaks in mitosis

Camille Gelot et al. Nature. 2023 Sep.

Erratum in

Abstract

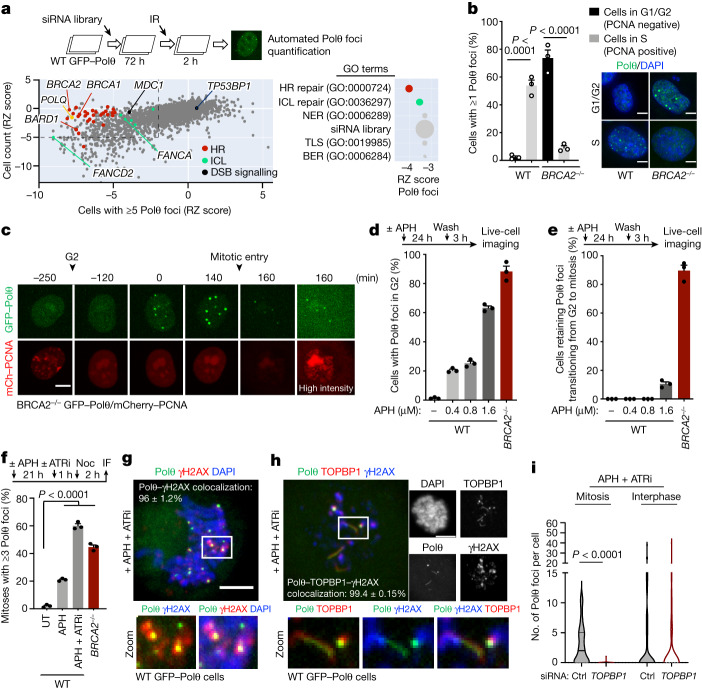
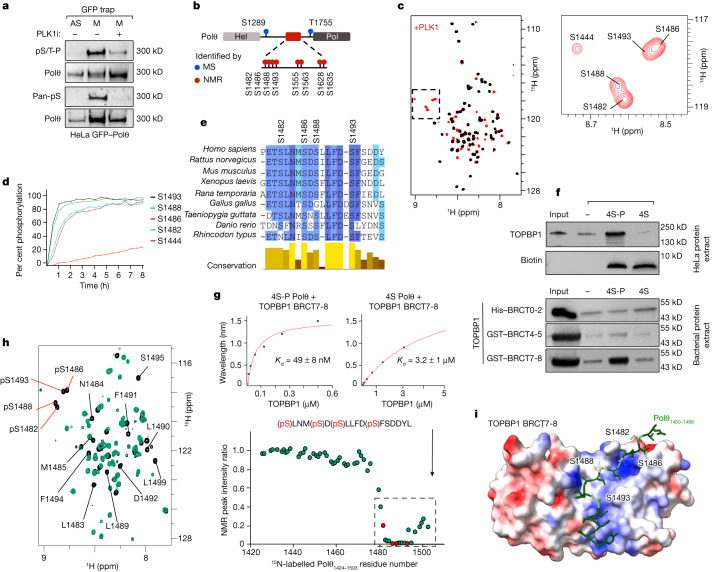
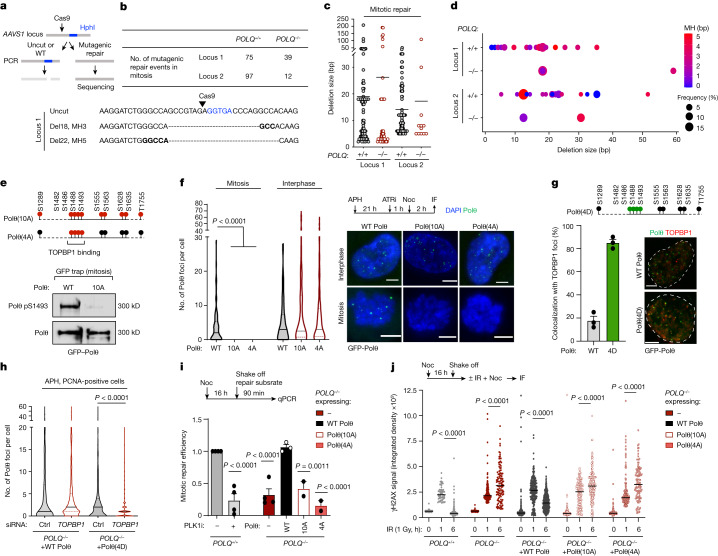
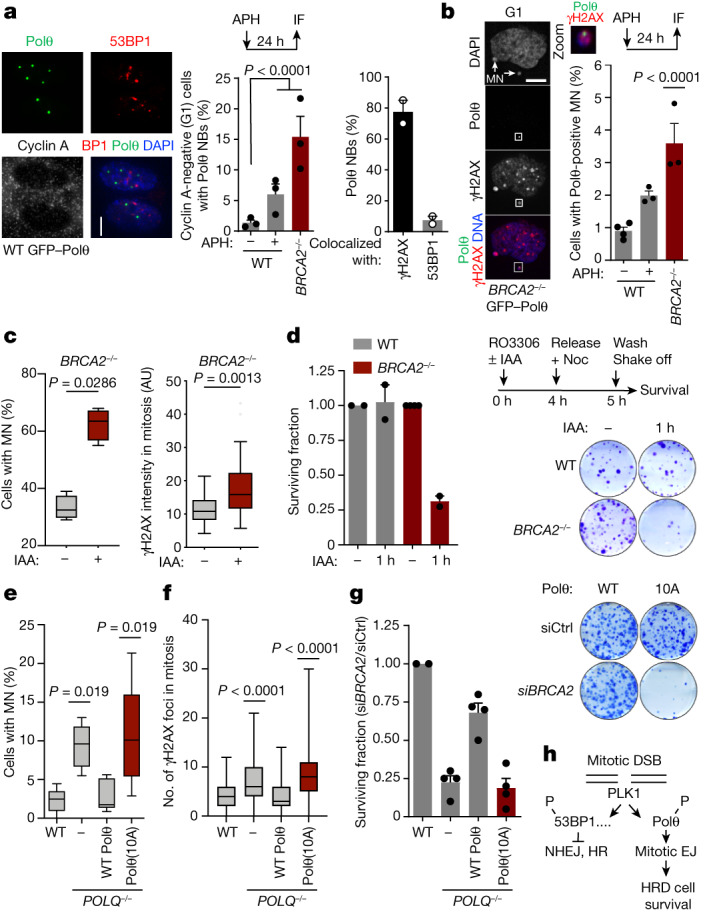
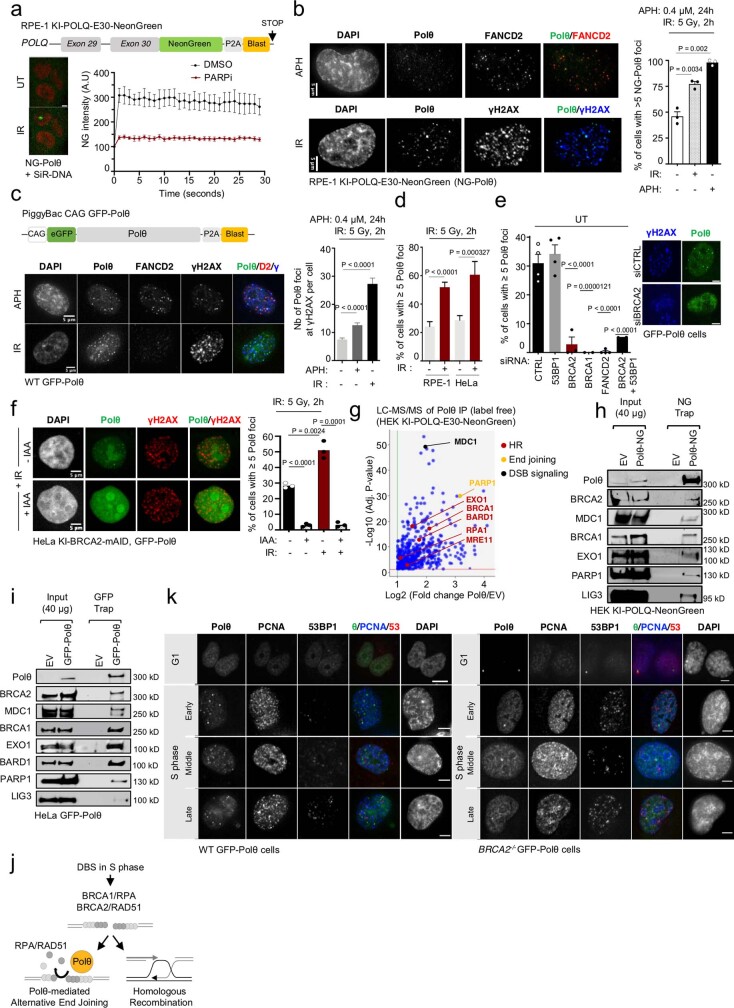
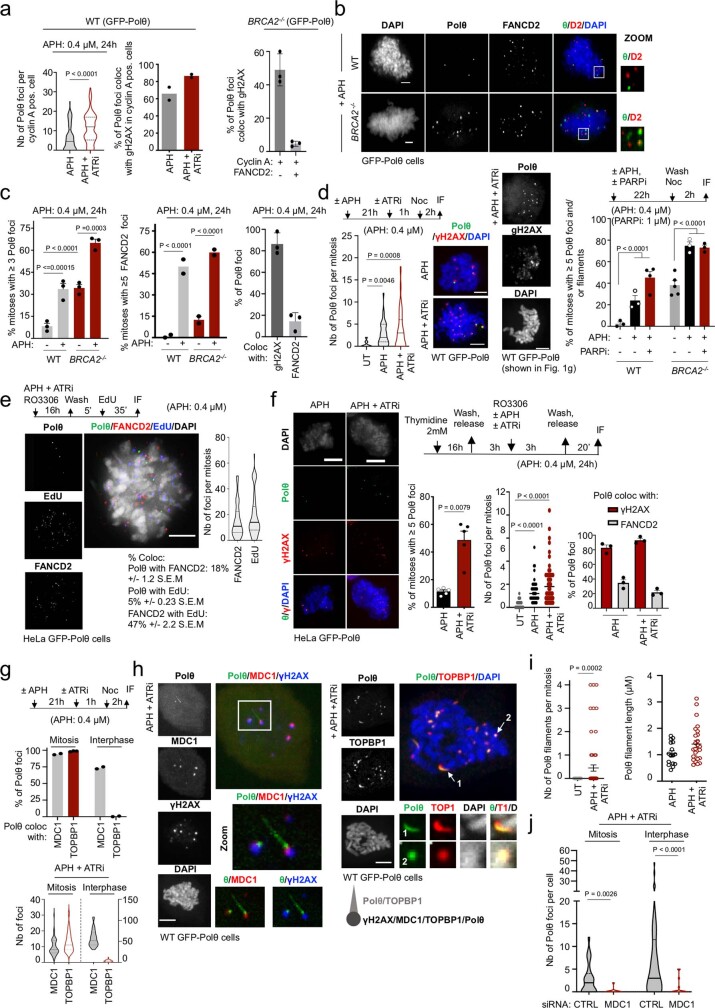
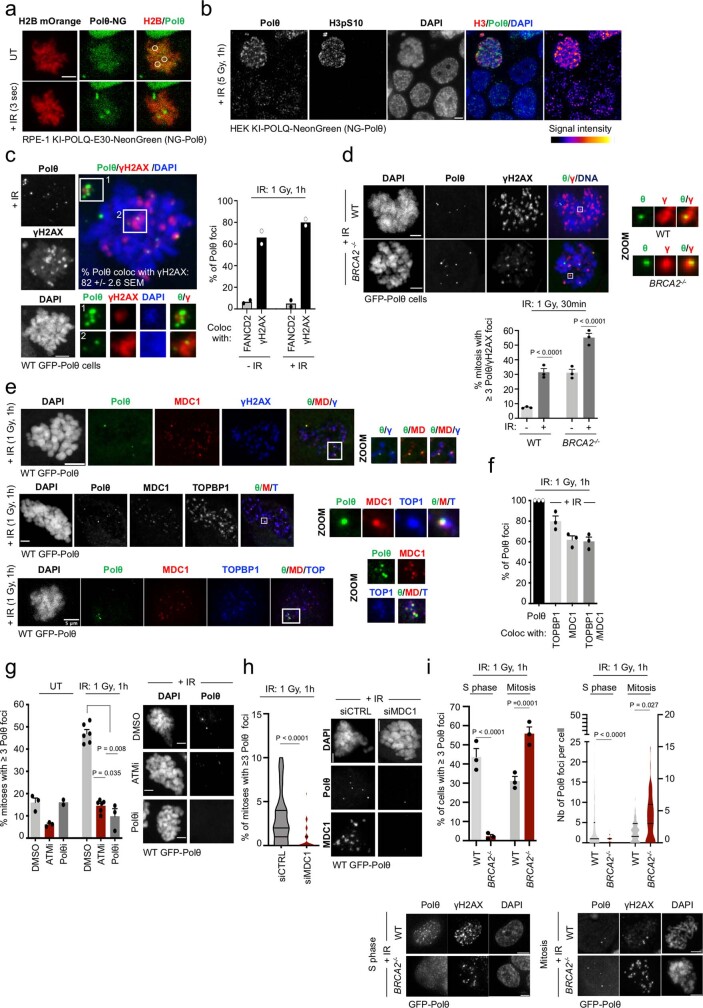
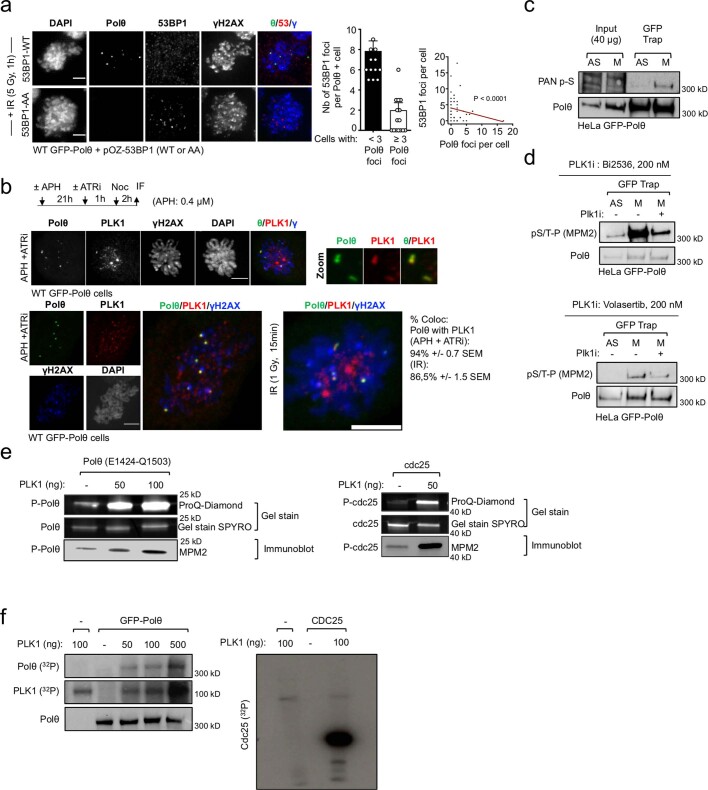
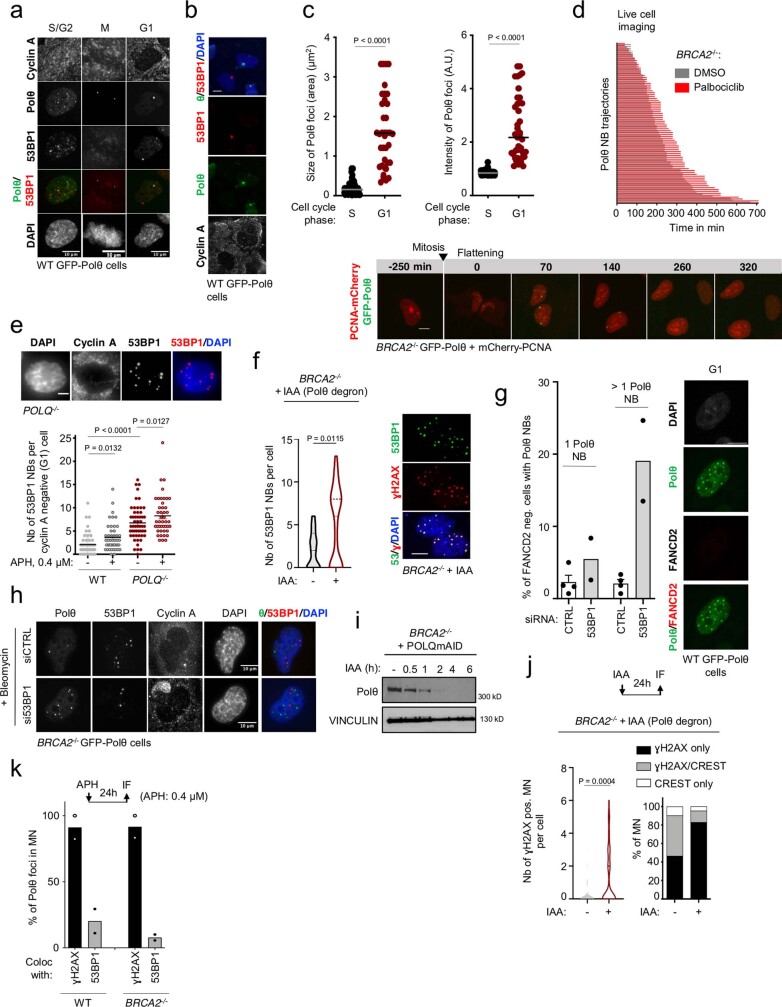
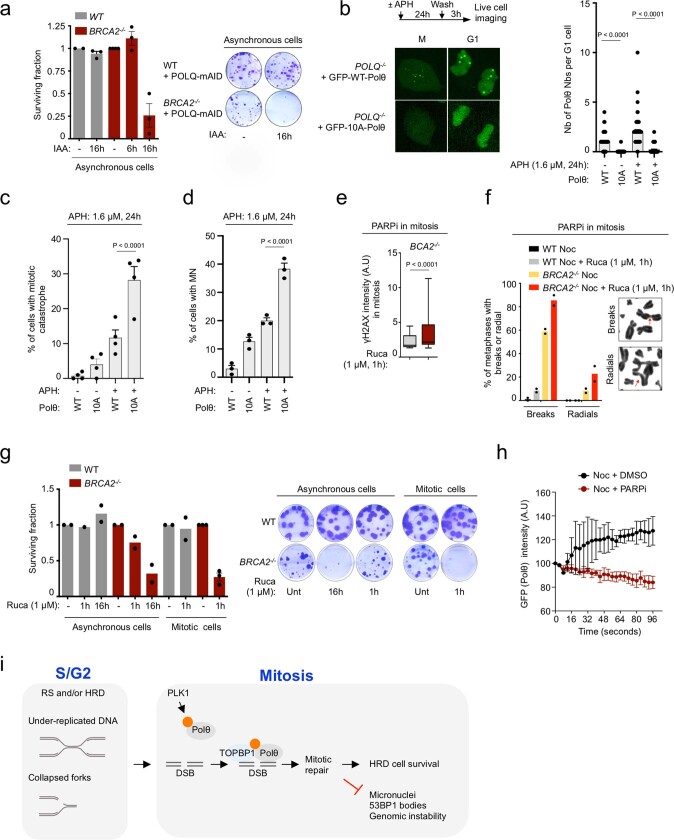
DNA double-strand breaks (DSBs) are deleterious lesions that challenge genome integrity. To mitigate this threat, human cells rely on the activity of multiple DNA repair machineries that are tightly regulated throughout the cell cycle1. In interphase, DSBs are mainly repaired by non-homologous end joining and homologous recombination2. However, these pathways are completely inhibited in mitosis3-5, leaving the fate of mitotic DSBs unknown. Here we show that DNA polymerase theta6 (Polθ) repairs mitotic DSBs and thereby maintains genome integrity. In contrast to other DSB repair factors, Polθ function is activated in mitosis upon phosphorylation by Polo-like kinase 1 (PLK1). Phosphorylated Polθ is recruited by a direct interaction with the BRCA1 C-terminal domains of TOPBP1 to mitotic DSBs, where it mediates joining of broken DNA ends. Loss of Polθ leads to defective repair of mitotic DSBs, resulting in a loss of genome integrity. This is further exacerbated in cells that are deficient in homologous recombination, where loss of mitotic DSB repair by Polθ results in cell death. Our results identify mitotic DSB repair as the underlying cause of synthetic lethality between Polθ and homologous recombination. Together, our findings reveal the critical importance of mitotic DSB repair in the maintenance of genome integrity.


Conflict of interest statement

The authors declare no competing interests.

Figures

Fig. 1
Fig. 1. Polθ is differentially recruited to DSBs depending on HR status and cell cycle phase.
a, Top, schematic of siRNA screen for ionizing radiation (IR)-induced Polθ foci formation. Bottom, robust Z-score (RZ score) for cell survival and Polθ foci formation for siRNA against indicated targets. For each siRNA, the median RZ score of three replicate experiments is shown. Arrows show the strongest RZ score for the indicated gene. Right, enriched Gene Ontology (GO) terms for biological processes identified among all targets. BER, base excision repair; ICL, interstrand crosslink repair; NER, nucleotide excision repair; TLS, translesion synthesis. b, Cell cycle distribution of Polθ foci in wild-type (WT) and BRCA2−/− cells (left), as determined by confocal microscopy (right). WT G1/G2: n = 407; WT S: n = 137; BRCA2−/− G1/G2: 119; BRCA2−/− S: n = 187. c, Representative images from live microscopy analysis of BRCA2−/− cells expressing GFP–Polθ and mCherry (mCh)–PCNA. d, Quantification of Polθ foci in G2 in wild-type and BRCA2−/− cells with indicated doses of aphidicolin (APH). Top, schematic of the experiment. e, Quantification of cells retaining Polθ foci while transitioning from G2 to mitosis. d,e, At least 30 cells were analysed for each condition per experiment. f, Quantification of Polθ foci in mitotic cells upon indicated treatment (aphidicolin: 0.4 μM, 24 h). Untreated (UT): n = 165; aphidicolin: n = 87; aphidicolin + ATR inhibitor VE-821 (ATRi): n = 152; BRCA2−/−: n = 165. IF, immunofluorescence; Noc, nocodazole. g,h, Representative images and quantification of colocalization of Polθ foci (g) and filaments (h) with γH2AX and TOPBP1 in mitosis. i, Quantification of Polθ foci formation upon indicated treatment in interphase or mitotic cells. All scale bars represent 5 μm. Mitosis control (Ctrl): n = 58; mitosis TOPBP1: n = 38; interphase control: n = 53; interphase TOPBP1: n = 83. Data represent three biological replicates. Data are mean ± s.e.m, except in violin plots (i), which show median with quartiles. b,f, Chi-square test. b, Wild type, χ2 = 43.6427; BRCA2−/−, χ2 = 130.003. f, aphidicolin + ATRi, χ2 = 129.9292; BRCA2−/−, χ2 = 85.7293. i, Kruskal–Wallis test corrected with Dunn’s multiple comparisons test.
Fig. 2
Fig. 2. Polθ is phosphorylated by PLK1 and binds to TOPBP1 in mitosis.
a, Immunoblot analysis with anti-Polθ, anti-phospho-Ser/Thr-Pro (pS/T-P) and pan-phosphoserine antibody following immunoprecipitation of Polθ–GFP from asynchronous (AS) and mitotic (M) cells. A representative experiment is shown; the experiment was repeated four times with similar results. b, Scheme depicting PLK1 phosphorylation sites on Polθ. MS, mass spectrometry. c, Left, superposition of the 2D NMR 1H-15N selective optimized flip angle short transient heteronuclear single quantum coherence (SOFAST HMQC) spectra recorded on an 15N,13C-labelled Polθ E1424–Q1503 fragment before (black) and after (red) incubation with PLK1. Right, magnified view of the spectral region containing NMR signals of phosphorylated residues. d, Phosphorylation kinetics, as monitored by real-time NMR. Intensities of NMR peaks corresponding to phosphorylated residues shown in c were measured on a series of SOFAST HMQC spectra recorded on the Polθ E1424–Q1503 fragment incubated with PLK1 and plotted as a function of time. e, Alignment and conservation score of nine homologous sequences of Polθ from vertebrates. Colours reflect the conservation score. f, Immunoblot analysis following immunoprecipitation of phosphorylated (4S-P) and non-phosphorylated Polθ peptides incubated with HeLa cell protein extract (top), and indicated TOPBP1 BRCT domains purified from E. coli (bottom). A representative experiment is shown; the experiment was repeated twice with similar results. g, Binding kinetics of phosphorylated (4S-P) and non-phosphorylated (4S) Polθ peptide titrated with purified TOPBP1 BRCT7-8, as observed by BLI. Kd, dissociation constant. h, Left, superposition of the 2D NMR 1H-15N SOFAST HMQC spectra recorded on a 15N-labelled phosphorylated Polθ E1424–Q1503 fragment before (black) and after (green) incubation with TOPBP1 BRCT7-8. Phosphorylation sites are indicated by red lines. Right, plot of the intensity ratio of peaks corresponding to each residue (in the bound versus free peptide) as a function of Polθ residue number. The dashed line outlines NMR peaks that disappear owing to the interaction of Polθ with TOPBP1 BRCT7-8. Red dots indicate phosphorylated residues. i, Model of the Polθ–TOPBP1 interaction, calculated using AlphaFold-Multimer. The Polθ peptide is displayed as green sticks, with phosphorylated serines in pale green. The TOPBP1 BRCT7-8 domain is displayed as a surface coloured as a function of its electrostatic potential (red, negatively charged; blue, positively charged).
Fig. 3
Fig. 3. Polθ phosphorylation and interaction with TOPBP1 enable DSB repair in mitosis.
a, Experimental workflow. b, Top, the number of mitotic DNA repair events identified following CRISPR–Cas9-induced cleavage in indicated cell lines. Bottom, representative repaired DNA sequences. Deletions (Del) and microhomology (MH) sizes are indicated. At repair junctions, microhomologies are indicated in bold and the Hph1 recognition site is in blue. c, Deletion size of mitotic DNA repair events identified in wild-type and POLQ−/− cells. Each dot represents a mitotic DNA repair event. d, The frequency, deletion size and use of microhomology in mitotic DNA repair events identified in wild-type and POLQ−/− cells. Events with deletions size greater than 60 bp are represented. e, Top, schematic representation of phosphorylation sites mutated in Polθ(10A) and Polθ(4A) constructs. Bottom, immunoblot analysis following immunoprecipitation of indicated construct. f, Representative images and quantification of Polθ foci and filaments in cells expressing wild-type Polθ, Polθ(10A) and Polθ(4A). Left to right: n = 98, 60, 37, 74, 219 and 50. g, Top, schematic representation of phosphorylation sites mutated in Polθ(4D). Bottom, representative images (right) and quantification (left) of Polθ foci colocalizing with TOPBP1 in cells expressing wild-type Polθ and Polθ(4D). Wild-type Polθ: n = 180; Polθ(4D): n = 150. h, Quantification of Polθ foci formation in cells expressing wild-type Polθ and Polθ(4D) upon indicated treatment in S phase cells. WT Polθ control: n = 620; WT Polθ TOPBP1: n = 582; Polθ(4D) control: n = 441; Polθ(4D) TOPBP1: n = 880. i, Mitotic repair efficiency in indicated cell lines upon indicated treatment. Left to right: n = 4, 4, 4, 3, 2 and 2. j, Quantification of γH2AX signal at different time points after ionizing radiation (1 Gy) in mitosis. Left to right: n = 119, 59, 152, 81, 203, 188, 388, 227, 532, 181, 155, 239, 216, 159 and 102, with two replicates. Mixed-effects analysis, corrected with Holm–Šídák’s multiple comparisons test. Scale bars, 5 μm. Data represent three biological replicates, except where indicated. Data are mean ± s.e.m., except in violin plots (e), which show median with quartiles. f,h,j, Kruskal–Wallis test, corrected with Dunn’s multiple comparisons test.
Fig. 4
Fig. 4. Polθ function in mitosis maintains genome stability and survival of HR-deficient cells.
a, Representative images (left) and quantification (centre) of Polθ nuclear bodies (NBs) in cyclin A-negative (G1) cells. WT −aphidicolin: n = 362; WT +aphidicolin: n = 137; BRCA2−/−: n = 127. Right, colocalization of Polθ nuclear bodies with indicated proteins. At least 30 nuclear bodies were scored for each experiment. Scale bar, 5 μm. b, Representative images (left) and quantification (right) of Polθ-positive micronuclei (MN). White square indicates the enlarged section. WT −aphidicolin: n = 815; WT +aphidicolin: n = 448; BRCA2−/−: n = 552. Scale bar, 10 μm. c, Quantification of micronuclei (left, n = 4 replicates) and γH2AX intensity (right, n = 2 replicates) upon Polθ depletion in mitosis. Polθ depletion is achieved by indole-3-acetic acid (IAA) treatment (degron expression). Left to right: n = 89, 83, 31 and 43. AU, arbitrary units. d, Experimental workflow (top right), representative images (bottom right) and quantification (left) of 14-day clonogenic survival assays upon depletion of Polθ (IAA treatment) in mitosis. For wild type, the number of replicates is 2. eg, Quantification of micronuclei (e), γH2AX foci (f) and clonogenic survival (g) in POLQ−/− cells complemented with wild-type Polθ or Polθ(10A). e, Left to right: n = 6, 8, 6 and 7 replicates, with at least 100 cells analysed per condition for each experiment. f, Left to right: n = 120, 109, 104 and 123. g, Left to right: 2, 4, 4 and 4 replicates. siCtrl, control siRNA targeting LacZ; siBRCA2, siRNA targeting BRCA2. h, Model for the function of Polθ in mitosis. EJ, end joining. Data represent three biological replicates, except where indicated. Data are mean ± s.e.m. except in box plots (c,e,f), which show median with minimum and maximum values. a,b, Chi-square test. a, Aphidicolin, χ2 = 6.8345; BRCA2−/−, χ2 = 33.9998. b, χ2 = 14.2308. c, Two-tailed Mann–Whitney test. e,f, Kruskal–Wallis test, corrected with Dunn’s multiple comparisons test.
Extended Data Fig. 1
Extended Data Fig. 1. related to Fig. 1. Polθ foci formation in different cell cycle phases varies with HR status.
a, Scheme representing endogenously tagged POLQ locus. Representative images and quantification of endogenous Neon Green (NG)-tagged Polθ recruitment to laser microirradiated loci in RPE-1 cells. b, Representative images and quantification of endogenous NG-Polθ foci formation upon indicated treatment. From left to right, n = 31, 28, 83. c,d, Scheme representing exogenously expressed GFP-tagged Polθ. Representative images and quantification of GFP-Polθ (Polθ) foci following indicated treatment. In (c), from left to right, n = 90, 65, 32. In (d), from left to right, n = 120, 110, 100, 120. e, Quantification of Polθ foci formation following transfection with indicated siRNAs. From left to right, n = 982, 1082, 545, 45, 1152, 304, among (4, 4, 3, 2, 4, 2) replicates f, Representative images and quantification of IR-induced Polθ foci in HeLa cells expressing mAID-tagged (degron) BRCA2. BRCA2 degradation was achieved upon indole-3-acetic acid (IAA) treatment. At least 20 cells were analyzed in each condition in each replicate (two). g, Volcano plot of proteins co-immunoprecipitating with Polθ, as identified by label-free mass spectrometry. h, i, Immunoblot analysis following immunoprecipitation of (h) endogenous Neon Green (NG)-tagged Polθ and (i) exogenous GFP-tagged Polθ. j, Model for Polθ function and competition with HR in S phase. k, Panels showing representative images of Polθ foci formation in indicated phases of the cell cycle. Scale bars represent 5 μm. Data represents at least three biological replicates; except where indicated. For (b,f) unpaired t-test, for (c) Turkey’s multiple comparisons test, for (d,e) chi-square test, was performed. Chi-square statistics, in (d), from left to right: 24.8814, 12.9097; in (e), from left to right: 104.9835, 19.147, 401.2941, 78.6678.
Extended Data Fig. 2
Extended Data Fig. 2. related to Fig. 1. Polθ forms replication stress (RS)-induced foci in mitosis.
a,b,c,d, Representative images and quantification of exogenous GFP-Polθ foci formation in WT and BRCA2−/− cells following indicated treatment. From left to right, in (a), n = 102, 112 (nb of cells); in (c), n = 90, 90, 91, 90; in (d-1 (left)), n = 20, 37, 65, among two replicates; in (d-2 (right)), at least 75 mitoses were analyzed for each condition in each replicate. e,f, Experimental design, representative images and quantification of Polθ foci (green) colocalization with DNA synthesis (EdU, blue) and FANCD2 (red) in mitotic cells. In (e), n = 62; in (f), from left to right, n = 41, 37, 44. g, Quantification of Polθ foci colocalization with MDC1 and TOPBP1. On top, n = 20 (cells), among two replicates; on bottom, from left to right, n = 50, 27, 36, 64 (cells), among two replicates. h, Representative images of Polθ foci and filament colocalization with γH2AX, MDC1 and TOPBP1 in mitosis. i, Quantification of Polθ filaments upon indicated treatment. From left to right, n = 26, 16, 26, 16. j, Quantification of Polθ foci formation upon MDC1 depletion in mitotic and interphase cells following indicated treatment. From left to right, n = 27, 11, 41, 16 among two replicates. Scale bars represent 5 μm, except (b), where 1 μm. Data represents at least three biological replicates. Data shows mean +/− S.E.M., except violin plots (g, j) showing median with quartiles. For (a,d, f-1 (left), i, j) two-tailed Mann-Whitney test; for (c) chi-square test, with chi-square statistics from left to right: 18.7626, 22.1553, 17.4308; for (f-2 (right)) Kruskal-Wallis test, corrected with Dunn’s multiple comparisons test was performed.
Extended Data Fig. 3
Extended Data Fig. 3. related to Fig. 1. Polθ forms radiation (IR)-induced foci in mitosis.
a,b, Representative images of endogenous NG-Polθ foci formation upon (a) laser microirradiation or (b) X-ray irradiation (5 Gy, 1 h) in HEK cells. H3pS10 stains mitotic chromatin. c,d,e,f,g, Representative images and quantification of Polθ foci formation and colocalization with indicated proteins in mitosis following indicated doses of (X-ray) irradiation. In (d), from left to right, n = 88, 90, 76, 81; in (c,f), at least 35; in (g) at least 20 cells were analyzed in each condition in each replicate (two for (f)). h, Quantification of irradiation-induced Polθ foci following transfection with indicated siRNAs. From left to right, n = 57, 38, among two replicates. i, Representative images and quantification of irradiation-induced Polθ foci in WT and BRCA2−/− cells in indicated cell cycle phases. From left to right, n = 974, 276, 75, 73. Scale bars represent 5 μm. Data represents three biological replicates, except where indicated. Data shows mean +/− S.E.M. For. For (d, i-2 (right)) chi-square test was performed, with chi-square statistics from left to right, in (d): 20.6912, 21.258; in (i-2): 160.6157, 9.7992; for (h) two-tailed Mann-Whitney test; for (g, i-1 (left)) Kruskal-Wallis test, corrected with Dunn’s multiple comparisons test was performed.
Extended Data Fig. 4
Extended Data Fig. 4. related to Fig. 2. Polθ is phosphorylated by PLK1 in mitosis.
a, Representative images and quantification of GFP-Polθ foci formation in cells expressing wild-type (WT) or mutant (AA) 53BP1 upon irradiation in mitosis. 30 cells were analyzed among 3 replicates. Data shows mean +/− S.E.M. Fisher’s exact test was performed to determine significance. b, Representative images and quantification of Polθ foci colocalization with PLK1 in mitosis following indicated treatment. Experiments were repeated twice with similar results. c,d, Immunoblot analysis following immunoprecipitation of GFP-tagged Polθ in asynchronous or mitotic cells upon indicated treatment. Representative experiments are shown; experiments were repeated three times with similar results. e, Representative in vitro phosphorylation assay with the Polθ fragment (E1424 to Q1503) incubated with recombinant PLK1 enzyme. Phosphorylation signals were revealed using Gel Stain and immunoblot analyses (MPM2 antibody). Cdc25 phosphorylation by PLK1 is used as a control. Representative experiments are shown; experiments were repeated twice with similar results. f, Representative in vitro kinase assay with Polθ incubated with recombinant PLK1 enzyme and 32P-labeled ATP. Representative experiment is shown; experiment was repeated three times with similar results.
Extended Data Fig. 5
Extended Data Fig. 5. related to Fig. 2. Biochemical characterization of Polθ phosphorylation by PLK1.
a,b, Assignment of the 2D NMR 1H-15N SO-FAST HMQC peaks of the indicated Polθ fragments (E1424-Q1503 for a) (E1540-S1660 for b). c, Superposition of the 2D NMR 1H-15N SO-FAST HMQC spectra recorded on an 15N, 13C labeled Polθ fragment from E1540 to S1660, before (black) and after (red) incubation with PLK1. A zoom shows the spectral region containing the NMR signals of phosphorylated residues. d, Alignment of 11 homologous sequences of the Polθ fragment E1424-Q1503 and N1626-P1652. All labeled residues were detected as phosphorylated by PLK1. Residues marked in red correspond to canonical PLK1 phosphorylation sites. The conservation score was calculated using Jalview. e, AlphaFold model of the human Polθ protein. The two folded N-terminal and C-terminal domains are colored in green and yellow, respectively, while the disordered central region, from G895 to S1824, is colored in red.
Extended Data Fig. 6
Extended Data Fig. 6. related to Fig. 2. Characterization of Polθ binding to TOPBP1.
a, Volcano plot of proteins co-immunoprecipitating with 4S-P Polθ peptide, as identified by label-free mass spectrometry. b, Enriched GO terms of biological processes, identified among the most enriched binding partners of the 4S-P Polθ peptide as compared to the 4S Polθ. c, Immunoblot analysis following immunoprecipitation of indicated phosphorylated and non-phosphorylated Polθ peptides incubated with HeLa cell protein extracts. Representative experiment is shown; experiment was repeated twice with similar results. d, Association and dissociation curves of indicated Polθ peptide (S4-P and 4S) in the presence of increasing TOPBP1 BRCT7-8 concentrations, as observed by Bio-layer interferometry. e, SDS-PAGE of the indicated NMR samples for the experiments shown in 2h. Representative experiment is shown; experiment was repeated twice with similar results. f, Superposition of the 2D NMR 1H-15N SO-FAST HMQC spectra recorded on an 15N-labeled non-phosphorylated Polθ fragment from Glu1424 to Gln1503, before (black) and after (blue) incubation with TOPBP1 BRCT7-8. The intensity ratio of the peaks corresponding to each residue (in the bound versus free peptides) is plotted as a function of the Polθ residue number. A box marks the NMR peaks disappearing due to the Polθ interaction with TOPBP1 BRCT7-8. The SDS-PAGE of the NMR samples is shown. Representative experiment is shown; experiment was repeated twice with similar results.
Extended Data Fig. 7
Extended Data Fig. 7. related to Fig. 3. Polθ repair signature in asynchronous and mitotic cells.
a, DNA sequences of CRISPR-Cas9 induced-cleavage sites at locus 1 and locus 2. Blue letters indicate Hph1 recognition site. b, Quantification of H3pS10 positive cells (mitotic), assessed by immunofluorescence, in indicated experiments. c, Total number of DNA repair events obtained at both loci from asynchronous (AS) and mitotic cells. d,e, Graph showing the frequency, deletion size and MH use of DNA repair events identified in asynchronous (AS) and mitotic (Mit) cells. f, Table recording number and frequency of repair events (with or without insertion). g, Graph showing the frequency, deletion and insertion size of mitotic DNA repair events identified in WT and POLQ−/− cells. h, Quantification of γH2AX signal at different time points after radiation (1 Gy) in mitosis. From left to right, n = 119, 60, 91, 104, 81, 203, 91, 116. i, Immunoblot analyses following immunoprecipitation of indicated constructs. j,k, DNA repair efficiency upon indicated treatment and in mitotic (j) or asynchronous (k) indicated cell lines. From left to right, for (j), n = 10, 8, 10, 6; for (k), n = 4, 4, 3, 3, 2. Data represent three biological replicates, except where indicated. Data shows mean +/− S.E.M., expect violin plots (i) showing median with quartiles. For (h) Kruskal-Wallis test, corrected with Dunn’s multiple comparisons test; for (j,k) mixed-effects analysis was performed, corrected with Holm-Šídák’s multiple comparisons test.
Extended Data Fig. 8
Extended Data Fig. 8. related to Fig. 3. Polθ foci formation in mitosis are dependent on its phosphorylation by PLK1.
a, Representative images of live microscopy analysis of POLQ−/− cells expressing WT- or 10A- Polθ and mCherry-PCNA. b,c,d,e, Representative images and quantification of Polθ foci formation following indicated treatment in indicated phases of the cell cycle in WT and BRCA2−/− cells. In (b), from left to right, n = 46, 57, 57, 146, 40, 77, 95, 52, 150, 48, 203, 199, 156, 325, 152. In (c, d), n > 30 for each condition in each replicate. In (e), from left to right n = 52, 54, 63, 76; among two replicates. f, Quantification of number and length of Polθ filaments in cells expressing WT- or 4A-Polθ. From left to right, n = 87, 114, 77, 0. g, Quantification of Polθ foci formation following indicated treatment in cells expressing WT- or 10A-Polθ. Data represents two biological replicates. From left to right, n = 45, 24, 39, 37. Scale bars represent 5 μm. Data represents three biological replicates, except where indicated. Data shows mean +/− S.E.M., except violin plots (b,f,g) showing median with quartiles. For (b1 (left), g) Kruskal-Wallis test, corrected with Dunn’s multiple comparisons test; for b2-3, chi-square test, with chi-square statistics, from left to right: 6.2656, 10.5753, 6.8895, 95.0355, 45.1237; for (c) Mixed-effects analysis, corrected with Holm-Šídák’s multiple comparisons test; for (d) unpaired t-test; for (f) two-tailed Mann-Whitney test was performed.
Extended Data Fig. 9
Extended Data Fig. 9. related to Fig. 4. Polθ forms nuclear bodies (NBs) in G1.
a, b, Representative images of Polθ nuclear bodies (Polθ NBs) and 53BP1 nuclear bodies (53BP1 NBs) in cyclin A-negative (G1) cells. c, Size and intensity of Polθ foci in indicated cell cycle phases. From left to right, n = 98, 15, 86, 41. d, Trajectories of individual Polθ NBs in BRCA2−/− RPE-1 cells blocked in G1 (Palbociclib treatment). Representative images of Polθ NBs from formation at mitotic exit (flattening) to dissolution in G1 (PCNA-negative cells) in BRCA2−/− cells. e, Representative images and quantification of 53BP1 NBs in WT and POLQ−/− cells upon indicated treatment. From left to right, n = 45, 46, 53, 47. f, Representative images and quantification of 53BP1 NBs in BRCA2−/− cells following Polθ depletion (IAA treatment). From left to right, n = 43, 29. g, h, Representative images and quantification of Polθ NBs in FANCD2-negative (G1) cells upon indicated treatment. i, Immunoblot analysis at indicated time points upon Polθ degradation (IAA treatment). In (g), from left to right, n = 561, 448 (4, 2 replicates). j, Quantification of micronuclei (MN) positive for γH2AX and/or CREST (centromere marker) in BRCA2−/− cells following Polθ degradation (IAA treatment). From left to right, n = 75, 57; among two replicates. k, Quantification of Polθ foci in micronuclei (MN) in indicated cell lines. Scale bars represent 5 μm, except where indicated. Data represents three biological replicates, except where indicated. Data shows mean +/− S.E.M., except box plots (c) showing median with quartiles. For (c,f,j) two-tailed Mann-Whitney test; for (e) unpaired t-test was performed.
Extended Data Fig. 10
Extended Data Fig. 10. related to Fig. 4. Polθ acts in mitosis to preserve genome integrity and HR-deficient cell survival.
a, Representative images and quantification of 14-days clonogenic survival upon Polθ depletion in asynchronous cells. b,c,d, Quantification of Polθ NBs (b), mitotic catastrophe (c), and micronuclei (MN) (d) in indicated cell lines upon indicated treatment. In (b–d), data represented belongs to the same experiment, from left to right, n = 75, 52, 86, 65. e, Quantification of γH2AX intensity upon PARPi (Rucaparib) treatment in mitosis. From left to right, n = 51, 68; among two replicates. f, Representative images and quantification of chromosomal rearrangements (breaks and radials) in WT and BRCA2−/− cells treated with or without PARPi for 1 h in mitosis. At least 50 metaphase spreads were analyzed in each condition in each replicate (two). g, Representative images and quantification of clonogenic survival upon PARPi (Rucaparib) treatment in asynchronous and mitotic cells. Columns without error bars represent one, columns with error bars represent two replicates. h, Quantification of Polθ recruitment to laser microirradiated stripes in mitosis. 10 cells were analyzed for both conditions, among two replicates. i, Extended model for function of Polθ in mitosis. Scale bars represent 5 μm. Data represents three biological replicates. Data shows mean +/− S.E.M., except box plots (f) showing median with quartiles. For (b–d) Friedman test, corrected with Dunn’s multiple comparisons test, for (e) two-tailed Mann-Whitney test was performed.

Similar articles

Cited by

References

    1. Hustedt N, Durocher D. The control of DNA repair by the cell cycle. Nat. Cell Biol. 2017;19:1–9. doi: 10.1038/ncb3452. - DOI - PubMed
    1. Scully R, Panday A, Elango R, Willis NA. DNA double-strand break repair-pathway choice in somatic mammalian cells. Nat. Rev. Mol. Cell Biol. 2019;20:698–714. doi: 10.1038/s41580-019-0152-0. - DOI - PMC - PubMed
    1. Esashi F, et al. CDK-dependent phosphorylation of BRCA2 as a regulatory mechanism for recombinational repair. Nature. 2005;434:598–604. doi: 10.1038/nature03404. - DOI - PubMed
    1. Orthwein A, et al. Mitosis inhibits DNA double-strand break repair to guard against telomere fusions. Science. 2014;189:189–193. doi: 10.1126/science.1248024. - DOI - PubMed
    1. Terasawa M, Shinohara A, Shinohara M. Canonical non-homologous end joining in mitosis induces genome instability and is suppressed by M-phase-specific phosphorylation of XRCC4. PLoS Genet. 2014;10:e1004563. doi: 10.1371/journal.pgen.1004563. - DOI - PMC - PubMed