. 2023 Oct;622(7981):120-129.
doi: 10.1038/s41586-023-06502-w. Epub 2023 Sep 6.

Specialized astrocytes mediate glutamatergic gliotransmission in the CNS

Affiliations

Specialized astrocytes mediate glutamatergic gliotransmission in the CNS

Roberta de Ceglia et al. Nature. 2023 Oct.

Abstract

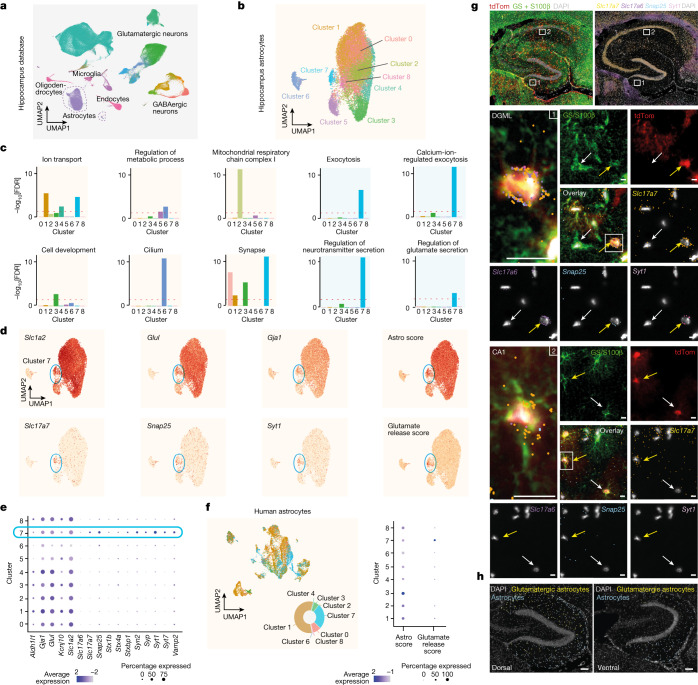
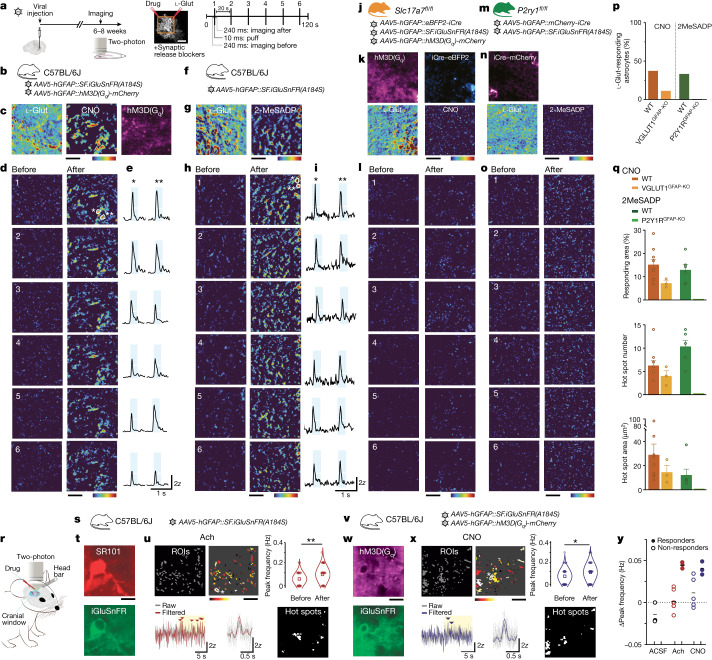
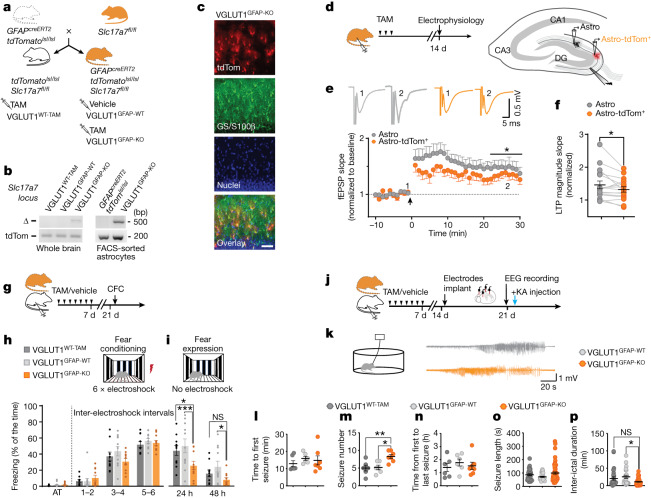
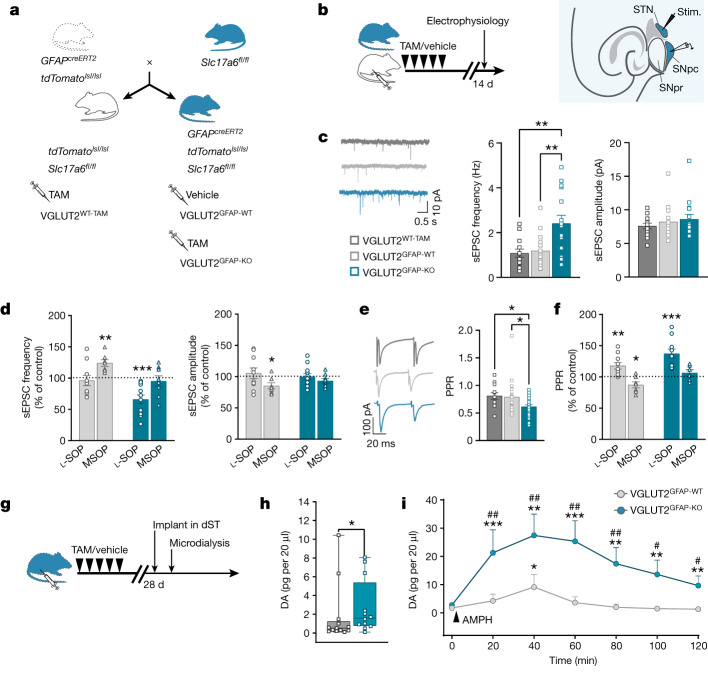
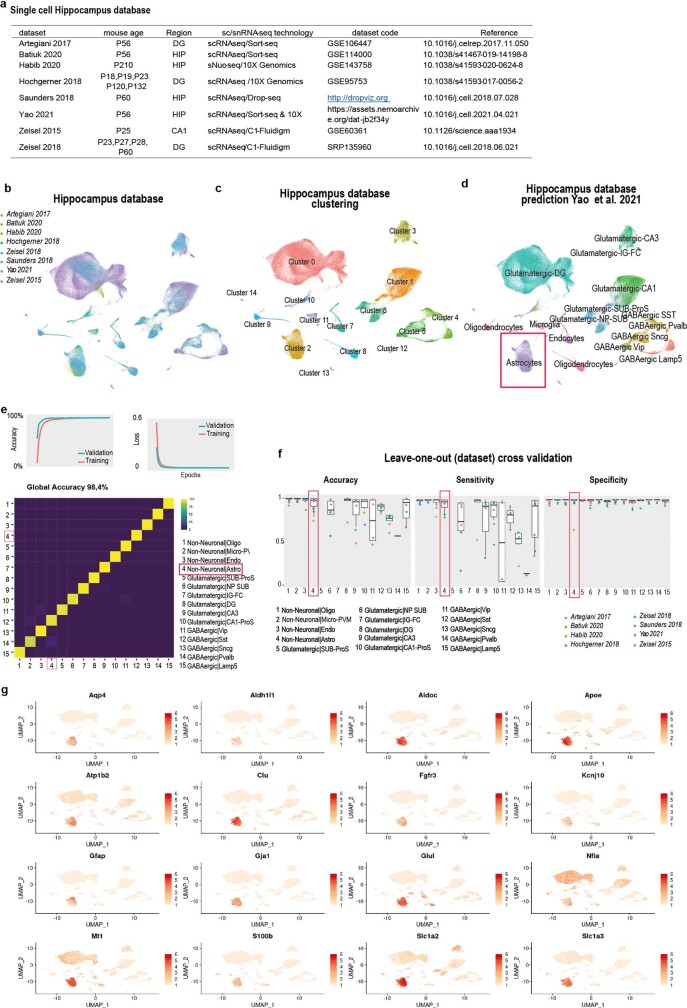
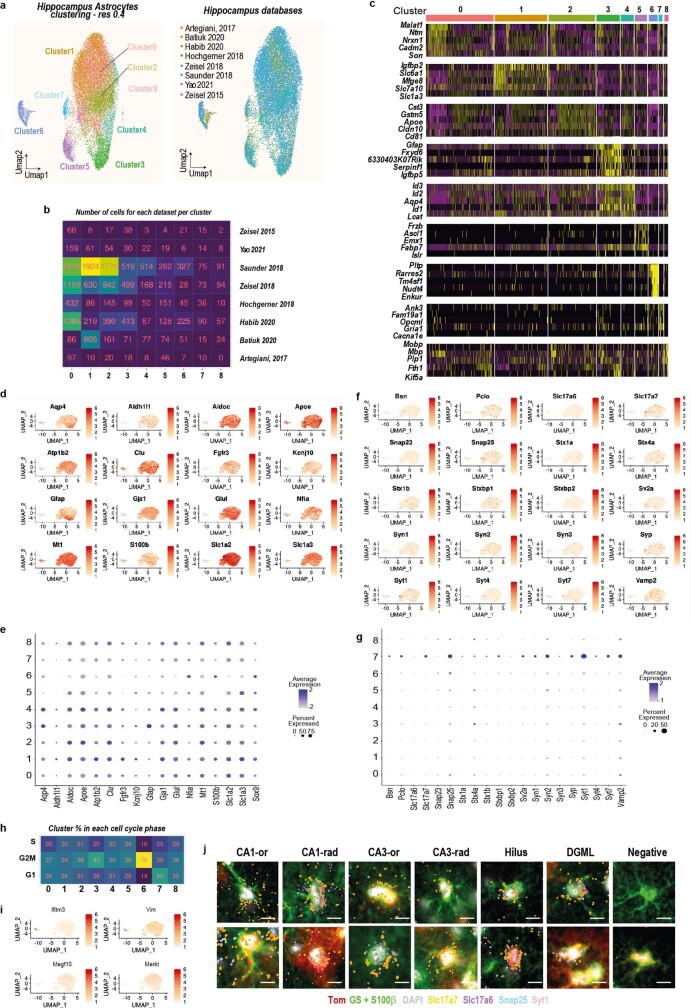
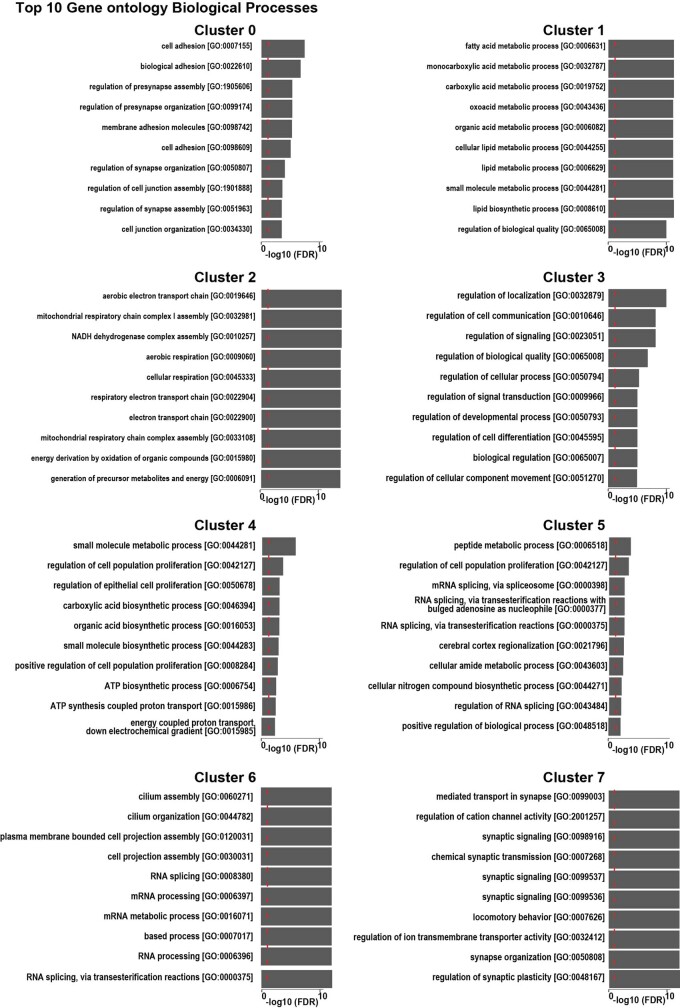
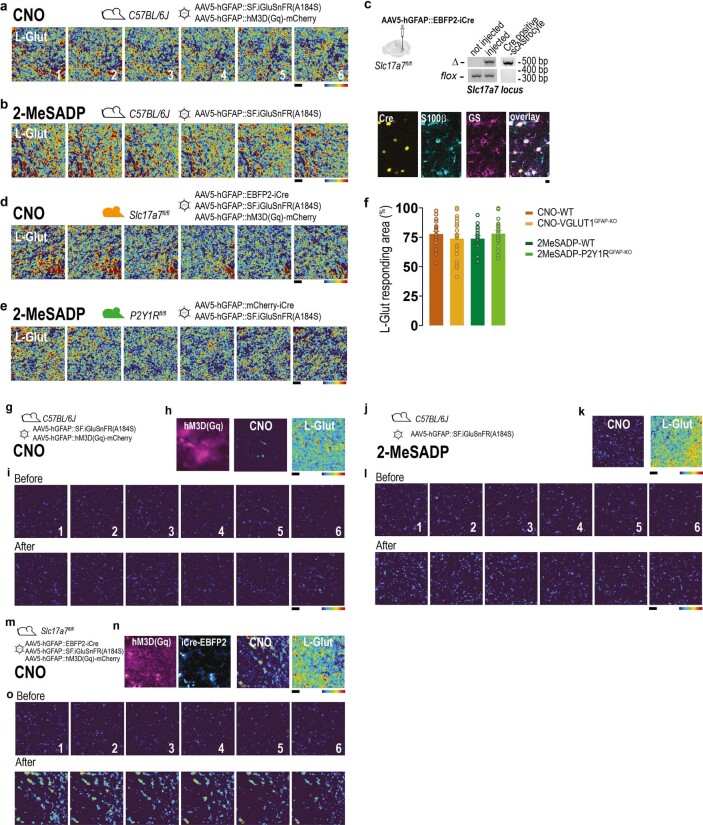
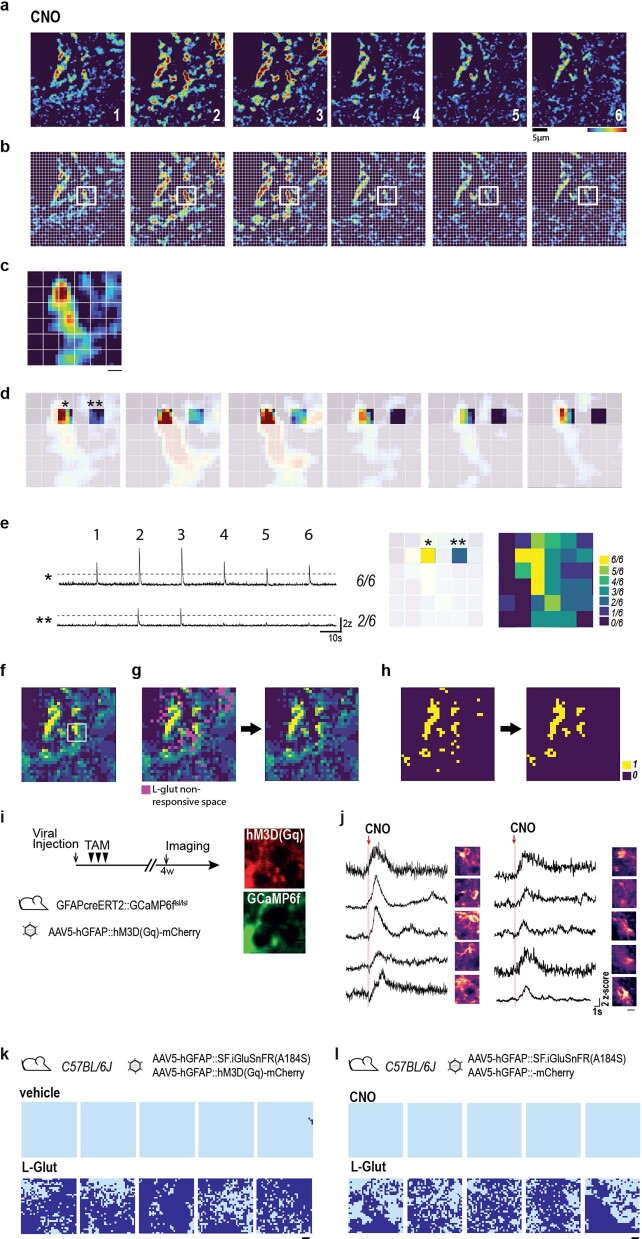
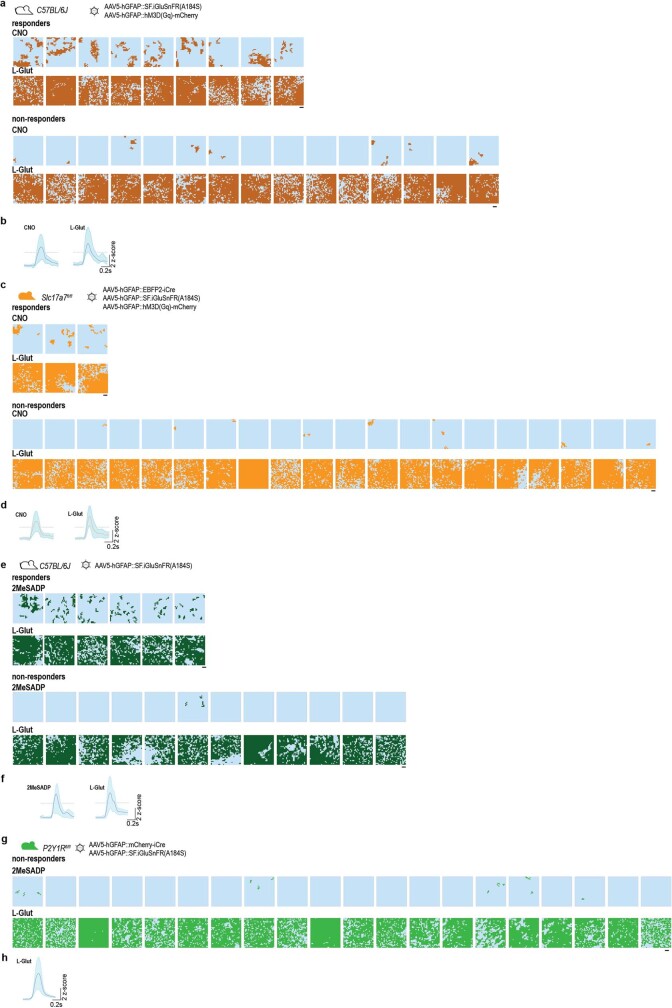
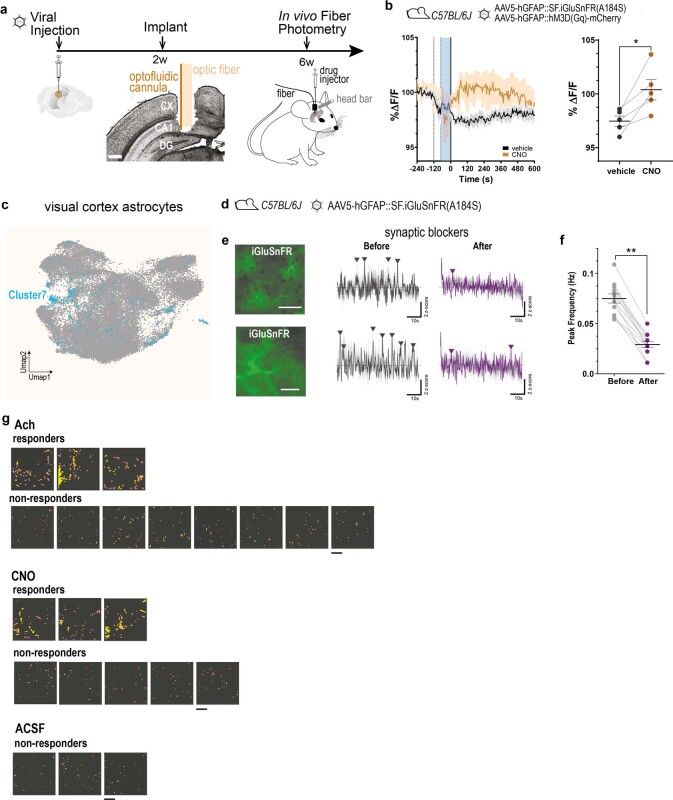
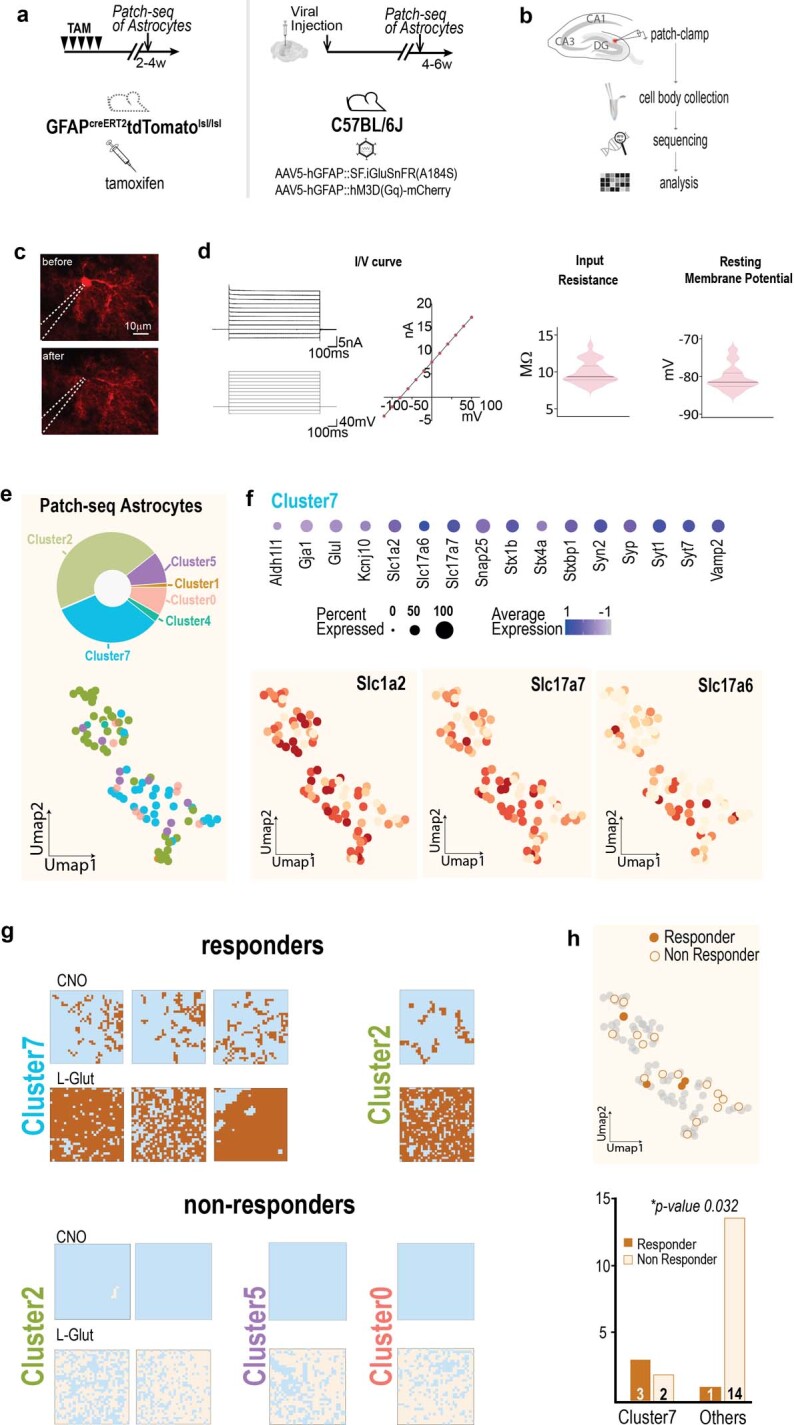
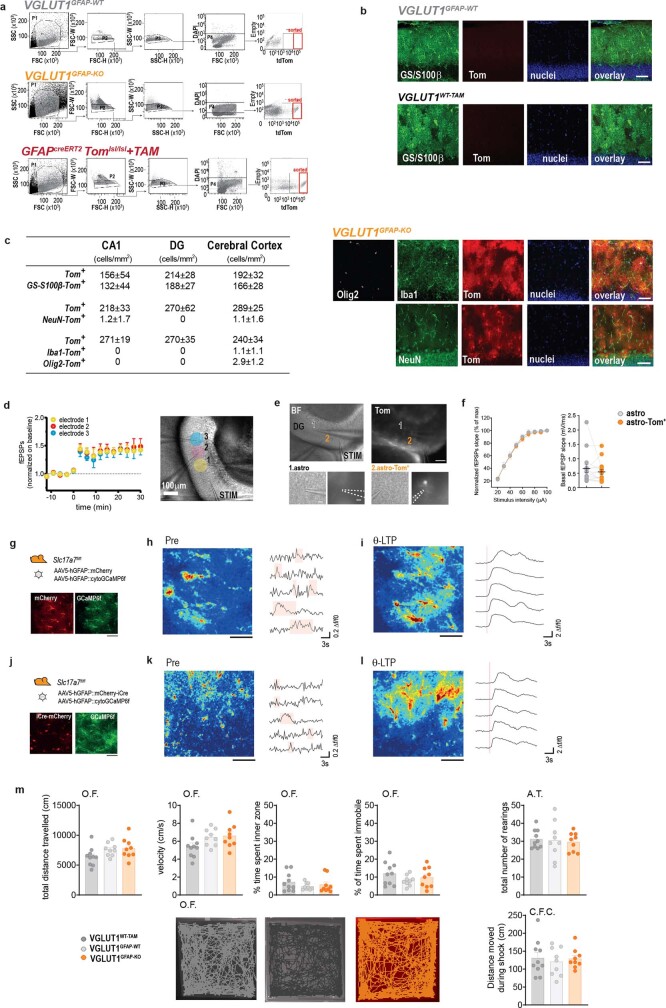
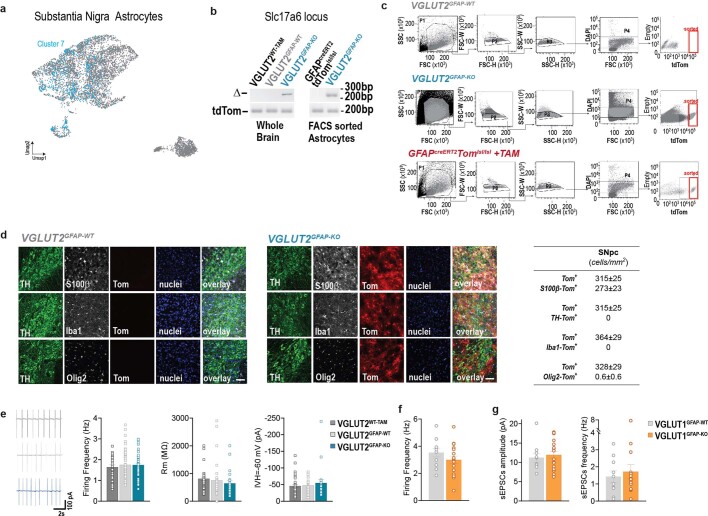
Multimodal astrocyte-neuron communications govern brain circuitry assembly and function1. For example, through rapid glutamate release, astrocytes can control excitability, plasticity and synchronous activity2,3 of synaptic networks, while also contributing to their dysregulation in neuropsychiatric conditions4-7. For astrocytes to communicate through fast focal glutamate release, they should possess an apparatus for Ca2+-dependent exocytosis similar to neurons8-10. However, the existence of this mechanism has been questioned11-13 owing to inconsistent data14-17 and a lack of direct supporting evidence. Here we revisited the astrocyte glutamate exocytosis hypothesis by considering the emerging molecular heterogeneity of astrocytes18-21 and using molecular, bioinformatic and imaging approaches, together with cell-specific genetic tools that interfere with glutamate exocytosis in vivo. By analysing existing single-cell RNA-sequencing databases and our patch-seq data, we identified nine molecularly distinct clusters of hippocampal astrocytes, among which we found a notable subpopulation that selectively expressed synaptic-like glutamate-release machinery and localized to discrete hippocampal sites. Using GluSnFR-based glutamate imaging22 in situ and in vivo, we identified a corresponding astrocyte subgroup that responds reliably to astrocyte-selective stimulations with subsecond glutamate release events at spatially precise hotspots, which were suppressed by astrocyte-targeted deletion of vesicular glutamate transporter 1 (VGLUT1). Furthermore, deletion of this transporter or its isoform VGLUT2 revealed specific contributions of glutamatergic astrocytes in cortico-hippocampal and nigrostriatal circuits during normal behaviour and pathological processes. By uncovering this atypical subpopulation of specialized astrocytes in the adult brain, we provide insights into the complex roles of astrocytes in central nervous system (CNS) physiology and diseases, and identify a potential therapeutic target.


Conflict of interest statement

The authors declare no competing interests.

Figures

Fig. 1
Fig. 1. scRNA-seq and RNAscope HiPlex identification of a subpopulation of glutamatergic astrocytes in the mouse and human hippocampus.
a, UMAP representation of eight integrated hippocampus scRNA-seq datasets annotated using a neural network classifier trained on a comprehensive database. b, Cluster analysis of the subset astrocyte population revealing nine transcriptionally distinct clusters. c, GO analysis of differentially expressed genes highlighting specific term enrichments for each cluster. The red dashed line shows the threshold (1, −log10-transformed) for significant enrichments. d, The expression level for canonical astrocytic markers and their respective combinatorial astro score, notably in cluster 7 (top). Bottom, the expression level for glutamate exocytosis markers and the glutamate-release score, notably in cluster 7. e, Expression of selected marker genes related to astrocytic identity, vesicular trafficking and glutamate-regulated exocytosis for each predicted astrocyte cluster. f, UMAP analysis of integrated human hippocampus scRNA-seq data, classified using our integrated astrocyte database as a reference (left). The pie chart shows the distribution across predicted clusters. Right, dot plot of canonical astrocytic or glutamate exocytosis combinatorial score for predicted astrocyte clusters. g,h, RNAscope HiPlex assay combined with immunohistochemistry. n = 12 slices, 2 mice. g, Low-magnification dorsal hippocampus slice from mice expressing tdTomato under the GFAP promoter (red; Methods) showing immunohistochemistry staining for combined GS and S100β (green), and DAPI (white) (top left). Top right, in the same slice, HiPlex analysis of Slc17a7 (yellow), Slc17a6 (violet), Snap25 (blue) and Syt1 (pink). Middle, magnified images of the DGML (indicated by the white rectangle 1 in the top images), showing expression of all of the astrocytic markers and glutamate exocytosis markers listed in the top images. A glutamatergic astrocyte (yellow arrow) and a non-glutamatergic astrocyte (white arrow) are indicated. Inset (left): magnified view of the glutamatergic astrocyte. Bottom, as described for the middle images, but from the CA1 stratum radiatum region (CA1, white rectangle 2 in the top images). Scale bars, 10 µm. h, The proportion of glutamatergic (segmented in yellow) versus non-glutamatergic (azure) astrocytes along the dorsal–ventral axis of the hippocampus. Glutamatergic astrocytes are more abundant in a dorsal slice (left) compared with in a ventral slice (right). Scale bars, 100 µm.
Fig. 2
Fig. 2. Fast glutamate secretion at hotspots in a subgroup of astrocytes after selective chemogenetic or endogenous receptor stimulation in situ and in vivo.
a, Schematic of two-photon SF-iGluSnFR glutamate imaging experiments in hippocampal slices from virally injected WT or transgenic mice (details are provided in b,f,j and m) (left). Middle, typical FOV imaged from a DGML astrocyte. Drugs (CNO, 100 µM; 2MeSADP, 10 µM) and l-Glut (1 mM), all in Alexa-594 solution, were locally delivered through two puff pipettes. The slices were incubated with a cocktail of synaptic blockers (Methods). Right, the stimulation protocol used for drug applications. Ten-millisecond puff applications were performed six times, one every 20 s, during 120 s imaging acquisitions. ‘Before’ and ‘after’ correspond to the 240 ms imaging periods before and after each drug application shown in d,h,l and o as individual mean projections of the SF-iGluSnFR signal. Corresponding l-Glut-evoked responses are shown in Extended Data Fig. 4a,b,d,e. The whole-brain image is from the Allen Mouse Brain Connectivity Atlas (https://mouse.brain-map.org/). be, SF-iGluSnFR responses to chemogenetic stimulations in a representative astrocyte. b, Experiments in WT mice expressing SF-iGluSnFR and Gq-DREADD (hM3D(Gq)) in DGML astrocytes. c, Mean projection of Gq-DREADD–mCherry expression (right). Middle and left, s.d. projection of SF-iGluSnFR signal variance across 6 CNO (middle) or l-Glut (left) applications (high-variance spots represent repeatedly responding regions, that is, hotspots). d, Individual responses to six CNO applications. e, Traces corresponding to two hotspot regions in d (indicated by asterisks; white line, 2z; azure, 240 ms post-puff period). fi, SF-iGluSnFR responses to endogenous P2Y1R stimulations in a representative astrocyte. f, Experiments in WT mice expressing SF-iGluSnFR in astrocytes. g, s.d. projection of SF-iGluSnFR signal variance across six applications of the P2Y1R agonist 2MeSADP (right) or l-Glut (left). h, Individual responses to six 2MeSADP applications. i, Traces corresponding to two hot spot regions. Details are as described in e. jl, Lack of SF-iGluSnFR responses to CNO in a representative astrocyte with deleted VGLUT1 (VGLUT1GFAP-KO). j, Slc17a7fl/fl mice were injected with viral vectors inducing SF-iGluSnFR and Gq-DREADD expression, and iCre-mediated VGLUT1 deletion in triple-fluorescent astrocytes. k, Mean projections of Gq-DREADD–mCherry (top left) and nuclear iCre–eBFP2 (top right) expression, and s.d. projections of SF-iGluSnFR signal variance across six CNO (bottom right) or l-Glut (bottom left) applications. l, Individual responses to six CNO applications. mo, A lack of SF-iGluSnFR responses to 2MeSADP in a representative astrocyte with deleted P2y1r (P2Y1RGFAP-KO). m, GlastcreERT2P2ry1Rfl/fl mice were injected with viruses to express SF-iGluSnFR and induce iCre-mediated P2y1r deletion in astrocytes. n, Mean projection of iCre–mCherry expression (top) and s.d. projection of SF-iGluSnFR signal variance across six 2MeSADP (bottom right) and l-Glut (bottom left) applications. o, Individual responses to 2MeSADP applications. For c,d,g,h,k,l,n and o, the z-score scale is colour-coded from 0 (dark blue) to 6 (red). p,q, Quantitative analysis of SF-iGluSnFR responses to drugs in DGML astrocytes. p, The proportion of astrocytes responding to (1) CNO in WT (23 cells, 5 mice) and VGLUT1GFAP-KO (24 cells, 5 mice) mice; and (2) 2MeSADP in WT (18 cells, 2 mice) and P2Y1RGFAP-KO (20 cells, 2 mice) mice. All individual cell responses are shown in Extended Data Fig. 6. q, Features of SF-iGluSnFR responses evoked by CNO (WT, n = 9 out of 24 cells; VGLUT1GFAP-KO, n = 3 out of 24 cells) and 2MeSADP (WT, n = 6 out of 18 cells; P2Y1RGLAST-KO, n = 0 out of 20 cells). Top, the percentage of l-Glut-responding FOVs that respond to CNO or to 2MeSADP (the same mouse groups as in p). The number (middle) and area (bottom) of individual hotspots per FOV for CNO and 2MeSADP are shown. r, Schematic of in vivo two-photon SF-iGluSnFR glutamate imaging experiments in the visual cortex of awake mice in the presence of synaptic blockers (details are provided in s and v and the Methods). su, SF-iGluSnFR responses to Ach in a representative astrocyte (110 µm below the surface). s, Experiments in WT mice injected with virus to express SF-iGluSnFR in visual cortex astrocytes. t, The red SR-101 signal highlights the astrocyte in the FOV (top). Bottom, cumulative SF-iGluSnFR fluorescence throughout the acquisition from the same astrocyte (n = 8 cells, 3 mice). u, 50 selected ROIs (top left) (Methods), the peak frequency variations of SF-iGluSnFR signal in individual ROIs (colour scale: white (+0.25 Hz) to black (−0.1 Hz)) (top middle) and the mean frequency change in the 50 ROIs (top right) after Ach (10–50 mM) application (Wilcoxon rank-sum test, **P = 0.0059). Bottom left, SF-iGluSnFR traces from a representative ROI (asterisk in the top middle image), before and after (yellow) the Ach puff; the arrowheads indicate SF-iGluSnFR activity peaks. Bottom middle, the averaged kinetics of SF-iGluSnFR events from the bottom left plot, aligned to peak time. Bottom right, hotspot ROIs responding to two Ach applications. vx, SF-iGluSnFR responses to chemogenetic stimulation in a representative astrocyte (137 µm below the surface). v, Experiments in mice expressing SF-iGluSnFR and Gq-DREADD in visual cortex astrocytes. w, Mean projection of Gq-DREADD–mCherry expression (top). Bottom, cumulative SF-iGluSnFR fluorescence throughout the acquisition from the same astrocyte as in t (n = 11 cells, 3 mice). x, As described in u, but for CNO (0.1–1 mM) infusion. Note the mean frequency change of 50 ROIs after CNO (top right) (Wilcoxon rank-sum test, **P = 0.0282). Bottom right, hotspot ROIs responding to two CNO applications. y, The mean peak frequency changes in SF-iGluSnFR signal after stimulus (Ach, CNO or ACSF) in responding and non-responding astrocytes (individual data are shown in Extended Data Fig. 7g). Scale bars, 10 µm (a,c,d,g,h,k,l,n,o,t,u,w and x). Source data
Fig. 3
Fig. 3. VGLUT1 deletion in astrocytes leads to changes in LTP, memory and acute seizure patterns in the cortico-hippocampal circuitry.
a, The breeding scheme for generating astrocyte-specific conditional VGLUT1 mice (VGLUT1GFAP-KO after TAM-induced cre recombination) and the related controls: VGLUT1GFAP-WT mice controlling for cre leakage, and VGLUT1WT-TAM mice controlling for TAM-induced cre-unrelated effects (Methods). b, Validation of Slc17a7 locus genetic deletion (Δ band) in whole-brain homogenates (2 mice per group) and FACS-sorted astrocytes (2 independent experiments, 5 mice per group) from VGLUT1GFAP-KO mice. c, Representative images (n = 2) showing cre-recombination reporter expression (tdTomato), astrocyte labelling (combined GS and S100β) and nuclear staining in the DGML of VGLUT1GFAP-KO mice. The overlay shows reporter co-localization with astrocytes. Scale bar, 50 µm. d, The experimental paradigm for generating sparse VGLUT1GFAP-KO astrocytes (Astro-tdTom+, left) and comparatively studying the ϴ-LTP in two neighbouring DGML synaptic fields containing an Astro-tdTom+ and a WT (Astro) astrocyte (right; Extended Data Fig. 9e). e, Representative fEPSP traces and the time-course of the fEPSP slope before and after ϴ-LTP induction (arrow) in synaptic field pairs containing Astro versus Astro-tdTom+ (16 slices, 12 mice) (bottom). The mean LTP was lower in Astro-tdTom+ fields (two-tailed paired t-test; *P = 0.044). f, The normalized ϴ-LTP magnitude of individual pairs in e (two-tailed paired t-test; *P = 0.044). g, The experimental paradigm and timeline of mouse treatments and behavioural testing (Methods). h,i, The contextual fear conditioning test was performed in VGLUT1GFAP-KO (n = 10), VGLUT1GFAP-WT (n = 11) and VGLUT1WT-TAM (n = 10) mice. h, Mice were exposed to an activity test (AT) followed by contextual fear conditioning. All mouse groups showed comparable learning (two-way analysis of variance (ANOVA) with Fisher’s least significant difference (LSD) test; P = 0.60). i, Fear expression was evaluated 24 h and 48 h after the conditioning test: VGLUT1GFAP-KO mice show reduced performance compared with the control mice (two-way ANOVA with Fisher’s LSD test; *P =0.0101 (24 h), ***P = 0.0007 (24 h), *P = 0.0215 (48 h)). j, The experimental paradigm and the timeline of mouse treatments, electroencephalogram (EEG) recordings and induction of acute seizures (Methods). k, Representative EEG traces of seizures recorded from a VGLUT1GFAP-WT and a VGLUT1GFAP-KO mouse after injection of kainic acid (KA, 10 mg per kg). lp, Seizure parameters were analysed in VGLUT1GFAP-KO (n = 7), VGLUT1GFAP-WT (n = 6) and VGLUT1WT-TAM (n = 7) mice. Analysis of the specific differences between VGLUT1GFAP-KO and the control mice on the basis of the time to the first seizure (l); the total seizure number per mouse (one-way ANOVA with Tukey’s test; **P = 0.0083, *P = 0.0120) (m); the time from first to last seizure (n); individual seizure length (o); and the inter-ictal duration (Kruskal–Wallis with Dunn’s test; *P = 0.0232) (p). Source data
Fig. 4
Fig. 4. VGLUT2 deletion in astrocytes alters nigrostriatal circuit function in situ and DA levels in vivo.
a, The breeding scheme for generating astrocyte-specific conditional VGLUT2 mice and related controls (details as in Fig. 3a, but for VGLUT2). b, The experimental paradigm and timeline of mouse treatments for electrophysiology recordings (left). Right, schematic of midbrain slices showing the STN, SNpc and substantia nigra pars reticulata (SNpr) with the position of the stimulating and recording electrodes. c, sEPSCs recorded in SNpc DA neurons of VGLUT2GFAP-KO (15 cells, 6 mice), VGLUT2GFAP-WT (20 cells, 7 mice) and VGLUT2WT-TAM (13 cells, 5 mice) mice. Representative current traces (left), and histograms showing, in VGLUT2GFAP-KO mice, increased sEPSC frequency (middle; one-way ANOVA with Tukey’s test; **P = 0.00187 (bottom), **P = 0.00233 (top)) and unchanged amplitude compared with the controls (right). d, Group III mGluR agents differently affect sEPSCs in VGLUT2GFAP-KO mice compared with the control mice (two-tailed paired t-test). The histograms show the percentage change induced by group III mGluR agonist l-SOP (10 μM) and antagonist MSOP (10 μM) on the baseline sEPSC frequency (left) and amplitude (right) in VGLUT2GFAP-KO mice (l-SOP: 12 cells, 5 mice, ***P = 0.0005; MSOP: 8 cells, 3 mice) and VGLUT2GFAP-WT mice (l-SOP: 10 cells, 5 mice; MSOP: 7 cells, 4 mice; **P = 0.0041, *P = 0.024). e, EPSCs evoked in SNpc DA neurons by STN stimulation in VGLUT2GFAP-KO (24 cells, 7 mice), VGLUT2GFAP-WT (19 cells, 7 mice) and VGLUT2WT-TAM (12 cells, 5 mice) mice. Left, representative traces of paired pulse-evoked EPSCs. Right, histograms showing a reduced PPR in VGLUT2GFAP-KO mice compared with in the control mice (one-way ANOVA with Fisher’s test; *P = 0.020 (top), *P = 0.023 (bottom)). f, Differential effects (expressed as the percentage change versus the control) induced by group III mGluRs agents on PPR in VGLUT2GFAP-KO (l-SOP: 10 cells, 4 mice; ***P = 0.00065; MSOP: 6 cells, 4 mice) compared with in VGLUT2GFAP-WT (l-SOP: 10 cells, 5 mice; **P = 0.0079; MSOP: 6 cells, 4 mice; *P = 0.038) mice. Statistical analysis was performed using two-tailed paired t-tests. g, The experimental paradigm and timeline of mouse treatments for in vivo microdialysis measures of DA levels in the dST. h, The baseline DA levels in VGLUT2GFAP-KO mice (n = 12) compared with in VGLUT2GFAP-WT mice (n = 13; Kolmogorov–Smirnov test; *P = 0.039). For the box plots, the box limits show the 25th to 75th percentiles, the centre lines are medians, and the whiskers show the minimum to maximum values. i, Time course of DA levels after amphetamine challenge (AMPH, 2 mg per kg; arrow). The DA levels were significantly (Friedman ANOVA with Wilcoxon signed rank test) increased only at 40 min in VGLUT2GFAP-WT mice (*P = 0.0175), whereas DA levels were significantly increased at 20, 40, 60, 80, 100 and 120 min in VGLUT2GFAP-KO mice (##P = 0.00253, ##P = 0.00253, ##P = 0.0025, ##P = 0.0042, #P = 0.010, #P = 0.03, respectively). The amphetamine-induced increase was higher in VGLUT2GFAP-KO mice compared with in VGLUT2GFAP-WT mice at any tested time (Kolmogorov–Smirnov test; ***P = 0.00049, **P = 0.009, ***P = 0.00049, **P = 0.00231, **P = 0.00913, **P = 0.00231). All data are mean ± s.e.m. Source data
Extended Data Fig. 1
Extended Data Fig. 1. Single-cell mouse hippocampus integrated database: clusters and cell types prediction.
a, Single-cell mouse hippocampus datasets used to create the integrated database. Notice that studies generating individual datasets present relevant biological (age of mice, hippocampal region) and/or methodological (dissociation methods, chemistry, platform, enrichment strategies) differences among them. b, UMAP representation of 8 integrated hippocampus scRNA-seq datasets labelled by dataset. c, Cluster analysis revealed 15 transcriptionally distinct clusters (clustering resolution = 0.1). d, Integrated hippocampus database coloured by cell type prediction. e, Deep neural network multiclass model trained on a comprehensive database at “subclass level”. Top, Accuracy and loss value after each epoch for training and validation data; Bottom, confusion matrix showing cell prediction for validation data. f, We performed cross-validation by removing each individual dataset one at a time and running the prediction and clustering using the others, then calculated the overall prediction efficiency. This showed the accuracy, sensitivity, and specificity of our model. Data are shown as box plot (25–75 percentile with median) with min to max whiskers excluding outliers. g, Expression levels for canonical astrocytic markers in the integrated hippocampus database.
Extended Data Fig. 2
Extended Data Fig. 2. Characteristics of the distinct astrocyte transcriptional clusters and presence of cluster 7 glutamatergic astrocytes in all the hippocampal regions.
a, UMAP representation of subset astrocytes labelled by transcriptionally distinct clusters (clustering resolution = 0.4, left) or datasets (right). b, Heatmap showing the total number of astrocytes for each dataset and each cluster. Noteworthy, cluster 7 was found in all interrogated hippocampal databases. c, Expression of the top 5 enriched genes per astrocyte cluster (see also Supplementary Table 2). dg, Expression intensity per astrocyte cluster and corresponding dot plot for selected canonical astrocytic (d,e), vesicular trafficking, regulated exocytosis and glutamatergic pre-synaptic function markers (f,g). h, Heatmap showing the percent of cells in each cell cycle phase for each astrocytic cluster. i, Expression level per astrocyte cluster for Ifitm3, Vim, Megf10 and Merkt. j, High-magnification images of examples of glutamatergic astrocytes in various regions of the hippocampus: DGML: molecular layer of the dentate gyrus; Hilus: Hilus region of the dentate gyrus, CA3-RAD: stratum radiatum of the CA3 region, CA3-OR: stratum oriens of the CA3 region; CA1-RAD: stratum radiatum of the CA1 region, CA1-OR: stratum oriens of the CA1 region. The visualization was achieved using a combination of immunohistochemistry for tdTomato (Tom, red), GS/S100β (green), and DAPI (white) and fluorescent in situ hybridization for Slc17a7 (yellow), Slc17a6 (violet), Snap25 (blue), and Syt1 (pink). n = 12 slices, 2 mice. Scale bar: 10 µm.
Extended Data Fig. 3
Extended Data Fig. 3. Top 10 biological processes ontology enrichment for each astrocyte cluster.
The red dashed line indicates the threshold for significant enrichment in these gene ontologies.
Extended Data Fig. 4
Extended Data Fig. 4. Additional data related to the glutamate imaging studies in situ presented in Fig. 2.
a, 6 mean projections showing the individual SF-iGluSnFR responses to 6 L-Glut puffs onto the same FOV as the wild-type CNO-responder shown in Fig. 2c–e. Each image is a pixel-by-pixel map of the SF-iGluSnFR signal after the L-Glut application. Amplitude of the responses in individual pixels is expressed in z-scores scale and colour coded, going from 0 (dark blue) to 6 (red). Note the responsiveness of most of the FOV. b, 6 mean projections showing the individual SF-iGluSnFR responses to 6 L-Glut puffs onto the same FOV as the wild-type 2MeSADP-responder shown in Fig. 2g–i. c, Validation of VGLUT1 deletion in astrocytes (VGLUT1GFAP-KO); Top left, strategy to obtain cre-mediated VGLUT1 deletion in astrocytes through injection of AAV5-hGFAP::EBFP2iCre into the hippocampus of Slc17a7fl/fl mice. The whole-brain image is from the Allen Mouse Brain Connectivity Atlas (https://mouse.brain-map.org/). Right, top, validation by genomic PCR revealing Slc17a7 locus deletion (Δ band in all gels) in brains of virally-injected and not injected Slc17a7fl/fl mice (n = 2 independent biological brain samples per group), or in cre-positive, blue-fluorescent DGML astrocytes individually collected with a patch pipette (n = 2 cells, 1 mouse). Bottom, co-labelling of cre-expressing cells (yellow, false colour for EBFP2-expressing, blue-fluorescent cells) with S100β (cyan) and GS (magenta) astrocytic markers. Scale bar: 5 µm. d, 6 mean projections showing the individual SF-iGluSnFR responses to 6 L-Glut puffs onto the same FOV as the VGLUT1GFAP-KO not responding to CNO shown in Fig. 2k,l. e, 6 mean projections showing the individual SF-iGluSnFR responses to 6 L-Glut puffs onto the same FOV as the P2Y1RGFAP-KO not responding to 2MeSADP shown in Fig. 2n,o. f, Proportion of the imaged FOV responding to sequential L-Glut administrations after either CNO or 2MeSADP administrations for all the tested cells in the mouse groups as in Fig. 2p. Responses to L-Glut in VGLUT1GFAP-KO or P2Y1RGFAP-KO mice do not differ from those in wild-type mice. Data presented as mean ± s.e.m. WT, n = 23 cells, 5 mice; VGLUT1GFAP-KO mice, n = 24 cells, 5 mice. 2MeSADP-stimulated astrocytes: WT, n = 18 cells, 2 mice; P2Y1RGFAP-KO, n = 20 cells, 2 mice. gi, Example of a wild-type CNO non-responder; g, viral injections as in Fig. 2b. h, Left, mean projection showing Gq-DREADD-mCherry expression pattern, resembling the one seen in CNO-responders (Fig. 2c). Middle, Standard deviation (s.d.) projection displaying the signal variance across 6 CNO stimulations, showing no CNO-evoked SF-iGluSnFR response. Right, S.d. projection showing reliable responses to L-Glut applications for the same FOV. i, 6 mean projections showing the individual SF-iGluSnFR responses to 6 CNO puffs in the same cell as in h. Each image is a pixel-by-pixel colour-coded z-score map of the SF-iGluSnFR signal in the FOV during the 240s before and after the CNO application. j-l, Example of a wild-type 2MeSADP non-responder; j, viral injections as in Fig. 2f; k, Left, S.d. projection displaying the signal variance across 6 2MeSADP stimulations, showing no 2MeSADP-evoked SF-iGluSnFR response. Right, S.d. projection showing reliable responses to L-Glut application for the same FOV. l, 6 mean projections showing the individual SF-iGluSnFR responses to 6 2MeSADP puffs in the same cell as in k. Details as in panel i. m-o, Example of a VGLUT1GFAP-KO astrocyte classified as CNO responder (n = 3/24 cells); m, mouse line and viral treatments as in Fig. 2j; n, Images from left to right: (i) mean projection showing Gq-DREADD-mCherry expression pattern (magenta); (ii) mean projection showing EBFP2-iCre expression (blue) within the same FOV; (iii) S.d. projection displaying the signal variance across 6 CNO stimulations, showing some SF-iGluSnFR response to CNO; (iv) S.d. projection showing reliable responses to L-Glut application for the same FOV. o, 6 mean projections showing the individual SF-iGluSnFR responses to 6 CNO puffs in the same cell as in n. Details as in panel i. Responses are smaller than in CNO responder cells from wild-type mice: quantitative comparison in Fig. 2q Source data
Extended Data Fig. 5
Extended Data Fig. 5. Generation of binarized functional maps of stimulus-evoked SF-iGluSnFR responses and additional experiments related to chemogenetic activation of astrocytes in situ.
ah, Description of the analytical pipeline used to quantify SF-iGluSnFR responses. a, 6 epochs corresponding to short periods before or after drug applications (240 ms after CNO in this example) were used as input for the analytical pipeline. For each epoch, we generated an image representing the pixel-by-pixel colour-coded z-score mean projection map of the SF-iGluSnFR signal in the FOV for the period. b, For each of the epochs, we segmented the FOV by a 32 x 32 grid, in which each of the 1024 spaces represented a 1.13 µm x 1.13 µm ROI. c, As an example, we show at higher magnification the z-scored SF-iGluSnFR signal for epoch 1 in the region of 36 ROIs framed in b. d, To continue the example, we then focus on two nearby individual ROIs (* and **) within this framed region, and perform peak detection across the 6 rounds of CNO application. e, Left, Traces show 6/6 suprathreshold (>2 z-scores) responses to CNO in ROI (*) and only 2/6 in ROI (**). Peak detection is similarly performed in all 1024 ROIs of the 32x32 grid, counting the number of responses to CNO application (maximum of 6) within each ROI to generate a colour-coded map of the entire 37.3 x 37.3 µm FOV, going from yellow ROIs (6/6 suprathreshold responses like in ROI *) to dark blue ROIs (0/6 responses). Right, example of the colour-coded map in the magnified region of 36 ROIs. f, The low-magnification view of the colour-coded map for the entire 37.3 x 37.3 µm FOV, with magnified region in the white square, allows to visually appreciate the ROIs most consistently responding to CNO. g, The same analytical steps used for segmentation and peak detection of the SF-iGluSnFR responses to CNO were applied to the responses evoked by 6 applications of L-Glut in the same FOV. Left: while most ROIs reliably responded to L-Glut application (>4 suprathreshold peaks; not shown), a few of them did not (here depicted as magenta ROIs) and were subtracted from the CNO map to generate a new grid map (Right) containing only CNO responsive ROIs also reliably responsive to L-Glut application. This step helped eliminating false positive, ensuring that the CNO-evoked SF-iGluSnFR response came from a location capable of reliably detecting L-glutamate. h, Left, binarized map of the grid map from panel g Right. ROIs with ≥4 CNO-evoked SF-iGluSnFR responses were assigned a value of 1 (yellow) and those with ≤3 responses were assigned a value of 0 (purple). Right, we grouped clusters of suprathreshold recurrently active ROIs (yellow) based on 8-neighbour connectivity (all edges and corners) and excluded active clusters containing <4 ROIs by spatial filtering (see Methods). The final binarized functional map, containing only active clusters (“hotspots”) with ≥4 neighbours, was used to calculate hotspots number and areas. i-j, CNO-dependent Gq-DREADD stimulation evokes Ca2+ elevations in all the tested astrocytes. i, Left, timeline of the experiments: TAM-inducible GFAPcreERT2GCaMP6ffl/fl mice were unilaterally injected with AAV5-hGFAP::hM3D(Gq)-mCherry virus. After 3 days mice received TAM administration for 3 days and after 4 weeks two-photon Ca2+ imaging was performed. Right, representative fluorescence image of an astrocyte FOV (red: hM3D(Gq); green: GCaMP6f). (n = 2 mice). j, Traces of cytosolic GCaMP6f Ca2+ responses in the ROI (whole astrocyte) for each tested astrocyte (n = 10 cells) in response to a single puff of CNO (100 µM) expressed in z-scores of the raw GCaMP6f signal. Note large Ca2+ elevation in all CNO-stimulated astrocytes. Each trace is accompanied by ROI display as perceptually uniform ‘magma’ colormap. Scale bar: 5 µm. k, Stimulation with vehicle does not reproduce the glutamate-releasing effect of CNO in Gq-DREADD-expressing astrocytes: top, wild-type mice (n = 2) were unilaterally injected in hippocampus with AAV5-hGFAP::SF.iGluSNFR(A184S) and AAV5-hGFAP::hM3D(Gq)-mCherry viruses. Bottom, Binarized functional maps of vehicle- and L-Glut-evoked SF-iGluSnFR responses of 5 individual astrocyte FOVs. In none of them, vehicle induced a significant response, while in all of them L-glut elicited the usual large response. Scale bar: 5 µm. l, CNO does not evoke glutamate release in astrocytes expressing an mCherry scrambled virus instead of Gq-DREADD. Top, wild-type mice (n = 2) were unilaterally injected in hippocampus with AAV5-hGFAP::SF.iGluSNFR(A184S) and AAV5-hGFAP::mCherry viruses. Bottom, binarized functional maps of CNO- and L-Glut-evoked SF-iGluSnFR responses of 5 individual astrocyte FOVs. CNO never evoked a significant response, whereas L-Glut always did. Scale bar: 5 µm.
Extended Data Fig. 6
Extended Data Fig. 6. Astrocyte SF-iGluSnFR responses evoked by chemogenetic or endogenous Gq-GPCR activation and by L-Glutamate in all tested astrocytes from wild-type, VGLUT1GFAP-KO and P2Y1RGFAP-KO mice.
ad, Chemogenetic astrocyte Gq-GPCR activation with CNO in wild-type (a,b) and VGLUT1GFAP-KO (c,d) mice. a, Top, schematic of the viral treatments in wild-type mice; Middle and Bottom, matched CNO- and L-Glut-evoked SF-iGluSnFR fluorescence responses (brown) in wild-type mice expressed as binarized functional maps for each individual astrocyte FOV (24 FOVs, n = 5 mice). Middle, individual FOVs with ≥5% CNO-responsive area within the L-Glut-responsive area were classified as responders (Methods; mean response: 15.12 ± 2.35%, n = 9). Bottom, FOVs with subthreshold responses or without response at all were collectively classified as non-responders (mean response: 0.84 ± 0.37%, n = 15). Responses to L-Glut were analogous in CNO-responding and non-responding astrocytes (77.77 ± 2.2% and 77.63 ± 4.7% of the total FOV, respectively). Scale bars: 5 µm. b, Mean kinetics ± s.e.m. (azure halo) of CNO- and L-Glut-evoked SF-iGluSnFR responses in wild-type mice. For CNO: rise-time10–90: 93.08 ± 9.56 ms; full-width half-maximum (FWHM): 445.20 ± 57.34 ms; decay time: 352.10 ± 51.21 ms; ≥29 traces from 12 ± 2 responding grid locations from 9 FOVs; For L-Glut: >100 traces from 9 FOVs. c, Top, schematic of the viral treatments in Slc17a7 fl/fl mice; Middle and Bottom, matched CNO- and L-Glutamate (L-Glut-)-evoked SF-iGluSnFR fluorescence responses (orange) as in a but in VGLUT1GFAP-KO mice (23 FOVs, n = 5 mice); d, Mean kinetics ± s.e.m. of CNO- and L-Glut-evoked SF-iGluSnFR responses as in b but in VGLUT1GFAP-KO mice. For CNO: rise-time10–90: 84.42 ± 16.04 ms; FWHM: 350.90 ± 45.66 ms; decay time: 266.5 ± 29.96 m; 11 ± 1 grid locations from 3 FOVs for both CNO and L-Glut responses. eh, Activation of the endogenous Gq-GPCR P2Y1R with 2MeSADP in wild-type (e,f) and P2Y1RGFAP-KO (g,h) mice. e, Top, schematic of the viral treatments in wild-type mice; Middle and Bottom, matched 2MeSADP- and L-Glut-evoked SF-iGluSnFR fluorescence responses (dark green) in wild-type mice expressed as binarized functional maps for each individual astrocyte FOV (18 FOVs, n = 2 mice). 2MeSADP-responder (Middle) and non-responder (Bottom) FOVs classified as in a. For responses to 2MeSADP see Fig. 2p,k; and to L-Glut, Extended Data Fig. 4f. Scale bars: 5 µm. f, Mean kinetics ± s.e.m. (azure halo) of 2MeSADP- and L-Glut-evoked SF-iGluSnFR responses in wild-type mice. For 2MeSADP: rise-time10–90; 96.78 ± 17.53 ms; FWHM: 400.39 ± 42.98 ms; decay time: 303.61 ± 30.56 ms; ≥32 traces from 7 ± 1 grid locations from 6 FOVs). For L-Glut: >100 traces from 6 FOVs. g, Top, schematic of the viral treatments in GLASTcreERT2P2y1fl/fl mice; Middle and Bottom: matched 2MeSADP- and L-Glut-evoked SF-iGluSnFR fluorescence responses (light green) as in e but in P2Y1RGFAP-KO mice (20 FOVs, n = 2 mice). h, Mean kinetics ± s.e.m. of L-Glut-evoked SF-iGluSnFR responses as in f but in P2Y1RGFAP-KO mice (>100 traces from 10 FOVs). For 2MeSADP no kinetics of evoked responses are shown because no 2MeSADP-responder FOV was observed in P2Y1RGFAP-KO mice.
Extended Data Fig. 7
Extended Data Fig. 7. Astrocyte SF-iGluSnFR responses in awake mice recorded with fibre photometry in hippocampus and two-photon imaging in visual cortex, with additional information to Fig. 2.
a, Experimental paradigm for in vivo fibre photometry SF-iGluSnFR fluorescence measurements and local drug delivery through optofluid cannula positioned in the dorsal hippocampus, above DG. The whole-brain image is from the Allen Mouse Brain Connectivity Atlas (https://mouse.brain-map.org/). b, Top, viral injections for astrocyte expression of SF-iGluSnFR and Gq-DREADD in wild-type mice. Bottom, left: time course of averaged SF-iGluSnFR fluorescence responses to vehicle (black) and CNO (2.5 mM, brown), both in the presence of synaptic blockers mixture (Methods, n = 5 mice). Traces are aligned to the cannula plug (dotted line) and drug injection time (blue bar). Data are normalized to baseline and presented as mean ± s.e.m. Right, Normalized SF-iGluSnFR maximal fluorescence values in individual pairs at 3 minutes after application of vehicle and CNO. Lines represent mean ± s.e.m. (vehicle, black, mean: 97.5 ± 0.47; CNO, brown, mean: 100.4 ± 0.94). (*P = 0.02, two-tailed paired t test). c, Visual cortex UMAP representation of 1 mouse, 1 macaque and 1 human integrated visual cortex scRNA-seq datasets (Methods) annotated with a neural network classifier trained on a comprehensive database and subset for astrocyte population. Blue cells show the distribution of predicted cluster 7 according to the astrocyte reference annotation from the integrated astrocytic database in Fig. 1b. df, Two-photon imaging in vivo of the spontaneous SF-iGluSnFR activity in the visual cortex of the awake mouse before and after topical infusion of a synaptic blockers mixture (Methods). (n = 12 FOVs, 6 mice). d, Experiments performed in wild-type mice injected with AAV5-GFAP::SF.iGluSNFR(A184S) in the visual cortex e, Top, left to right: (i) mean projection of the SF-iGluSnFR fluorescence signal in a representative large FOV (151 µm x 151 µm) containing multiple astrocytes (137 µm below surface); scale bar: 50 µm. (ii) Effect of the synaptic blockers: left: traces (grey, original; black, filtered) of mean SF-iGluSnFR activity from all ROIs in the FOV during the 60s acquisition before incubation with synaptic blockers (before); arrowheads point to identified SF-iGluSnFR activity peaks based on peak duration and z-score (Methods). Right, traces (grey, original; violet, filtered) and SF-iGluSnFR activity peaks detected after incubation with synaptic blockers (after). Bottom, from left to right: (i) mean projection of the SF-iGluSnFR fluorescence signal in a representative small FOV (37.5 x 37.5 µm) containing in this case a single astrocyte (137 µm below surface); scale bar: 10 µm. (ii) Effect of the synaptic blockers: descriptive as in top part of the panel. n = 12 FOV, 6 mice. f, Summary reporting SF-iGluSnFR mean peak frequency before (grey,: mean: 0.75 ± 0.04 Hz) and after infusion of synaptic blockers (violet: 0.29 ± 0.03 Hz) for each tested FOV. The effect of synaptic blockers was significant in all FOVs (Wilcoxon rank sum test, two sided, **P = 0.0025 n = 12 FOV from 6 mice). Blockers mainly suppressed synchronized activity between cells and between ROIs within a cell, likely representing coordinate neuronal glutamate release responses to inherent patterns of cortical activity and inputs from other regions. g, SF-iGluSnFR signal responses to Ach, CNO or ACSF in all astrocytes investigated in vivo in the visual cortex in 37.5 x 37.5 µm FOVs in the presence of synaptic blockers. Astrocytes are regrouped as responders or non-responders to the stimulus (Methods). For each astrocyte and for each stimulus is presented a colour-coded spatial map of the ROIs in the FOV displaying increased peak frequency upon stimulus application. The colour scale represents intensity of frequency increase above baseline, from 0 (pink) to 0.25 Hz (yellow); scale bar: 10 µm. Source data
Extended Data Fig. 8
Extended Data Fig. 8. Patch-seq experiments on individual DGML astrocytes: astrocyte clusters prediction from scRNAseq and from combined glutamate imaging and transcriptomic information.
a,b, Patch-seq experiment on DGML astrocytes: workflow of the experimental procedure. a, Left, patch-seq in red-fluorescent astrocytes expressing tdTomato from GFAPcreERT2tdTomlsl/lsl mice. Right, patch-seq preceded by SF-iGluSnFR imaging in astrocytes virally injected to express GqDREADD-mCherry and SF-iGluSnFR. Stimulations with CNO and L-Glut are like in Fig. 2a–e. The whole-brain image is from the Allen Mouse Brain Connectivity Atlas (https://mouse.brain-map.org/). b, schematic representation of the patch-seq procedure. c, Representative tdTomato-positive astrocyte before and after cell body collection by gentle aspiration (n = 65 cells), here imaged with two-photon microscope (n = 2 cells; see also Supplementary Video 2). d, Electrophysiological properties of individual patch-seq astrocytes recorded before collection: all cells showed linear current/voltage (I/V) curve, low input resistance and very negative membrane potential typical of astrocytes. e, UMAP representation of 85 patch-seq astrocytes predicted according to astrocyte reference annotation (cluster 0 to cluster 8 from integrated astrocytic database) and pie-chart distribution of the patch-seq astrocytes among each predicted cluster. Number of cells predicted per cluster were: cluster 0: 7; cluster 1: 1; cluster 2: 39; cluster 3: 0; cluster 4: 2; cluster 5: 8; cluster 6: 0; cluster 7: 28; cluster 8: 0. f, Top, Dot plot of selected marker genes related to astrocyte identity, vesicular trafficking, and glutamate regulated exocytosis for predicted cluster 7; Bottom, expression level for Slc1a2, Slc17a7 and Slc17a6 in the predicted astrocyte clusters. Note Slc17a7 and Slc17a6 enrichment in cluster 7. Noteworthy, cells assigned to cluster 7 had electrophysiological properties within the average of the whole patch-seq population (resting membrane potential: −79.4 ± 0.87 mV; input resistance: 9.9 ± 0.32 MΩ; linear I/V curve). g, Binarized functional maps of the SF-iGluSNFr signal response to CNO and L-Glut applications for the four astrocytes functionally identified as “responder” (brown), and for four representative astrocytes identified as “non responder” (sand), associated with the cluster prediction for each individual cell. h, Top, UMAP representation of the predicted cluster 7 for “responder” and “non responder” astrocytes, according to the astrocyte reference annotation from the integrated astrocytic database in Fig. 1b. Bottom, corresponding histogram quantification showing statistical significance (two tails Fisher exact test, P = 0.0320) for correct prediction of cluster 7 for “responder” astrocytes and of other clusters for “non responder” astrocytes. Overall, 3 out of 4 responders were correctly attributed to cluster 7, and one to cluster 2. Of the 16 non-responders, 14 were correctly attributed to non-glutamatergic clusters (9 to cluster 2; 3 to cluster 4 and 2 to cluster 5) and two to cluster 7.
Extended Data Fig. 9
Extended Data Fig. 9. Additional data related to the GFAPcreERT2Slc17a7fl/fltdTomlsl/lsl mouse model, the electrophysiology and the behavioural studies presented in Fig. 3.
a, Representative fluorescence activated cell sorting (FACS) of tdTomato-positive (Tom+) astrocytes in cerebral cortex samples of VGLUT1GFAP-WT mice (sorted ≥2 x 105 Tom+ cells per experiment, n = 2 independent experiments, 5 mice per experiment), VGLUT1GFAP-KO mice (sorted ≥2 x 105 Tom+ cells per experiment, n = 2 independent experiments, 5 mice per experiment) and GFAPCreERT2tdTomlsl/lsl mice (sorted ≥2 x 105 Tom+ cells per experiment, n = 2 independent experiments, 5 mice per experiment). b, Representative images, here acquired with confocal microscope (n = 2), confirming no leakage in the absence of TAM-induced cre recombination, i.e., lack of any Tom+ cells (red) in the hippocampus of VGLUT1GFAP-WT and VGLUT1WT-TAM control mice also stained with the astrocyte markers GS and S100β (green), and the nuclear marker, DAPI (blue), n = 8 images from 4 independent experiments, 2 mice per group. Scale bar: 50 µm.c, Left, table presenting the total number per mm2 of Tom+ cells and the relative numbers of the same Tom+ cells co-labelled with astrocyte (GS+S100β), neuron (NeuN), oligodendrocyte (Olig2) or microglia (Iba1) markers, counted in two hippocampal regions (CA1 and DG) and in the visual cortex of VGLUT1GFAP-KO mice upon TAM-induced cre recombination. Data are presented as means ± s.e.m. Right, Confocal images confirming lack of any co-labelling of Tom+ cells with microglia (Iba1, green) oligodendrocyte (Olig2, white) or neuronal (NeuN, green) markers in the DG of VGLUT1GFAP-KO mice. n = 8 images from 4 independent experiments, 2 mice per group. Scale bar: 50 µm. d, ϴ-LTP recorded in DGML of wild-type mice by 3 local field potential (LFP) electrodes positioned along the same bundle of PP fibres at an average distance of 200 µm (electrode 1), 300 µm (electrode 2) and 400 µm (electrode 3) from the stimulation pipette (STIM). ϴ-LTP magnitude is the same at all tested locations (two-way ANOVA repeated measures (P = 0.78, n = 6 slices, 3 mice). Data are means ± s.e.m. e, Setting for ϴ-LTP induction and measure in GFAPcreERT2Slc17a7fl/fltdTomlsl/lsl mice undergone short TAM treatment (Methods). Top, bright-field (BF) and fluorescence images (Tom) show positioning of the stimulation pipette (STIM) and of the two LFP recording electrodes in the DGML, with about 200 µm interdistance. Scale bar: 200 µm. Bottom, higher zoom images show the position of electrode 1, proximal to a non-fluorescent astrocyte (astro), and of electrode 2, proximal to a fluorescent astrocyte (astro Tom+). n = 16 slices, 12 mice. Scale bar: 50 µm. f, Basal input-output curves (left) and basal fEPSP amplitudes (right) recorded in two DGML fields containing, respectively, a VGLUT1GFAP-WT (grey) and a VGLUT1GFAP-KO astrocyte (orange), show no significant differences (data mean ± s.e.m.; paired Student’s t test, two tails, P = 0.337). Thin lines connect individual LFP electrode pairs (n = 16 slices, 12 mice). gl, Astrocyte Ca2+ dynamics during low and high-frequency stimulation of MPP in VGLUTGFAP-WT and VGLUT1GFAP-KO mice. g, Top, in control experiments, Slc17a7fl/f mice are injected with AAV5-GFAP-mCherry virus (control virus) and AAV5-GFAP-GCaMP6f virus to report astrocyte Ca2+ dynamics. Bottom, multiple astrocytes present in the same FOV as in h and i display both mCherry (red) and GCaMP6f (green) fluorescence. Scale bar: 50 µm. n = 2 FOVs, 2 mice. h, Left, mean time projection over 70 frames (21 s) of the GCaMP6f signal in astrocytes in the period before ϴ-LTP induction (Pre). Right, representative Ca2+ traces from selected single-cell ROIs during  the same Pre period. Astrocytes show small asynchronous local Ca2+ activity and a few larger responses to single MPP stimulations. i, Left, mean time projection of the GCaMP6f signal in astrocytes as in h but during MMP stimulation inducing ϴ-LTP (ϴ-LTP). Right, representative Ca2+ traces from single astrocyte ROIs during ϴ-LTP induction. Multiple astrocytes show very large Ca2+ elevation (note the scale is 10-fold larger than in the Pre period) almost synchronously at the start of the ϴ-LTP protocol (red vertical line). j, Top, in experiments in VGLUTGFAP-KO mice, Slc17a7fl/fl mice are injected with AAV5-GFAP-mCherry-iCre virus to delete VGLUT1 selectively in astrocytes, and with AAV5-GFAP-GCaMP6f virus to report astrocyte Ca2+ dynamics. Bottom, multiple astrocytes, present in the same FOV as in k and l, display both mCherry fluorescence (red) indicating Cre recombination and GCaMP6f fluorescence (green). Scale bar: 50 µm. n = 2 FOVs, 2 mice. k Left, mean time projection over 80 frames (24 s) of the GCaMP6f signal in astrocytes in the Pre period. Right, representative Ca2+ traces from selected single-cell ROIs in the same Pre period. Astrocyte Ca2+ dynamics in VGLUT1GFAP-KO mice in the Pre period are comparable to those in controls mice (h). l, Left: mean time projection of the GCaMP6f signal in astrocytes as in k but in the ϴ-LTP induction period. Right, representative Ca2+ traces from selected single-cell ROIs during ϴ-LTP induction. The very large synchronous astrocyte Ca2+ responses in VGLUT1GFAP-KO mice are comparable to those in controls. m, Open field (O.F.) and activity tests (A.T.) performed on VGLUT1GFAP-KO (orange, n = 9 mice), VGLUT1GFAP-WT (light grey, n = 9 mice) and VGLUT1WT-TAM (dark grey, n = 10 mice) mice. Left, top, histograms reporting parameters index of locomotor activity (total distance travelled, P = 0.102; and velocity, P = 0.086) and anxiety (time spent immobile, P = 0.28; and time in the inner zone of the arena, P = 0.28) do not show group differences. Bottom, example traces of locomotor activity in the three mouse groups placed in the O.F. for 20 min. Right, top: Histograms reporting parameters index of exploratory activity (total number of rearings measured during the 5 min activity test preceding fear conditioning) do not show group differences (P = 0.89). Right, bottom, histograms reporting parameters index of pain sensitivity (mean total distance moved during 2s e-shocks repeated 6 times during the fear conditioning test) do not show group differences (P = 0.84). Data presented as mean ± s.e.m. One-way ANOVA with Tukey test. Source data
Extended Data Fig. 10
Extended Data Fig. 10. Additional data related to the GFAPcreERT2Slc17a6fl/fltdTomlsl/lsl mouse model, and the electrophysiology studies presented in Fig. 4.
a, UMAP representation of 2 integrated human and 1 mouse substantia nigra scRNA-seq datasets (Methods) annotated with a neural network classifier trained on a comprehensive database. The UMAP represents the distribution of predicted cluster 7 (blue) according to astrocyte reference annotation from the integrated astrocytic database in Fig. 1b. b, Genomic PCR to validate deletion of the Slc17a6 locus (Δ) in VGLUT2GFAP-KO mice. Left, validation on whole brain homogenates of VGLUT2GFAP-KO, and of VGLUT2GFAP-WT and VGLUT2WT-TAM controls (n = 2 per group). Right, validation on FACS-sorted astrocytes from the midbrain region of VGLUT2GFAP-KO and of GFAPcreERT2tdTomlsl/lsl controls (n = 2 per group). c, Representative fluorescence activated cell sorting of tdTomato positive (Tom+) astrocytes in midbrain samples of VGLUT2GFAP-WT mice (sorted ≥2 x 105 Tom+ cells per experiment, n = 2 independent experiments, 5 mice per experiment), VGLUT2GFAP-KO mice (sorted ≥2 x 105 Tom+ cells per experiment, n = 2 independent experiments, 5 mice per experiment) and GFAPCreERT2tdTomlsl/lsl mice (sorted ≥2 x 105 Tom+ cells per experiment, n = 2 independent experiments, 5 mice per experiment) See Methods for details. d, Left, Representative images, here acquired with confocal microscope, confirming no leakage in the absence of TAM-induced cre recombination, that is, lack of any Tom+ cells (red) in the SNpc of VGLUT2GFAP-WT and VGLUT2WT-TAM control mice also stained with the neuronal marker TH (green), the astrocyte marker S100β (grey), the oligodendrocyte marker Olig2 (grey) or the microglia marker Iba1 (grey), and the nuclear marker, DAPI (blue). Scale bar: 50 µm. Middle, confocal images confirming co-labelling of Tom+ cells (red) with the astrocyte marker S100β (grey) but not with the neuronal (TH, green) microglia (Iba1, grey) or oligodendrocyte (Olig2, grey) markers in the SNpc of VGLUT2GFAP-KO mice. Scale bar: 50 µm. Right, table presenting the total number of Tom+ cells and the relative numbers of the same Tom+ cells co-labelled with astrocyte (S100β), neuron (TH), oligodendrocyte (Olig2) or microglia (Iba1) markers, counted in SNpc of VGLUT2GFAP-KO mice after TAM-induced cre recombination. n = 12 images, 2 independent experiments, 3 mice. e, Left: representative cell-attached firing traces and Right, histograms of basal electrophysiological properties (firing frequency, membrane resistance (Rm) and holding current at –60 mV) of SNpc DA neurons in midbrain slices from VGLUT2GFAP-KO, VGLUT2GFAP-WT and VGLUT2WT-TAM mice. Data are presented as mean ± s.e.m. (firing frequency: VGLUT2GFAP-KO, n = 59 cells, 9 mice; VGLUT2GFAP-WT, n = 58 cells, 8 mice; VGLUT2WT-TAM, n = 26 cells, 8 mice; Rm and Ihold at −60 mV: VGLUT2GFAP-KO, n = 23 cells, 9 mice; VGLUT2GFAP-WT, n = 29 cells, 8 mice; VGLUT2WT-TAM mice, n = 38 cells, 8 mice). No differences among groups were observed: one-way ANOVA: P = 0.7399 for firing frequency; P = 0.47 for Rm; P = 0.516 for holding current at −60 mV. f, Plot of spontaneous firing frequency recorded in cell-attached mode in SNpc DA neurons of VGLUT1GFAP-KO (n = 18 cells, 3 mice) and VGLUT1GFAP-WT (n = 11 cells, 3 mice). No significant differences were found between the two groups: P = 0.228, unpaired Student’s t test, two tails. Data are presented as mean ± s.e.m. g, Histograms of frequency and amplitude of spontaneous excitatory postsynaptic currents (sEPSCs) recorded in SNpc DA neurons of VGLUT1GFAP-KO (n = 17 cells, 3 mice) and VGLUT1GFAP-WT (n = 10 cells, 3 mice). Data are presented as mean ± s.e.m. and show no differences between the two groups. P = 0.63 for sEPSC frequency and P = 0.64 for sEPSC amplitude, unpaired Student’s t test, two-tails. Source data

References

    1. Allen NJ, Lyons DA. Glia as architects of central nervous system formation and function. Science. 2018;362:181–185. doi: 10.1126/science.aat0473. - DOI - PMC - PubMed
    1. Araque A, et al. Gliotransmitters travel in time and space. Neuron. 2014;81:728–739. doi: 10.1016/j.neuron.2014.02.007. - DOI - PMC - PubMed
    1. Poskanzer KE, Yuste R. Astrocytes regulate cortical state switching in vivo. Proc. Natl Acad. Sci. USA. 2016;113:E2675–E2684. doi: 10.1073/pnas.1520759113. - DOI - PMC - PubMed
    1. Bezzi P, et al. CXCR4-activated astrocyte glutamate release via TNFα: amplification by microglia triggers neurotoxicity. Nat. Neurosci. 2001;4:702–710. doi: 10.1038/89490. - DOI - PubMed
    1. Kang N, Xu J, Xu Q, Nedergaard M, Kang J. Astrocytic glutamate release-induced transient depolarization and epileptiform discharges in hippocampal CA1 pyramidal neurons. J. Neurophysiol. 2005;94:4121–4130. doi: 10.1152/jn.00448.2005. - DOI - PubMed

Publication types

MeSH terms

LinkOut - more resources