. 2023 Sep;621(7980):840-848.
doi: 10.1038/s41586-023-06525-3. Epub 2023 Sep 6.

Phosphoantigens glue butyrophilin 3A1 and 2A1 to activate Vγ9Vδ2 T cells

Affiliations

Phosphoantigens glue butyrophilin 3A1 and 2A1 to activate Vγ9Vδ2 T cells

Linjie Yuan et al. Nature. 2023 Sep.

Abstract

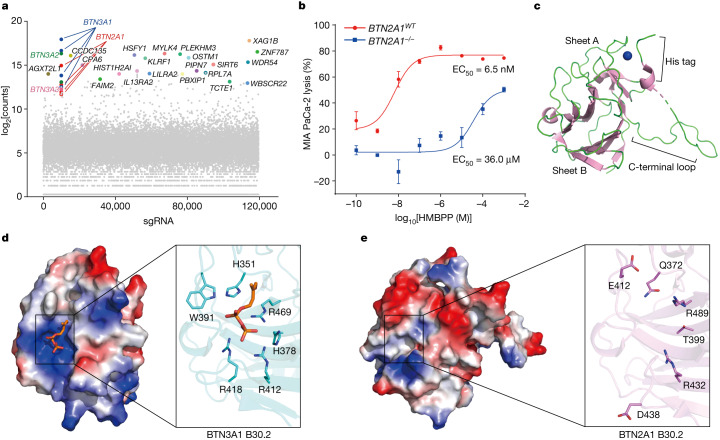
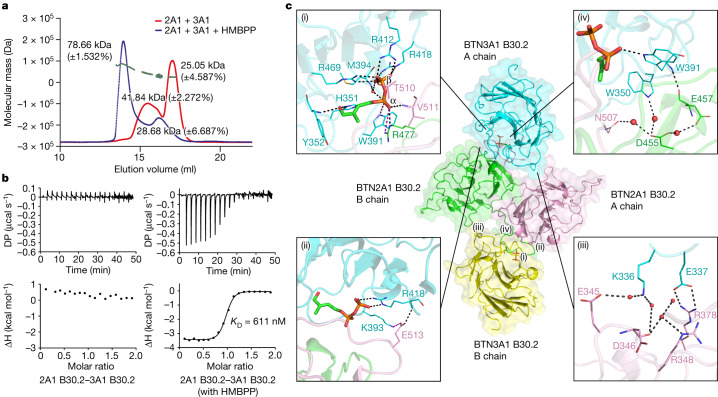
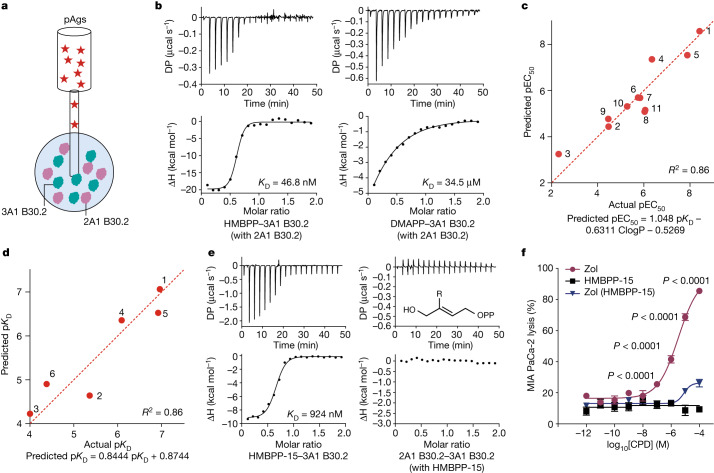
In both cancer and infections, diseased cells are presented to human Vγ9Vδ2 T cells through an 'inside out' signalling process whereby structurally diverse phosphoantigen (pAg) molecules are sensed by the intracellular domain of butyrophilin BTN3A11-4. Here we show how-in both humans and alpaca-multiple pAgs function as 'molecular glues' to promote heteromeric association between the intracellular domains of BTN3A1 and the structurally similar butyrophilin BTN2A1. X-ray crystallography studies visualized that engagement of BTN3A1 with pAgs forms a composite interface for direct binding to BTN2A1, with various pAg molecules each positioned at the centre of the interface and gluing the butyrophilins with distinct affinities. Our structural insights guided mutagenesis experiments that led to disruption of the intracellular BTN3A1-BTN2A1 association, abolishing pAg-mediated Vγ9Vδ2 T cell activation. Analyses using structure-based molecular-dynamics simulations, 19F-NMR investigations, chimeric receptor engineering and direct measurement of intercellular binding force revealed how pAg-mediated BTN2A1 association drives BTN3A1 intracellular fluctuations outwards in a thermodynamically favourable manner, thereby enabling BTN3A1 to push off from the BTN2A1 ectodomain to initiate T cell receptor-mediated γδ T cell activation. Practically, we harnessed the molecular-glue model for immunotherapeutics design, demonstrating chemical principles for developing both small-molecule activators and inhibitors of human γδ T cell function.


Conflict of interest statement

Y.Z. and W.M. are co-founders of Unicet Biotech, which is engaged in γδ T cell immunotherapy development.

Figures

Fig. 1
Fig. 1. BTN2A1 is essential for pAg sensing but does not directly bind to pAgs.
a, MIA PaCa-2 cells transfected with a whole-genome sgRNA library were pretreated with HMBPP (10 nM) for 4 h, and were then co-incubated with Vγ9Vδ2 T cells (sequentially, seven times) to enrich for genes related to target-cell killing. BTN3A1 and BTN2A1 (sgRNA ≥ 4) were identified in the screening. b, The cytotoxicity of Vγ9Vδ2 T cells towards BTN2A1WT (red) or BTN2A1−/− (blue) MIA PaCa-2 cells treated with HMBPP (100 pM to 1 mM). n = 4. Data are mean ± s.e.m. c, Cartoon model of the apo BTN2A1 B30.2 crystal structure (PDB: 8IGT). The two β-sheets, the extended C-terminal loop and the His tag are indicated. The zinc ion associated with the His tag is displayed as a blue sphere. d, Electrostatic surface of BTN3A1 B30.2 (left) and HMBPP-interacting residues (right). The highly cationic region (blue) and anionic regions (red) are shown. e, Electrostatic surface (left) and residues (right) in the BTN2A1 B30.2 structure corresponding to BTN3A1 B30.2 are illustrated. Source data
Fig. 2
Fig. 2. Exogenous HMBPP promotes BTN2A1 B30.2–BTN3A1 B30.2 association.
a, SEC–MALS analysis of BTN2A1 B30.2–BTN3A1 B30.2 complexes with or without HMBPP. Numbers in plot indicate the molecular mass of each adjacent peak; green dashed line indicates control molecular mass. 2A1, BTN2A1; 3A1, BTN3A1. b, HMBPP promotes BTN2A1 B30.2 binding to BTN3A1 B30.2. c, The structure of the BTN3A1 B30.2–HMBPP–BTN2A1 B30.2 complex (PDB: 8JYE). Middle, cartoon representation of two BTN3A1 B30.2–HMBPP molecules (cyan and yellow) in complex with a BTN2A1 B30.2 homodimer (the A and B chains are shown in pink and green, respectively). Magnified views of the interactions between the BTN2A1 B30.2 dimer and the HMBPP–BTN3A1 B30.2 A chain are shown: HMBPP and the BTN2A1 and BTN3A1 B30.2 domains (i); BTN2A1 B30.2 and BTN3A1 B30.2 domains (ii–iii); and Trp350/Trp391 of BTN3A1 B30.2 and the BTN2A1 B30.2 domain (iv). Water molecules are shown as small red spheres. The black dashed lines indicate hydrogen bonds, and the purple dashed lines indicate salt bridges. Source data
Fig. 3
Fig. 3. DMAPP and IPP function as molecule glues to activate γδ T cells.
a, ITC analysis indicates that DMAPP and IPP promote the association between BTN3A1 B30.2 and BTN2A1 B30.2. b, Cartoon model of the BTN3A1 B30.2–DMAPP–BTN2A1 B30.2 complex (PDB: 8JYC). DMAPP is shown as a stick model and a water molecule is shown as a red sphere. c, TNF release by Vγ9Vδ2 T cells in response to zoledronate stimulation of BTN3A1+CD80+ CHO-K1 cells (left; n = 6) or BTN2A−/− MIA PaCa-2 (BTN2A1/BTN2A2 KO) cells (right; n = 5, representative of four independent experiments) transfected with the plasmids for the indicated BTN2A1 mutants. Residues in BTN2A1 B30.2 that directly interact with DMAPP and residues in BTN2A1 B30.2 that directly interact with Trp350/Trp391 in BTN3A1 B30.2 are indicated. Statistical analysis was performed using Welch’s analysis of variance (ANOVA) with Dunnett’s T3 multiple-comparison test, comparing each BTN2A1 mutant with the WT control. Data are mean ± s.e.m. d, TNF release by Vγ9Vδ2 T cells in response to zoledronate-treated (Zol, 10 µM) BTN2A−/− MIA PaCa-2 cells (n = 6, representative of four independent experiments) that were transfected with plasmids encoding the indicated BTN2A1 mutants (based on the analysis in Extended Data Fig. 3d). Statistical analysis was performed using Welch’s ANOVA with Dunnett’s T3 multiple-comparison test, comparing with the WT control. Data are mean ± s.e.m. Source data
Fig. 4
Fig. 4. The molecular glue mechanism is conserved in alpaca.
a, Structure superimposition of VpBTN3 B30.2 (ΔC) in complex with HMBPP (cyan), DMAPP (purple) and IPP (yellow) (PDB: 8JY9, 8JYF and 8JYA, respectively). Electrostatic surface of HMBPP-bound VpBTN3 B30.2 (up) and interacting residues of the HMBPP 1-OH group (down). b, ITC results for VpBTN2 BFI binding to VpBTN3 BFI in the presence of HMBPP, DMAPP and IPP. c, Cartoon model of the VpBTN3 B30.2–HMBPP–VpBTN2 B30.2 complex (PDB: 8HJT). HMBPP is shown as a stick model. The magnified view (right) illustrates the interaction networks formed by HMBPP and the three polypeptide chains.
Fig. 5
Fig. 5. The molecular-glue model predicts pAg cellular activity and informs drug discovery.
a, Schematic of ITC used to measure pAg binding affinity for the preconditioned BTN2A1–BTN3A1 complex. b, ITC results for HMBPP (left) and DMAPP (right) binding to the preconditioned BTN2A1–BTN3A1 B30.2 complex. c, The correlation between experimental and predicted pEC50 values (pEC50 = −log10[EC50 (M)]) for pAg-mediated Vγ9Vδ2 T cell killing of MIA PaCa-2 cells, obtained using the experimentally determined KD value(s) (BTN2A1–BTN3A1 assay) and computed ClogP values (Supplementary Table 4) for a library of HMBPP analogues (structures are shown in Extended Data Fig. 5a). d, The correlation between experimental and predicted pKD values (pKD = −log10[KD (M)]) for POP analogue binding to the preconditioned BTN3A1–BTN2A1 complex, obtained using the ITC experimentally determined KD values (BTN2A1–BTN3A1 assay) and pKD values computed by FEP+. e, ITC results demonstrating the binding of HMBPP-15 to BTN3A1 B30.2 (left) and ITC results showing that HMBPP-15 does not promote the interaction of BTN2A1 B30.2 with BTN3A1 B30.2 (right). OPP, diphosphate; R, 4-biphenyl. f, Cytotoxicity of Vγ9Vδ2 T cells towards MIA PaCa-2 cells stably expressing WT BTN2A1 that were treated with the indicated concentrations of HMBPP-15 or zoledronate (with or without HBMPP-15). CPD, compound. n = 6, representative of three independent experiments. Statistical analysis was performed using two-way ANOVA with Dunnett’s multiple-comparison test, relative to the WT control at equal concentrations. Data are mean ± s.e.m. Source data
Fig. 6
Fig. 6. BTN3A1–BTN2A1 intracellular association leads to their extracellular push-off.
a, Schematic of AFM-SCFS force measurement between a γδ T cell and a target cell. The schematic was created using BioRender. b, Disruption of the intracellular BTN3A1–BTN2A1 association reduced the pAg-enhanced adhesion force. Statistical analysis was performed using Kruskal–Wallis tests with Dunn’s multiple-comparison test, relative to the BTN2A1 HMBPP or zoledronate group. n = 40, 31, 39 and 31 (left) and n = 17, 16, 10 and 19 (right). Data are mean ± s.e.m. c, Molecular dynamics simulation showing that apo-structure regions (with root-mean-squared fluctuation (r.m.s.f.) > 1.5 Å) in the molecular dynamics trajectory map well to the crystal structure (the BTN3A1 B30.2–HMBPP–BTN2A1 B30.2 complex). Regions with high r.m.s.f. values are presented in red with increased thickness. d, The 19F-NMR chemical shift of TET–Cys357 (in BTN3A1) after binding to HMBPP and BTN2A1 B30.2 or its ΔC mutant (left). Right, comparison of the activities of HMBPP, DMAPP and IPP. e, The cytotoxicity of Vγ9Vδ2 T cells towards BTN2A−/− MIA PaCa-2 cells (n = 4) that were transfected with plasmids encoding chimeric variants of BTN2A2 B30.2(W374R/M506T) and exposed to increasing concentrations of HMBPP (0.1 µM, 1 µM and 10 µM; above plots). In key, 'other segments' indicates extracellular (EC) and JM domains. Statistical analysis was performed using two-way ANOVA with Dunnett’s multiple-comparison test, relative to the ‘BTN2A2 B30.2(W374R/M506T) (with BTN2A1 other segments)’ group. Data are mean ± s.e.m. f, PIPER study of the interactions between extracellular BTN2A1 and the Vγ9Vδ2 T cell TCR. g, PIPER study of the interactions between extracellular BTN2A1 and BTN3A1. The overlapping BTN2A1 regions in f and g are coloured red. h, IFNγ release from Vγ9Vδ2 T cells in response to zoledronate stimulation of BTN2A−/− MIA PaCa-2 (BTN2A1/BTN2A2 KO) cells expressing mutant BTN2A1 variants (E63A and R84A). n = 6, representative of two independent experiments. Statistical analysis was performed using two-way ANOVA with Dunnett’s multiple-comparison test, relative to the WT control at equal concentrations. Data are mean ± s.e.m. i, Diagram of pAgs initiating inside-out conformational changes in BTN2A1–BTN3A1. j, Computational approaches to visualize inside-out signalling, showing the TCR-disengaged state and the TCR-engaged state of full-length BTN3A1 and BTN2A1. Source data
Extended Data Fig. 1
Extended Data Fig. 1. HMBPP binds to the BTN3A1 B30.2 domain but not to BTN2A1’s B30.2 domain.
a, Sequence alignment of the B30.2 domains of 2A1 and 3A1 (49.7% similarity). b, ITC results for HMBPP binding to 2A1 B30.2 (left) and binding to 3A1 B30.2 (right). c, The dimer interface of 2A1 B30.2 buried approximately 1924 Å2, (PDBePISA server: https://www.ebi.ac.uk/pdbe/pisa/), which accounts for 16% of the total surface area of the monomer. d, The BTN2A1 B30.2 dimer. e, SEC-MALS analysis of 2A1 B30.2 and 2A1 B30.2-ΔC. 2A1 B30.2 (in red) exists mainly as a dimer in solution. The 2A1 B30.2-ΔC domain (in blue) exists mainly as a monomer in solution. f, Superimposition of 2A1 B30.2 (in pink) and HMBPP-bound 3A1 B30.2 (in cyan, PDB: 5ZXK). HMBPP is shown as a stick. Source data
Extended Data Fig. 2
Extended Data Fig. 2. Features of BTN2A1 B30.2 required for its association with BTN3A1 and for HMBPP-induced Vγ9Vδ2 T cell activation.
a, Sedimentation coefficient distribution c(s) profiles for different concentrations (1 mg/mL (i and ii) and 5 mg/mL (iii and iv) for each protein) of 2A1 B30.2 and 3A1 B30.2, with (ii and iv) or without (i and iii) HMBPP based on sedimentation velocity absorbance data. b, ITC results indicate that HMBPP binds to 3A3R351H B30.2 (left) and promotes the 2A1 B30.2 binding to 3A3R351H B30.2 (right). c, Sedimentation coefficient distribution c(s) profiles for 2A1 and 3A3R351H at a 1:1.25 ratio with (red) or without (blue) HMBPP based on sedimentation velocity absorbance data. A new peak (37.6 S) was formed in the presence of HMBPP. d, Structure superimposition of apo-2A1 B30.2 and dimeric 2A1 in the 3A1 B30.2-HMBPP-2A1 B30.2 complex. e, An expanded view of HMBPP binding to 3A1 B30.2 (in yellow) (PDB: 5ZXK), showing the same interactions as observed in the 3A1 B30.2-HMBPP-2A1 B30.2 complex. f, ITC results for the indicated 2A1 B30.2 mutant variants binding to 3A1 B30.2 in the presence of HMBPP and the EC50 values of Vγ9Vδ2 T cells towards BTN2A−/− MIA PaCa-2 (2A1/2A2 KO) transfected with plasmids for the indicated 2A1 mutant variants in the presence of HMBPP. g, Cytotoxicity of Vγ9Vδ2 T cells towards BTN2A−/− MIA PaCa-2 (2A1/2A2 KO, n = 5, representative of two independent experiments) transfected with plasmids for the indicated 2A1 mutant variants, pretreated with HMBPP (1 nM~100 µM) overnight. Note that the 2A1 ΔC mutant was BTN2A1 with a truncated tail (truncated residues include LTGANGVTPEEGLTLHRVSLLE). Error bars: SEM. h, Flow cytometry analysis of His-tagged 2A1 mutant variants in BTN2A−/− 293T cells (n = 4, representative of two independent experiments), as detected by anti-His mAb. Error bars: SEM. Source data
Extended Data Fig. 3
Extended Data Fig. 3. Disruption of the association of 2A1 B30.2 to 3A1 20.2 impairs γδ T cell responses to DMAPP and IPP.
a, Cytotoxicity of Vγ9Vδ2 T cells towards BTN2A1WT and BTN2A1−/− MIA PaCa-2 cells (n = 6), which were pretreated with zoledronate (Zol) for 24 h. Data analysis: Two-way ANOVA with Šídák’s multiple comparisons test. P relative to the control. Error bars: SEM. b, ITC results for DMAPP and IPP binding to 3A1 B30.2. c, Cytotoxicity of Vγ9Vδ2 T cells towards BTN2A−/− MIA PaCa-2 (2A1/2A2 KO) cells stably expressing 2A1 WT or ΔC mutant variants (n = 3), treated with different concentration HMBPP/DMAPP/IPP. Data analysis: Two-way ANOVA with Šídák’s multiple comparisons test. P indicated the comparison between two groups at equal concentrations. Error bars: SEM. Representative of three independent experiments in HMBPP/DMAPP group. Representative of two independent experiments in IPP group. d, Analysis of the interactions between 2A1 B30.2 A chain and B chain reveal residues affecting γδ T cell responses. e, Flow cytometry analysis of His-tagged 2A1 mutant variants in BTN2A−/− 293T cells (n = 4, representative of two independent experiments), as detected by anti-His mAb. Error bars: SEM. f, SEC-MALS analysis of 2A1 B30.2R449A/R469A. The 2A1 B30.2R449A/R469A exists mainly as a monomer in solution. g, ITC results indicate that 2A1 B30.2R449A/R469A does not bind to 3A1 B30.2 in the presence of HMBPP. Source data
Extended Data Fig. 4
Extended Data Fig. 4. Structural and ITC studies reveals the key features involved in the association of VpBTN3 and VpBTN2 in the presence of pAgs.
a, ITC results for HMBPP (left), DMAPP (middle), and IPP (right) binding to VpBTN3 BFI. Notably, the KD values of HMBPP and IPP have been reported previously. b, Structure superimposition of apo-VpBTN3 B30.2 (in cyan, PDB: 8JYB) and apo-BTN3A1 B30.2 (in purple, PDB: 4V1P). c, Expanded view of HMBPP and its interactions with protein residues in HMBPP-bound VpBTN3 B30.2. HMBPP are shown as sticks and water is shown as small red spheres. d, ITC results indicate that VpBTN1 does not bind to VpBTN3 in the presence of HMBPP (left), DMAPP (middle) and IPP (right). e, ITC results indicate that mutations of the indicated conserved residues in VpBTN2 (R475A, T508M and V509A, as revealed in Fig. 4c) abolished its binding to VpBTN3 in the presence of HMBPP. Note that the residues in VpBTN2 (R475, T508, and V509) correspond to 2A1 B30.2 residues (R477, T510 and V511) identified as functionally relevant for intracellular association with 3A1.
Extended Data Fig. 5
Extended Data Fig. 5. The molecular glue model explains the highly divergent cellular activities of specific pAgs.
a, The chemical structures of diverse pAgs used in computational modelling. Compounds 4–6 are analogues of POP, while compounds 7–11 are analogues of PCP. Note that 7 has been reported. b, The structure of 2A1-B30.2-HMBPP-3A1 B30.2 (PDB: 8JYE) was superimposed to the structure of 3A1 B30.2-compound 8 (PDB: 8IXV). c, Electrostatic potential surface of HMBPP (left) and its PCP analogue 7 (right), and the calculated pKa values by Jaguar pKa (Schrödinger Release 2023-1). d, The structure of 3A1 B30.2-compound 4 (PDB: 8IZE) and the structure of 3A1 B30.2-compound 5 (PDB: 8IZG) were superimposed to the structure of 3A1 B30.2-HMBPP (PDB: 5ZXK) respectively. e, ITC results indicate that HMBPP-05 (left) and HMBPP-08 (right) do not promote interaction of 2A1 B30.2 with 3A1 B30.2. f, The spatial hindrance posed by HMBPP analogues. The structures of 2A1 B30.2-HMBPP-3A1 B30.2 and HMBPP-08-bound 3A1 B30.2 (PDB: 6J06) were superimposed. It is clear that the bulky group of HMBPP-08 clashes with a loop at a 2A1 B30.2 region containing residues G508-V509. HMBPP-05 is docked into the BTN3A1 B30.2 based on the 2A1 B30.2-HMBPP-3A1 B30.2 complex, which clashes with the loop of 2A1 B30.2.
Extended Data Fig. 6
Extended Data Fig. 6. Engineering BTN2A2 for Vγ9Vδ2 T cell activation.
a, 2A2 B30.2W374R/M506T domain gains the function to bind to 3A1 30.2 in the presence of HMBPP. ITC results of the binding affinity of 2A2 (left) and 2A2 B30.2W374R/M506T (right) to the 3A1 B30.2 domain in the presence of HMBPP. b, Structural superimposition of the engineered 2A2 B30.2W374R/M506T domain (cyan, PDB: 8IH4) and the 2A1 B30.2 domain (pink, PDB: 8IGT). c, TNF-α release by Vγ9Vδ2 T cells in response to zoledronate (10 µM) stimulation of 3A1+CD80+ CHO-K1 cells (left, n = 5) or BTN2A−/− MIA PaCa-2 cells (right, n = 5) transfected with plasmids encoding chimeric variants of 2A2 (with the 2A1 JM, EC, or both JM and EC, as indicated). Note that no “active” 2A2 chimera was obtained upon replacing the 2A2 JM or EC regions/segments with the counterpart sequences from 2A1, whereas the chimera comprising the 2A2 B30.2 domain with the 2A1 JM and EC segments was active for T cell activation (henceforth termed “the active chimera”). Data analysis: using Two-way ANOVA with Dunnett’s multiple comparisons test. P compared each 2A1 mutant to the WT control or 2A1M506T. Error bars: SEM. d, Top: Cytotoxicity of Vγ9Vδ2 T cells towards BTN2A−/− MIA PaCa-2 (2A1/2A2 KO, n = 4) cells transfected with plasmids for the active chimera bearing the indicated mutations exposed to HMBPP (10 pM to 100 µM). Bottom: Dose-response curves for MIA PaCa-2 cell lysis by Vγ9Vδ2 T cells exposed to HMBPP. Error bars: SEM. e, Sketches for chimeric variants of 2A2 B30.2W374R/M506T (with the 2A1 JM, extracellular domain (EC), or both JM and EC, as indicated). The red star indicates that Vγ9Vδ2 T cells are activated. f, Flow cytometry analysis of His tagged chimeric variants of 2A2 (with the 2A1 JM, EC, or both JM and EC, as indicated) in BTN2A−/− 293T cells (n = 4, representative of two independent experiments), as detected by anti-His mAb. n = 4. Error bars: SEM. Source data
Extended Data Fig. 7
Extended Data Fig. 7. Computational and mutagenesis studies that characterize the role of 2A1 JM region and 2A1-Vγ9 (2A1-3A1) interaction.
a, Structural predictions of the 2A1 JM region by the CCFold web server. Leucine residues are in cyan. b, TNF-α release by Vγ9Vδ2 T cells in response to zoledronate (Zol, 10 µM) stimulation of BTN2A−/− MIA PaCa-2 cells (n = 6, representative of two independent experiments) transfected with the plasmids for the indicated 2A1 JM mutants. Data analysis: Kruskal–Wallis test with a Dunn’s multiple comparisons test. P relative to the WT control. Error bars: SEM. c, Flow cytometry analysis of His-tagged 2A1 JM mutant variants in BTN2A−/− 293T cells (n = 4, representative of two independent experiments), as detected by anti-His mAb. Error bars: SEM. d, Flow cytometry analysis of His-tagged 2A1 JM mutant variants in BTN2A−/− 293T cells (n = 4, representative of two independent experiments), as detected by anti-His mAb. Error bars: SEM. e, The predicted interactions between extracellular 2A1 and Vγ9. f, The predicted interactions between extracellular 2A1 and 3A1. g, Flow cytometry analysis of His-tagged 2A1 EC mutant variants in BTN2A−/− MIA PaCa-2 cells (n = 4), as detected by anti-His mAb. Error bars: SEM. Source data

References

    1. Sandstrom A, et al. The intracellular B30.2 domain of butyrophilin 3A1 binds phosphoantigens to mediate activation of human Vγ9Vδ2 T cells. Immunity. 2014;40:490–500. - PMC - PubMed
    1. Rhodes DA, et al. Activation of human γδ T cells by cytosolic interactions of BTN3A1 with soluble phosphoantigens and the cytoskeletal adaptor periplakin. J. Immunol. 2015;194:2390–2398. - PMC - PubMed
    1. Sebestyen Z, et al. RhoB mediates phosphoantigen recognition by Vγ9Vδ2 T cell receptor. Cell Rep. 2016;15:1973–1985. - PMC - PubMed
    1. Yang Y, et al. A structural change in butyrophilin upon phosphoantigen binding underlies phosphoantigen-mediated Vγ9Vδ2 T cell activation. Immunity. 2019;50:1043–1053. - PubMed
    1. Rossjohn J, et al. T cell antigen receptor recognition of antigen-presenting molecules. Annu. Rev. Immunol. 2015;33:169–200. - PubMed

MeSH terms

LinkOut - more resources