[Preprint]. 2023 Aug 23:rs.3.rs-3270016.
doi: 10.21203/rs.3.rs-3270016/v1.

Hippocampus shapes cortical sensory output and novelty coding through a direct feedback circuit

Affiliations

Hippocampus shapes cortical sensory output and novelty coding through a direct feedback circuit

T Butola et al. Res Sq. .

Update in

Abstract

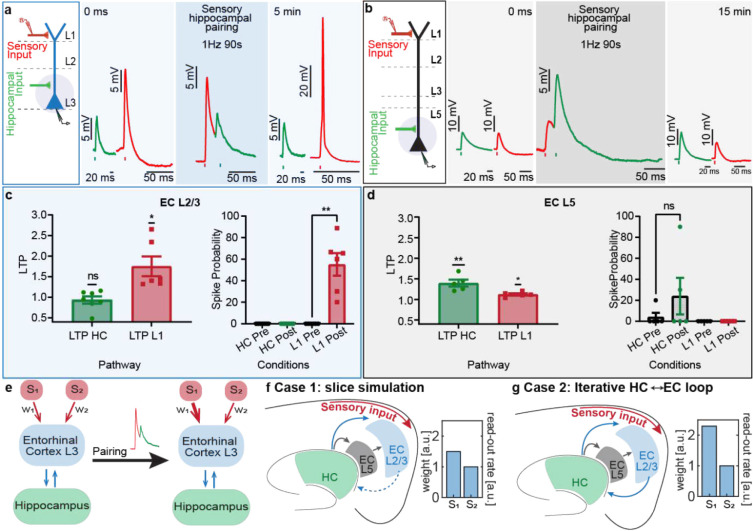
To extract behaviorally relevant information from our surroundings, our brains constantly integrate and compare incoming sensory information with those stored as memories. Cortico-hippocampal interactions could mediate such interplay between sensory processing and memory recall1-4 but this remains to be demonstrated. Recent work parsing entorhinal cortex-to-hippocampus circuitry show its role in episodic memory formation5-7 and spatial navigation8. However, the organization and function of the hippocampus-to-cortex back-projection circuit remains uncharted. We combined circuit mapping, physiology and behavior with optogenetic manipulations, and computational modeling to reveal how hippocampal feedback modulates cortical sensory activity and behavioral output. Here we show a new direct hippocampal projection to entorhinal cortex layer 2/3, the very layer that projects multisensory input to the hippocampus. Our finding challenges the canonical cortico-hippocampal circuit model where hippocampal feedback only reaches entorhinal cortex layer 2/3 indirectly via layer 5. This direct hippocampal input integrates with cortical sensory inputs in layer 2/3 neurons to drive their plasticity and spike output, and provides an important novelty signal during behavior for coding objects and their locations. Through the sensory-memory feedback loop, hippocampus can update real-time cortical sensory processing, efficiently and iteratively, thereby imparting the salient context for adaptive learned behaviors with new experiences.

Keywords: Behavior; Electrophysiology; Memory; Optogenetics; Plasticity; Rabies virus.


Conflict of interest statement

Competing interests: Authors declare that they have no competing interests.

Figures

Extended Data Fig. 1.
Extended Data Fig. 1.. Injection site in dorsal hippocampus CA1.
a. Confocal image of a horizontal brain slice of a mouse injected with AAV 2.5 EF1α-double floxed-ChR2-eYFP into dorsal CA1 and immunostained for GFP to demarcate the injection site and DAPI (nuclear marker). Bottom inset shows a sagittal profile of a mouse brain depicting the injection strategy. CamKII Cre or CamKII Cre x Ai14 mice were injected with AAV 2.5 EF1α-double floxed-ChR2-eYFP into dorsal CA1.The area within the white dotted box is expanded in panel b. b. Magnified view of the infected CA1 neurons within the white dotted box in panel a. c. Schematic adapted from Paxinos mouse brain atlas depicting a horizontal section of a mouse brain showing the regions within the hippocampal formation: areas CA1, CA2, CA3, dentate gyrus (DG), and subiculum (Sub), and lateral ventricle (LV). d. Confocal image of a coronal brain slice of a mouse injected with AAV 2.2 CAMKII-ChR2-eYFP into dorsal CA1 and immunostained for GFP to demarcate the injection site. The area within the white dotted box is expanded in panel e. e. Magnified view of the infected CA1 neurons within the white dotted box in panel d. f. Schematic adapted from Paxinos mouse brain atlas depicting a coronal section of a mouse brain showing the regions within the hippocampal formation: areas CA1, CA2, CA3, dentate gyrus (DG), and dorsal 3rd ventricle (DV).
Extended Data Fig. 2.
Extended Data Fig. 2.. Dorsal to ventral axis of hippocampal projections to entorhinal cortex.
a. (a1) Schematic adapted from Paxinos mouse brain atlas depicting a horizontal section of a mouse brain showing the various brain regions that are included in the confocal image in panel a2. The position of the horizontal plane of section through the mouse brain is reported as ventral distance from bregma (−2400 μm) in the bottom left corner. (a2) Confocal image of horizontal brain slice of a mouse injected with AAV2.5 EF1α-double floxed-ChR2-eYFP into dorsal CA1 and immunostained for GFP and DAPI (nuclear marker). Green hippocampal axons were observed in medial entorhinal cortex (MEC) layers 5 and 2/3, and parasubiculum. White dotted lines demarcate the different cortical layers and brain regions. Arrowheads point the layer detailed in panels a3 and a4. (a3) Magnified view of the hippocampal axons in ECL5, an area pointed by the white arrowhead labeled a3 in panel a2. (a4) Magnified view of the hippocampal axons in ECL2/3, an area pointed by the white arrowhead labeled a3 in panel a2. b. Same as a. but for −2800 μm from bregma. c. Same as a. but for −3200 μm from bregma. d. Same as a. but for −3600 μm from bregma. e. Same as a. but for −4000 μm from bregma. Abbreviations used: Au1 – primary auditory cortex, AuV – secondary auditory cortex ventral, DG – dentate gyrus, LEC – lateral entorhinal cortex, LV – lateral ventricle, MEC – medial entorhinal cortex, PaS – parasubiculum, PRh – perirhinal cortex, PrS – presubiculum, S2 – secondary somatosensory cortex, Sub – subiculum, TeA – temporal association cortex.
Extended Data Fig. 3.
Extended Data Fig. 3.. Validation of hippocampal feedback using different viral strategies.
a. Top - Confocal image of a horizontal brain slice of a mouse injected with AAV2.1 EF1α-double floxed-ChR2-eYFP (41.5 nl/site with 3 week incubation) into dorsal CA1 and immunostained for GFP and DAPI (nuclear marker). Green hippocampal axons were observed in entorhinal cortex layers 5 and 2/3. Center – Expanded view of the hippocampal projection to ECL5. No infected neurons were observed in ECL5. Bottom – Expanded view the hippocampal projection to ECL2/3 showing a sample infected ECL2/3 neuron. b. Top – Confocal image of a horizontal brain slice of a mouse injected with AAV2.9 EF1α-double floxed-ChR2-eYFP (41.5 nl/site with 3 week incubation) into dorsal CA1 and immunostained for GFP and DAPI (nuclear marker). Green hippocampal axons were observed in entorhinal cortex layers 5 and 2/3. Center – Expanded view of the hippocampal projection to ECL5. No infected neurons were observed in ECL5. Bottom – Expanded view the hippocampal projection to ECL2/3 showing a sample infected ECL2/3 neuron. c. Top – Confocal image of a horizontal brain slice of a mouse injected with AAV2.5 EF1α-double floxed-ChR2-eYFP (82.8 nl/site with 3 week incubation) into dorsal CA1 and immunostained for GFP and DAPI (nuclear marker). Green hippocampal axons were observed in entorhinal cortex layers 5 and 2/3. Center – Expanded view of the hippocampal projection to ECL5. Bottom – Expanded view the hippocampal projection to ECL2/3. No infected neurons were observed in either EC layer. d. Top – Confocal image of a horizontal brain slice of a mouse injected with AAV2.2 CAMKII-ChR2-eYFP (41.4 nl/site with 3 week incubation) into dorsal CA1 and immunostained for GFP and DAPI (nuclear marker). Green hippocampal axons were observed in entorhinal cortex layers 5 and 2/3. Center – Expanded view of the hippocampal projection to ECL5. Bottom – Expanded view the hippocampal projection to ECL2/3. No infected neurons were observed in either EC layer. e. Quantification of the number of infected neurons observed in EC after 3 weeks of viral incubation period. 41.4 nl of virus was injected per site for viral serotypes AAV 2.1 (n = 8), 2.2 (n = 8), and 2.9 (n = 22), and 82.8 nl per site for AAV 2.5 (n = 11). f. Confocal image of a horizontal brain slice of a mouse injected with AAV 2.5 EF1α-double floxed-ChR2-eYFP into dorsal CA1 and immunostained for GFP, MAP2 (marker for dendrites), and DAPI (nuclear marker). Green hippocampal axons were observed in entorhinal cortex layers 5 and 2/3. The area within the white dotted boxes are expanded in panels f1, f2, and f3. Absence of colocalization between the GFP and MAP2 immunofluorescence signals verify the absence viral infection in EC neurons.
Extended Data Fig. 4.
Extended Data Fig. 4.. Hippocampal CA1 primarily projects to entorhinal cortex layer 2/3 while subiculum projects to layer 5.
a. Confocal image of a horizontal brain slice of a mouse injected with AAV 2.2 Syn flex Chrimson TdTom in dorsal subiculum and AAV 2.2 Syn flex Chronos GFP in dorsal CA1, immunostained for GFP, RFP, and DAPI. White dotted lines demarcate the different hippocampal areas: Sub – Subiculum, and CA1- CA1 pyramidal layer. b. Confocal image of a horizontal brain slice of a mouse injected with AAV 2.2 Syn flex Chrimson TdTom in dorsal subiculum and AAV 2.2 Syn flex Chronos GFP in dorsal CA1, immunostained for GFP, RFP, and DAPI. Green CA1 axons were primarily observed in entorhinal cortex (EC) layers 2/3, while red subiculum axons in EC layer 5. White dotted lines demarcate the different cortical layers. Projections to ECL2/3 and ECL5 enclosed in green and red boxes respectively are magnified in bottom left and bottom right insets respectively. c. Normalized fluorescence intensity of hippocampal axons in EC as a function of distance from pia. Red and green traces represent the fluorescence along the axons from subiculum and CA1 respectively. In total 6 animals were used to resolve HC-ECL2/3 and HC-ECL5 pathways.
Extended Data Fig. 5.
Extended Data Fig. 5.. Hippocampal projections primarily target medial entorhinal cortex (MEC).
a. Confocal image of horizontal brain slice of a mouse injected with AAV2.5 EF1α-double floxed-ChR2-eYFP into dorsal CA1 and immunostained for GFP and Wfs1 (labels pyramidal cells in MEC). White dotted lines demarcate the different cortical layers and brain regions. Note the sharp cut-off of green hippocampal projections at the MEC border demarcated by the absence of clusters of pyramidal cells labeled by Wfs1. The position of the horizontal plane of section through the mouse brain is reported as ventral distance from bregma (−2400 μm) in the bottom left corner. PaS – parasubiculum. b. Same as a. but for −3200 μm from bregma.
Extended Data Fig. 6.
Extended Data Fig. 6.. Quantification of GFP+ presynaptic cells.
Quantification of GFP+ presynaptic input cells in brain regions that project to starter neurons in MECL2/3 shown by double injection of AAV tetO TVA 2AG and ΔG-rRB-GFP to EC L3 tTA mice. Abbreviations used: DG – dentate gyrus, LEC – lateral entorhinal cortex, MEC – medial entorhinal cortex.
Extended Data Fig. 7.
Extended Data Fig. 7.. Functional channelrhodopsin 2 (ChR2) expression only in hippocampal neurons and axonal projections.
a. Schematic of the proposed circuit overlaid on a confocal image of a horizontal mouse brain slice. Green hippocampal projections from hippocampal CA1 project not only to ECL5 but also to ECL2/3. EC – entorhinal cortex, PrS – presubiculum, PaS – parasubiculum. b. Top – Fire and sag properties recorded from a CA1 pyramidal neuron. Shown here are the intrinsic electrical responses of the neuron to current injection of −240 pA, and current corresponding to rheobase, and 1.5 x rheobase. Bottom – Sustained photocurrent elicited in response to a 500 ms 470 nm light pulse demonstrates the expression of functional ChR2 in the CA1 pyramidal neuron. c. Top – Fire and sag properties recorded from an ECL2/3 stellate cell. Shown here are the intrinsic electrical responses of the neuron to current injection of −240 pA, and current corresponding to rheobase, and 1.5 x rheobase. Bottom – Absence of sustained photocurrent elicited in response to a 500 ms 470 nm light pulse confirms the lack of off-target viral infection in the EC leading to ChR2 expression. d – e. Same as c but for ECL2/3 (d) and ECL5 (e) pyramidal neurons.
Extended Data Fig. 8.
Extended Data Fig. 8.. Input – output transformation of light – evoked postsynaptic currents at EC neurons upon increasing strength of optical stimulation of ChR2+ hippocampal axons.
a. Representative voltage clamp recordings from ECL5 neuron to record excitatory and inhibitory postsynaptic currents (EPSC and IPSC respectively) at −80 mV and +10 mV respectively. Insets show parts of the trace enclosed in the dotted box. b. IPSC amplitudes recorded at ECL5 neurons in response to increasing LED intensity for the 470 nm optical stimulation of ChR2+ hippocampal projections to EC. Each gray trace is from a single neuron and the bold red trace represents the mean ± SEM across neurons. Data points within the black dotted box in the left panel are expanded in the right panel. c. Same as b. but for EPSC amplitudes recorded at ECL5 neurons. d. Same a. but for ECL2/3 neurons. e. Same as b. but for ECL2/3 neurons. f. Same as b. but for EPSC amplitudes recorded at ECL2/3 neurons.
Extended Data Fig. 9.
Extended Data Fig. 9.. Validation in vivo optogenetic silencing of the HC-ECL2/3 circuit.
a – c. Validation of JAWs silencing in acute mouse brain hippocampal slices. (a) Characteristic firing and sag pattern of a CA1 pyramidal neuron (PN). (b) Step-increase in hyperpolarization in response to pulses of increasing intensity of 625 nm LED. (c) Top – validation of far-red light activated inhibitory opsin JAWs silencing. CA1 PN stays at −70 mV in the absence of current injection and fires characteristically upon depolarizing current (300 pA) current injection, except when it hyperpolarizes in the 500 ms interval of JAWs activating 625 nm light stimulation (top). Bottom – stimulation pattern: 500 ms of 625 nm light stimulation in the middle of a second-long recording period (bottom). d. Comparison of the total number of errors made by the animal during the learning phase on day 1 vs day 7. Errors were counted as the number of times an animal explored different holes including the escape hole without entering the escape box. Box and whisker plots show the median number of errors made by the cohort of animals (control – black, JAWS – red), lower/upper quartile, 10–90th percentiles. Each gray dot and red triangle represents the number of errors made by an individual control and JAWs animal respectively. Statistical significance tested with Kruskal-Wallis test with post-doc Dunn’s correction multiple comparisons. p – value * = 0.02, ** = 0.002, ns < 0.05. e. Comparison of the total time for which the animal explored the arena (latency) before entering the escape box, during the learning phase on day 1 vs day 7. Box and whisker plots show the median latency of entering the escape box by the cohort of animals (control – black, JAWS – red), lower/upper quartile, 10–90th percentiles. Each gray dot and red triangle represents the latency of an individual control and JAWs animal respectively. Statistical significance tested with Kruskal-Wallis test with post-doc Dunn’s correction multiple comparisons. p – value ** = 0.005, *** = 0.0004, ns < 0.05. f. Comparison of the time that the animals spent exploring the two familiar and similar objects during habituation phase of NOR task. Box and whisker plots show the median exploration time of the cohort of animals during familiar trial (control – black, JAWS – red), lower/upper quartile, 10–90th percentiles. Each gray dot and red triangle represents the exploration time of an individual control and JAWs animal respectively. Statistical significance tested with Wilcoxon matched-pairs signed rank test for both cohorts, p – value = 0.3308 for control, p – value > 0.9999 for JAWs injected animals. g. Comparison of the time that the animals spent exploring the familiar objects during NOR test trial. Box and whisker plots show the median exploration time of the cohort of animals during the NOR test trial (control – black, JAWS – red), lower/upper quartile, 10–90th percentiles. Each gray dot and red triangle represents the exploration time of an individual control and JAWs animal respectively. Statistical significance tested with Mann Whitney test, p – value = 0.2471. h. Box and whisker plots showing the median novel object discrimination index for the cohort of animals (control – black, JAWS – red), lower/upper quartile, 10–90th percentiles during NOR test trial. Each gray dot and red triangle represents the novel object discrimination index an individual control and JAWs animal respectively. Statistical significance tested with unpaired t test with Welch’s correction, p – value < 0.0001. i. Comparison of the time that the animals spent exploring the two familiar and similar objects during habituation phase of NOL task. Box and whisker plots show the median exploration time of the cohort of animals during familiar trial (control – black, JAWS – red), lower/upper quartile, 10–90th percentiles. Each gray dot and red triangle represents the exploration time of an individual control and JAWs animal respectively. Statistical significance tested with paired t-test for both cohorts, p – value = 0.5131 for control, p – value = 0.9661 for JAWs injected animals. j. Comparison of the time that the animals spent exploring the familiar locations during NOL test trial. Box and whisker plots show the median exploration time of the cohort of animals during the NOL test trial (control – black, JAWS – red), lower/upper quartile, 10–90th percentiles. Each gray dot and red triangle represents the exploration time of an individual control and JAWs animal respectively. Statistical significance tested with Mann Whitney test, p – value = 0.7689. k. Box and whisker plots showing the median novel location discrimination index for the cohort of animals (control – black, JAWS – red), lower/upper quartile, 10–90th percentiles during NOR test trial. Each gray dot and red triangle represents the novel location discrimination index an individual control and JAWs animal respectively. Statistical significance tested with unpaired t test with Welch’s correction, p – value = 0.0626.
Fig. 1.
Fig. 1.. Anterograde and retrograde viral tracing identifies a novel hippocampal feedback to superficial layers of entorhinal cortex.
a. Schematic showing the injection strategy (top inset) and the proposed novel circuit. Injection strategy – Sagittal profile of a mouse brain showing hippocampus (HC) in green and entorhinal cortex (EC) in black. CamKII Cre or CamKII Cre x Ai14 mice were injected with AAV 2.5 EF1α-double floxed-ChR2-eYFP into dorsal CA1. Proposed circuit model - a horizontal slice through the mouse brain shows eYFP expressing hippocampal axons (green arrows) project to not only the neurons in ECL5 but also to ECL2/3, the layer which sends direct cortical feed to the HC (gray arrow). ECL5 projects to ECL2/3 (black arrow) while the sensory input from primary sensory cortices enters at ECL1. b. left - Confocal image of hippocampal projections to medial entorhinal cortex (MEC) in a 400 μm horizontal section through the brain of a CamKII Cre mouse injected with AAV 2.5 EF1α-double floxed-ChR2-eYFP into dorsal CA1. The brain slice was stained for GFP to demarcate the hippocampal feedback projections to deep ECL5 and to superficial ECL2/3, and DAPI (nuclear marker). White dotted lines demarcate the different cortical layers. The area within the red dotted box is expanded on the right – Magnified view of the hippocampal projections to ECL5 and ECL2/3 within the red dotted box in the left panel. The hippocampal projections at ECL2/3 appear to have lower immunofluorescence intensity as compared to the projections at ECL5. c. Ratio of mean fluorescence intensity of axonal projections to ECL5 to ECL2/3 presented as a box and whisker plot (median intensity, lower/upper quartile, 10–90th percentiles). Each data point represents one animal. Statistical significance tested with one-sample Wilcoxon signed rank test, p = 0.0010, n = 11. d. Normalized fluorescence intensity of hippocampal axons in EC as a function of distance from pia (n = 11). Bold line flanked by shaded area denote mean fluorescence intensity and SEM respectively. e. Confocal image of hippocampal projections to medial entorhinal cortex (MEC) in a 400 μm horizontal section through the brain of a CamKII Cre mouse injected with AAV 2.2 CAMKII-ChR2-eYFP into dorsal CA1. The brain slice was stained for GFP to demarcate the hippocampal feedback projections to deep ECL5 and to superficial ECL2/3, and DAPI (nuclear marker). White dotted lines demarcate the different cortical layers. The mean immunoflurorescence intensity of hippocampal projection in ECL2/3 (0.43 ± 0.02 a.u.) was half the immunoflurorescence intensity of hippocampal projection in ECL5 (0.83 ± 0.01 a.u.), two-tailed students t-test, p < 0.0001, n = 8. f. Local expression of “TVA-2A-rabies G protein” after injection of AAV-tetO-TVA 2AG to ECL2/3. 2A positive cells were found primarily in ECL3 and in smaller amounts in ECL2, but rarely outside of these two layers. g. GFP expression in presynaptic cells after injection with AAV-tetO-TVAG followed by ΔG-rRB-GFP. Presynaptic cells were primarily found in deep layers of MEC, Presubiculum (PrS), and CA1. h. Quantification of GFP+ (presynaptic) cells in brain regions that project to starter neurons in MECL2/3. MEC L5/6 – medial entorhinal cortex layer 5/6, pre-postSub – pre-post Subiculum, cPre-postSub – contralateral pre-post subiculum, paraSub – parasubiculum, MEC L3 – MEC layer 3, LEC L2 – lateral entorhinal cortex layer 2, sub – subiculum, MEC L2 – MEC layer 2, AD thalamus – anterodorsal thalamus, M septum – medial septum, RSC – retrospenial cortex, PIR/EPd – piriform cortex/ dorsal endopiriform.
Fig. 2.
Fig. 2.. Hippocampal feedback recruit strong excitation upon ECL5 neurons, but predominantly feed-forward inhibition upon ECL2/3 neurons.
a. Schema of physiology experiments to parse the HC-to-EC reciprocal feedback. ChR2 expressing hippocampal axons (green arrows) were optically stimulated with 470 nm light pulse (2 ms; blue circles) while light-evoked electrical responses are recorded from patch-clamped neurons in ECL5 or ECL2/3. b – c. HC-ECL5 feedback has a higher probability of a functional connection and greater synaptic strength than HC-ECL2/3. Light-evoked response was detected in 60/61 (98.36 %) ECL5 neurons when optically stimulating ChR2+ HC projections in ECL5 (b top), with 13/47 (27.66%) of neurons firing action potentials (AP; b inset). Whereas, optical stimulation of hippocampal projections elicited light evoked responses in 49/56 (87.50 %) ECL2/3 neurons (c top), but never led to AP firing. Sample traces of post-synaptic potentials (PSPs) in ECL5 (black; b bottom) and ECL2/3 (blue; c bottom) neurons with increasing LED light intensity. Each recorded cell was filled with biocytin and immunostained post-hoc using streptavidin conjugated with a fluorophore for visualization. Reconstructed neuronal morphology, and firing and sag properties were used to identify pyramidal neurons in ECL5 (black cell fill in b) and ECL2/3 (blue cell fill in c). d. Peak amplitudes of light-evoked PSPs in ECL5 (black) vs. ECL2/3 (blue) neurons presented as box and whisker plots (median intensity, lower/upper quartile, 10–90th percentiles). Each data point represents mean peak PSP amplitude of an individual neuron. Statistical significance tested with Mann Whitney test, p<0.0001. Data from only pyramidal neurons both in ECL5 and ECL2/3 were analyzed. e. Higher probability of monosynaptic connection between the HC and ECL5 than HC and ECL2/3 determined by the persistence of light-evoked responses even in the presence of TTX and 4-AP that block AP and membrane repolarization respectively, hence blocking polysynaptic response. 18/22 (81.82 %) ECL5 neurons (black) were monosynaptically connected to HC (top) while only 9/22 (40.91 %) ECL2/3 (blue) received direct monosynaptic HC feedback (bottom). f. Representative traces of excitatory and inhibitory postsynaptic currents (EPSC and IPSC respectively) recorded at −80 mV and +10 mV respectively from voltage clamped ECL5 (left) and ECL2/3 (right) neurons. Insets show parts of the traces enclosed in the dotted box. g. ECL5 and ECL2/3 neurons have comparable light-evoked IPSC amplitudes but EPSC amplitude at HC-ECL5 synapse is significantly greater than at HC-ECL2/3 synapse. Peak amplitudes of PSCs in ECL5 (EPSC in black; IPSC in gray) vs. ECL2/3 (EPSC in blue; IPSC in light blue) neurons presented as box and whisker plots (median intensity, lower/upper quartile, 10–90th percentiles). Each data point represents mean peak PSC amplitude of an individual neuron. Statistical significance tested with unpaired t-test, ns- not significant, **p = 0.005. Data points connected by dotted lines represent a subset of neurons from which both EPSCs and IPSCs were recorded. h. Excitation to inhibition (E/I) ratio is significantly smaller at HC-ECL2/3 than at HC-ECL5. E/I ratio in ECL5 (black) vs. ECL2/3 (blue) neurons presented as box and whisker plots (median intensity, lower/upper quartile, 10–90th percentiles). Each data point represents the E/I ratio of an individual neuron. Statistical significance tested with unpaired t-test with Welch’s correction, *p = 0.01. Only the neurons from which both EPSC and IPSC were recorded (represented as data points connected by dotted lines in panel g) were included in the E/I ratio analysis.
Fig. 3.
Fig. 3.. HC-ECL2/3 feedback heterosynaptically modulates the sensory output in the EC.
a – b. Schematic showing experimental protocol – optical activation of hippocampal inputs (green) was coupled to the electrical stimulation of sensory inputs (red) at an interval of 20 ms for 90 s at 1 Hz in ECL2/3 (a) and ECL5 (b) neurons. c. Post coupling, the sensory evoked response in ECL2/3 significantly potentiates (one sample Wilcoxon signed rank test, p – value = 0.03) while the hippocampal input evoked response remains unchanged (one sample t-test, p – value = 0.48). Sensory evoked response in ECL2/3 also shows an increased probability to generate action potentials (AP; Wilcoxon matched-pairs signed rank test, p – value = 0.03) with no change in the hippocampal input evoked spike probability (both pre- and post-coupling spike probability = 0). d. Post coupling, both the hippocampal (one sample t-test, p – value = 0.0094) and the sensory input evoked responses (one sample t-test, p – value = 0.011) show significant potentiation at ECL5 neurons but there is no significant change in AP firing probability in either case (HC evoked response: Wilcoxon matched-pairs signed rank test, p – value = 0.50; sensory input evoked response: both pre- and post-coupling spike probability = 0). e. Schema of the rate based circuit model comparing the weights (w1 and w2) of two sensory inputs (S1 and S2) onto the read-out neuron in ECL2/3 to simulate the ITDP observed in acute slices (a, c). f. Case 1: Slice simulation – HC-ECL2/3 is intact but ECL2/3-HC connections are severed due to plane of sectioning simulating the acute slice condition. Pairing HC feedback with S1 sensory input leads to potentiation of S1 and increased weight w1 with higher readout (behavioral output), while the unpaired S2 sensory input and its read-out remain unchanged. g. Case 2: Iterative HC-EC loop – Case 1 likely underestimates the effect due to severed axons (connections) between EC and HC. Upon simulating an intact ECL2/3-HC-ECL2/3 loop, pairing HC feedback with S1 sensory input leads to a higher potentiation of S1 than seen in case 1 and increased w1.
Fig. 4.
Fig. 4.. in vivo optogenetic silencing of the HC-ECL2/3 circuit impairs novelty detection in object recognition and object-place association tasks.
a. Schema showing injection of recombinant AAV 2.5 JAWs-KGC-GFP-ER2 in the dorsal CA1 region of the Hippocampus (HC) and optical silencing of hippocampal projections (green arrow) expressing red-shifted halorhodopsin JAWS using red-light (680 nm) delivered through optical fibers (position marked by the red spot) of diameter 200 nm, placed over in entorhinal cortex layer 2/3 (ECL2/3). b. Representative confocal image of a horizontal brain slice from a mouse in the experimental cohort where JAWS-GFP was injected into dorsal CA1. GFP+ hippocampal axons can be seen in ECL5 and ECL2/3. The hole (white arrow head) in ECL2/3 marks the position of the optical fiber through which red-light was delivered to silence HC-ECL2/3 circuit. c. Experimental design of Barnes maze test. In the “learning” phase (day 1–7) animal is placed in the escape box for 1 min. Then the animal is placed at the center of the maze and allowed to freely explore the maze and its holes for 3 minutes or until it finds the escape hole (data not shown). In the “test” phase, animal is allowed to explore the maze until it finds the escape hole. During this test phase, laser light pulse of 625 nm is delivered to both control and JAWS injected animals. d. Comparison of the total number of errors made by the animal counted as the number of times it explores different holes including the escape hole without entering the escape box, in “test” phase. Box and whisker plots show the median number of errors made by the cohort of animals (control – black, JAWS – red), lower/upper quartile, 10–90th percentiles. Each gray dot and red triangle represents the number of errors made by an individual control and JAWs animal respectively. Statistical significance tested with Mann Whitney test, p – value = 0.9835. e. Comparison of the total time for which the animal explored the arena (latency) before entering the escape box, in “test” phase. Box and whisker plots show the median latency of entering the escape box by the cohort of animals (control – black, JAWS – red), lower/upper quartile, 10–90th percentiles. Each gray dot and red triangle represents the latency of an individual control and JAWs animal respectively. Statistical significance tested with Mann Whitney test, p – value = 0.9265. f. Experimental design of Novel Object Recognition (NOR) test. In the “habituation” phase (day 1–2) the animal is placed in an open field arena (without any objects) and allowed to freely explore the arena for 10 minutes each day. In the “test” day (day 3) the animal is placed in the arena with two identical objects. Animals are allowed to explore and familiarize with the objects for 10 minutes. After 30 minutes of rest in home cage, the animal is placed in the arena but one of the objects is replaced with a novel and different object. Animals are allowed to freely explore the two objects for 10 minutes. During this “test” phase, laser light pulse of 625 nm is delivered to both control and JAWS injected animals. g. Experimental design of Novel Object Location (NOL) test. In the ‘habituation’ phase (day 1–2) the animal is placed in an open field arena (without any objects) and allowed to freely explore the arena for 10 minutes each day. In the ‘test’ day (day 4) the animal is first placed in the arena with two identical objects. The animal is allowed to explore and familiarize itself with the objects for 10 minutes. 30 minutes after the animal is removed from the arena one of the two ‘familiar’ objects is moved to a new location in the arena. The animal is again allowed to explore the two object locations for ten minutes. During this test phase, laser light pulse of 625nm is delivered to both control and JAWS injected animals. h. Comparison of the time that the animals spent exploring the familiar vs novel objects during the test trial of the NOR task. Box and whisker plots show the median exploration time of the cohort of animals (control – black, JAWS – red), lower/upper quartile, 10–90th percentiles. Each gray dot (solid – familiar object, open – novel object) and red triangle (solid – familiar object, open – novel object) represents the exploration time of an individual control and JAWs animal respectively. Statistical significance tested with Wilcoxon matched-pairs signed rank test for both cohorts, p – value = 0.0007 for control, p – value = 0.0425 for JAWs injected animals. i. Box and whisker plots showing the median novel object recognition index for the cohort of animals (control – black, JAWS – red), lower/upper quartile, 10–90th percentiles during NOR test trial. Each gray dot and red triangle represents the NOR index an individual control and JAWs animal respectively. Statistical significance tested with unpaired t-test, p – value <0.0001. j. Comparison of the time that the animals spent exploring the familiar vs novel object locations during the test trial of the NOL task. Box and whisker plots show the median exploration time of the cohort of animals (control – black, JAWS – red), lower/upper quartile, 10–90th percentiles. Each gray dot (solid – familiar object location, open – novel object location) and red triangle (solid – familiar object location, open – novel object location) represents the exploration time of an individual control and JAWs animal respectively. Statistical significance tested with Wilcoxon matched-pairs signed rank test for both cohorts, p – value = 0.0002 for control, p – value = 0.1726 for JAWs injected animals. k. Box and whisker plots showing the median novel object location index for the cohort of animals (control – black, JAWS – red), lower/upper quartile, 10–90th percentiles during NOL test trial. Each gray dot and red triangle represents the NOL index an individual control and JAWs animal respectively. Statistical significance test with unpaired t-test, p – value = 0.0475.

References

    1. Suh J., Rivest A. J., Nakashiba T., Tominaga T. & Tonegawa S. Entorhinal cortex layer III input to the hippocampus is crucial for temporal association memory. Science 334, 1415–1420 (2011). - PubMed
    1. Buzsáki G. & Moser E. I. Memory, navigation and theta rhythm in the hippocampal-entorhinal system. Nat. Neurosci. 16, 130–138 (2013). - PMC - PubMed
    1. Igarashi K. M., Lu L., Colgin L. L., Moser M.-B. & Moser E. I. Coordination of entorhinal-hippocampal ensemble activity during associative learning. Nature 510, 143–147 (2014). - PubMed
    1. Remondes M. & Schuman E. M. Role for a cortical input to hippocampal area CA1 in the consolidation of a long-term memory. Nature 431, 699–703 (2004). - PubMed
    1. Squire L. R. & Wixted J. T. The cognitive neuroscience of human memory since H.M. Annu. Rev. Neurosci. 34, 259–288 (2011). - PMC - PubMed

Publication types