. 2023 Aug 22:14:1184167.
doi: 10.3389/fimmu.2023.1184167. eCollection 2023.

Integration of single-cell RNA sequencing and bulk RNA transcriptome sequencing reveals a heterogeneous immune landscape and pivotal cell subpopulations associated with colorectal cancer prognosis

Affiliations

Integration of single-cell RNA sequencing and bulk RNA transcriptome sequencing reveals a heterogeneous immune landscape and pivotal cell subpopulations associated with colorectal cancer prognosis

Qian Zhang et al. Front Immunol. .

Abstract

Introduction: Colorectal cancer (CRC) is a highly heterogeneous cancer. The molecular and cellular characteristics differ between the colon and rectal cancer type due to the differences in their anatomical location and pathological properties. With the advent of single-cell sequencing, it has become possible to analyze inter- and intra-tumoral tissue heterogeneities.

Methods: A comprehensive CRC immune atlas, comprising 62,398 immune cells, was re-structured into 33 immune cell clusters at the single-cell level. Further, the immune cell lineage heterogeneity of colon, rectal, and paracancerous tissues was explored. Simultaneously, we characterized the TAM phenotypes and analyzed the transcriptomic factor regulatory network of each macrophage subset using SCENIC. In addition, monocle2 was used to elucidate the B cell developmental trajectory. The crosstalk between immune cells was explored using CellChat and the patterns of incoming and outgoing signals within the overall immune cell population were identified. Afterwards, the bulk RNA-sequencing data from The Cancer Genome Atlas (TCGA) were combined and the relative infiltration abundance of the identified subpopulations was analyzed using CIBERSORT. Moreover, cell composition patterns could be classified into five tumor microenvironment (TME) subtypes by employing a consistent non-negative matrix algorithm. Finally, the co-expression and interaction between SPP1+TAMs and Treg cells in the tumor microenvironment were analyzed by multiplex immunohistochemistry.

Results: In the T cell lineage, we found that CXCL13+T cells were more widely distributed in colorectal cancer tissues, and the proportion of infiltration was increased. In addition, Th17 was found accounted for the highest proportion in CD39+CD101+PD1+T cells. Mover, Ma1-SPP1 showed the characteristics of M2 phenotypes and displayed an increased proportion in tumor tissues, which may promote angiogenesis. Plasma cells (PCs) displayed a significantly heterogeneous distribution in tumor as well as normal tissues. Specifically, the IgA+ PC population could be shown to be decreased in colorectal tumor tissues whereas the IgG+ PC one was enriched. In addition, information flow mediated by SPP1 and CD44, regulate signaling pathways of tumor progression. Among the five TME subtypes, the TME-1 subtype displayed a markedly reduced proportion of T-cell infiltration with the highest proportion of macrophages which was correlated to the worst prognosis. Finally, the co-expression and interaction between SPP1+TAMs and Treg cells were observed in the CD44 enriched region.

Discussion: The heterogeneity distribution and phenotype of immune cells were analyzed in colon cancer and rectal cancer at the single-cell level. Further, the prognostic role of major tumor-infiltrating lymphocytes and TME subtypes in CRC was evaluated by integrating bulk RNA. These findings provide novel insight into the immunotherapy of CRC.

Keywords: Treg; colorectal cancer; immune landscape; plasma B cell; single cell; tumor-associated macrophages.


Conflict of interest statement

The authors declare that the research was conducted in the absence of any commercial or financial relationships that could be construed as a potential conflict of interest.

Figures

Figure 1
Figure 1
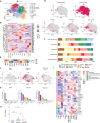
Landscape of immune cells in the microenvironment of colon cancer, rectal cancer, and adjacent normal tissues at the single-cell transcription level. (A)Schematic diagram explaining the workflow of the experimental design. (B) t-SNE (t-distributed Stochastic Neighbor Embedding) plot of 62,398 high-quality immune cells showing the major immune cell type clusters in the tumor microenvironment (TME) of colorectal cancer (CRC) and adjacent normal tissues, color-coded by dataset, tissue types, and patients. (C) t-SNE plots showing the expression levels of representative marker genes for major immune cell clusters, color-coded by gene expression levels. (D) Stacked bar plots showing the cell fractions of major immune cell types in colon cancer, rectal cancer, and adjacent normal samples. (E) Bubble plot showing the average expression level of the top 5 marker genes for the 10 major immune cell clusters.
Figure 2
Figure 2
Characterization of phenotypes of T cells and NK cells in colon cancer, rectal cancer and adjacent normal tissues. (A) t-SNE plot of a total of 32,879 T cells re-clustered into 10 clusters and 1,898 NK cells re-clustered into 2 clusters using color-coded by cell type. (B) t-SNE projections showing the expression and distribution of phenotypic marker genres CD39, CD103, and PD1 in T andNK clusters. Each dot represents a cell defined as positive expression of marker genes. (C) Stacked bar plots displaying the percentages of each cluster from T and NK subpopulations with different CD39, CD103, and PD1phenotypes. (D) Heatmap showing the expression profile of canonical chemokines and chemokine receptors of T and NK clusters. (E) Heatmap demonstrating the expression characteristics of special functional genes in two NK subgroups with different phenotypes (F) t-SNE projections of CXCL13 expression distribution in normal, colon and rectal tissues. (G) Box plot comparing the expression levels of CXCL13 in T andNK lineage among calculated using Kruskal-Wallis test, ***p< 0.001, ns p > 0.05. (H) Fractions of CXCL13+ cells among T andNK subpopulations in different tissues from scRNA-seq datasets. (I) Heatmap of the relative expression of function related genes, including naïve, cytotoxic, exhaustion, co-stimulatory and resident in T andNK cell subsets.
Figure 3
Figure 3
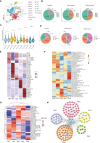
Identification of the heterogeneity of myeloid cells in colon cancer, rectal cancer, and adjacent normal tissues. (A) t-SNE plot of 10,514 myeloid cells re-clustered into 15 clusters. (B) Pie chart presenting the proportion of five different phenotypes macrophage in the whole macrophage lineage. (C) Violin plot comparing the scores of M1 and M2 macrophage clusters by wilcox. test, ***p < 0.001, ns p > 0.05. (D) Pie chart presenting the proportion of four different dendritic cell (DC) subtypes in the whole DC lineage. (E) Heatmap showing the key differentially expressed genes (DEGs) of each macrophage cluster. (F) Heatmap showing the enriched pathways from hallmark gene sets in macrophage clusters using gene set variation analysis (GSVA). (G) Heatmap of the top 30 regulators with the highest area under curve (AUC) scores showing the activity of transcription factors (TFs) in macrophage clusters using single-cell regulatory network inference and clustering (SCENIC). (H) Protein-protein interaction (PPI) networks of prominent TF-target genes in 5 macrophage clusters.
Figure 4
Figure 4
Characterization of the landscape of B lymphocytes and developmental trajectories of B lineage in CRC. (A) t-SNE projections of 17,107 B cells re-clustered into 6 major clusters. (B) Violin plot of relative expression of key characteristic genes in B lineage clusters. (C) Representative images of fluorescence staining showing the expression and distribution of IgA and IgG in normal intestinal tissue (left) and CRC tissue (right), respectively. Red representing IgA, green representing IgG, and blue representing DAPI, scale bar=50μm. (D) Statistical analysis results of immunofluorescence staining indicating the average expression of IgA decreased in CRC tissues compared with normal intestinal epithelium (left), whereas the average expression of IgG increased (middle), and the expression of IgG higher than that of IgA in tumor stroma (left). (E) Developmental trajectories of B lineage inferred using monocle2, each cell subtype marked with a different color. (F) Cell density variation of B cell subtypes during the pseudotime (top), pseudo-heatmap of the representative DEGs in differentiation branches (left bottom), Gene Ontology (GO) functional enrichment analysis of DEGs re-clustered into 4 clusters (right bottom). (G) Pseudo-scatter plots showing the expression variation and distribution of some specific genes during the pseudotime, color-coded by cell types.
Figure 5
Figure 5
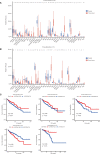
Relative infiltration abundance and prognostic significance of 33 immune cell subpopulations revealed by CIBERSORT deconvolution algorithm. (A) Relative infiltration abundance of 33 immune cell subpopulations identified by ScRNA-seq data in 480 colon cancer tissues and 41 adjacent tissues from the COAD cohort. (B) Relative infiltration abundance of 33 immune cell subpopulations identified by single-cell data in 167 colon cancer tissues and 10 adjacent tissues from the READ cohort, *p < 0.05, **p< 0.01, ***p< 0.001, ****p< 0.0001, and ns p > 0.05. (C) Kaplan-Meier overall survival curves of 460 patients in the TCGA-COAD cohort and 172 patients in the TCGA-READ cohort divided into the high infiltration group and low infiltration group, *p < 0.05.
Figure 6
Figure 6
Immune cell characteristics and prognostic significance of TME subtypes in CRC. (A) Heatmap showing unsupervised clustering of 5 TME subtypes of immune patterns in the TCGA cohort, with the rows representing the 33 immune subpopulations identified by the ScRNA-seq data set, and the columns representing 647 CRC patients from the TCGA-COAD and READ cohorts; hierarchical clustering according to TME subtype, histological site, disease stage, tumor-node-metastasis (TNM) stage, and age. (B) Consensus matrix heatmap representing the consensus matrix with k=5 by consensus clustering; the range of value from 0 to 1 implying the probability in the same cluster with the color scaling from white to dark blue. (C) Kaplan-Meier overall survival curves of 5 TME subtypes in TCGA-COAD and READ cohorts. (D-F) Violin plot showing the representative immune cell abundance of 5 TME subtypes, including macrophages (D), T cells (E), and CD8+ Tex cells (F), compared by Kruskal-Wallis test.
Figure 7
Figure 7
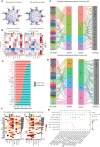
CellChat analysis of the crosstalk between immune cells in colon cancer or rectal cancer. (A) Comparisons of overall changes in cell-cell communication between rectal cancer and colon cancer, including the differential number of interactions (left) and differential interaction strength (right) between immune cells of rectal cancer compared with colon cancer, with the blue line representing reduced communication in rectal cancer compared to colon cancer, while the red line representing increased communication in rectal cancer compared to colon cancer. (B) Heatmaps showing the interaction number (left) and interaction strength (right) between colon cancer and rectal cancer, with the top color bar representing the sum of the column values displayed in incoming signals and the right color bar representing the sum of outgoing signals, red or blue indicating increased or decreased signal of colon cancer compared with normal control. (C) Outgoing signal pattern of immune cells acting as secretory cells, and the pattern corresponding to signaling pathways. (D) Incoming signal pattern of immune cells acting as target cells, and the pattern corresponding to signaling pathways; the thickness of the flow indicating the contribution to each pattern. (E) Differences in the overall signaling pathway between colon cancer and rectal cancer, with the ranking indicating the importance of the pathways; red indicating the signaling pathways enriched in colon cancer, green representing the signaling pathways enriched in rectal cancer, and black representing no difference in signaling pathway enrichment in colon cancer and rectal cancer. (F) Heatmaps of the overall signaling pathway of each immune cell subpopulation mediated by individual signaling pathway in colon cancer (left) and rectal cancer (right). (G) Communication probabilities of important ligand-receptor pairs from macrophages to individual immune cells in colon and rectal cancers, with the dot color reflecting the communication probability, blank indicating the communication probability zero, and dot size representing the p value.
Figure 8
Figure 8
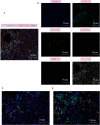
Multiplex immunofluorescence showing the interaction between SPP1+TAM and Foxp3+Treg in the TME of CRC. (A, B) Multiplex immunofluorescence images demonstrating the localization of different cell populations in CRC, using typical marker genes including Panck (white), CD44 (cyan), CD163 (yellow), SPP1(red), Foxp3 (green), DAPI (blue), scale bar=50µm; (C) Representative images of SPP1-CD44 mediated co-localization of cell populations in CRC patients, scale bar=20µm; (D) Representative images of interaction of SPP1+TAM and Foxp3+Treg cells in the CD44 enriched regions, scale bar=20µm.

Similar articles

Cited by

References

    1. Siegel R, Miller K, Fuchs H, Jemal A. Cancer statistics, 2022. CA Cancer J Clin (2022) 72:7–33. doi: 10.3322/caac.21708 - DOI - PubMed
    1. Miller K, Nogueira L, Devasia T, Mariotto A, Yabroff K, Jemal A, et al. . Cancer treatment and survivorship statistics, 2022. CA Cancer J Clin (2022) 72:409–36. doi: 10.3322/caac.21731 - DOI - PubMed
    1. Costales-Carrera A, Fernandez-Barral A, Bustamante-Madrid P, Dominguez O, Guerra-Pastrian L, Cantero R, et al. . Comparative study of organoids from patient-derived normal and tumor colon and rectal tissue. Cancers (2020) 12:2302-22. doi: 10.3390/cancers12082302 - DOI - PMC - PubMed
    1. Stintzing S, Tejpar S, Gibbs P, Thiebach L, Lenz HJ. Understanding the role of primary tumour localisation in colorectal cancer treatment and outcomes. Eur J Cancer (2017) 84:69–80. doi: 10.1016/j.ejca.2017.07.016 - DOI - PMC - PubMed
    1. Imperial R, Ahmed Z, Toor OM, Erdogan C, Khaliq A, Case P, et al. . Comparative proteogenomic analysis of right-sided colon cancer, left-sided colon cancer and rectal cancer reveals distinct mutational profiles. Mol Cancer (2018) 17:177. doi: 10.1186/s12943-018-0923-9 - DOI - PMC - PubMed

Publication types