. 2023 Aug 22:14:1235675.
doi: 10.3389/fimmu.2023.1235675. eCollection 2023.

Live-cell imaging reveals single-cell and population-level infection strategies of Listeria monocytogenes in macrophages

Affiliations

Live-cell imaging reveals single-cell and population-level infection strategies of Listeria monocytogenes in macrophages

Josephine Moran et al. Front Immunol. .

Abstract

Pathogens have developed intricate strategies to overcome the host's innate immune responses. In this paper we use live-cell microscopy with a single bacterium resolution to follow in real time interactions between the food-borne pathogen L. monocytogenes and host macrophages, a key event controlling the infection in vivo. We demonstrate that infection results in heterogeneous outcomes, with only a subset of bacteria able to establish a replicative invasion of macrophages. The fate of individual bacteria in the same host cell was independent from the host cell and non-cooperative, being independent from co-infecting bacteria. A higher multiplicity of infection resulted in a reduced probability of replication of the overall bacterial population. By use of internalisation assays and conditional probabilities to mathematically describe the two-stage invasion process, we demonstrate that the higher MOI compromises the ability of macrophages to phagocytose bacteria. We found that the rate of phagocytosis is mediated via the secreted Listeriolysin toxin (LLO), while the probability of replication of intracellular bacteria remained constant. Using strains expressing fluorescent reporters to follow transcription of either the LLO-encoding hly or actA genes, we show that replicative bacteria exhibited higher PrfA regulon expression in comparison to those bacteria that did not replicate, however elevated PrfA expression per se was not sufficient to increase the probability of replication. Overall, this demonstrates a new role for the population-level, but not single cell, PrfA-mediated activity to regulate outcomes of host pathogen interactions.

Keywords: Listeria monocytogenes; PrfA regulon; listeriolysin; macrophage; phagocytosis; single cell heterogeneity.


Conflict of interest statement

The authors declare that the research was conducted in the absence of any commercial or financial relationships that could be construed as a potential conflict of interest.

Figures

Figure 1
Figure 1
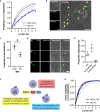
Heterogeneous outcomes of L. monocytogenes infection of macrophages at the single cell level. (A) Schematic representation of infection protocol: 1) RAW 264.7 macrophages infected with Lm-GFP at an MOI of 0.25; 2) Cells and Lm-GFP are incubated for 45 mins; 3) Non-adherent Lm-GFP are washed away and fresh media containing gentamicin is added to inhibit growth of extracellular bacteria (referred herein as t0); 4) Sample is imaged by time-lapse confocal microscopy for 5 h to determine infection outcomes. (B) Representative live-cell microscopy images of RAW 264.7 macrophages (brightfield) infected with Lm-GFP (green) from times 0-5 h post gentamicin treatment. White arrows- non-replicative Lm-GFP present at t0; white boxes-replicative foci and black arrow: single Lm-GFP not visible at t0. The right panels show magnified examples of the 3 outcomes resulting in: (1) replicative infection; (2) non-replicative infection and (3) disappearance. Scale 20μM. (C) Proportion of different single cell infection outcomes as depicted in b evaluated at 5 h as a function of the total Lm-GFP interactions at t0. Data from four replicates (from 358 individual interactions) shown in circles with mean and SD as solid lines. (D) Proportion of replicative invasions for primary BMDMs infected with Lm-GFP, evaluated at 5 h as a function of the total Lm-GFP associated with BMDMs at t0 (in comparison to data from c). Triplicate data (from 153 individual interactions) shown in circles with mean and SD as solid lines. Statistical significance (ns = non-significant) assessed using Mann-Whitney rank test. (E) Representative image of actin staining showing: Lm-GFP replicating (arrow pointing down), non-replicating without acting association (arrow pointing left) and non-replicating associated with actin (arrow pointing up). RAW 264.7 macrophages (brightfield) infected with Lm-GFP were fixed at 5 h, permeabilised then stained with anti-Lm (green) and phalloidin-594 (red). Scale bar 10 μM. Images representative of three replicated experiments. (F) Proportions of replicative and non-replicative Lm-GFP at 5 h with or without actin staining colocalization as depicted in e (as a function of the total bacteria). Triplicate data shown in circles with mean and SD as solid lines. (G) Proportions of replicative and non-replicative Lm-GFP at 5 h with or without LAMP1 staining colocalization as depicted in Figure S1 (as a function of the total bacteria). Triplicate data shown in circles with mean and SD as solid lines.
Figure 2
Figure 2
PrfA activity correlates with, but does not determine, infection outcome (A) Representative images of live-cell Lm-dsRed PactA-GFP (PactA) or Lm-dsRed Phly-GFP (Phly) infection of RAW 264.7 macrophages at MOI 0.25. Shown are RAW 264.7 macrophages (brightfield) infected with Lm-dsRed PactA-GFP or Lm-dsRed Phly-GFP (red) and expressing GFP under the control of actA or hly promoter region (green) at 0h, 1h or 2h. Arrows indicate the individual L. monocytogenes or replicative foci, for replicative (pink), non-replicative 1 (black) or non-replicative 2 (teal). Scale bar 10 μM. (B) Reporter expression trajectories over time for representative individual Lm-dsRed PactA-GFP (PactA) or Lm-dsRed Phly-GFP (Phly) and their daughter cells during infection of RAW 264.7 macrophages at MOI 0.25 from 0-2h. Individual tracked bacteria that were replicative (Rep, pink) or non-replicative (no-rep 1, black; no-rep 2, teal) indicated by circles and correspond to the images in (A) GFP intensities measured as relative fluorescence units (RFU) every 5 min, for up to 12 (PactA) or 10 (Phly) replicative daughter cells. Mean RFU (solid lines) and time of first replication (dotted line) also shown. (C) Reporter fluorescence expression for Lm-dsRed PactA-GFP (PactA) or Lm-dsRed Phly-GFP (Phly) cells during infection of RAW 264.7 macrophages at MOI 0.25. Data from 3 replicate experiments for individual non-replicative bacteria (black circles, total 37 for Phly, 17 for PactA) or representative individual bacteria from all replicative foci (pink circles, total 16 for Phly, 7 for PactA) and their mean (solid lines) shown for 0, 1 and 2h. GFP intensities measured as relative fluorescence units (RFU). Statistical significance (ns = non-significant, ** = p-value <0.01, **** = p-value <0.0001) assessed using Mann-Whitney rank test. (D) Reporter fluorescence expression by time before/after first replication for Lm-dsRed PactA-GFP (PactA) or Lm-dsRed Phly-GFP (Phly) during infection of RAW 264.7 macrophages at MOI 0.25. Data from 3 replicates for representative individual bacteria from all replicative foci (pink circles), simple linear regression for replicative data (pink solid line) and average non-replicative expression (black broken line) shown (with corresponding correlation coefficient R2). GFP intensities measured as relative fluorescence units (RFU). (E) Proportion of WT or PrfA* Lm-GFP replicating upon infection of RAW 264.7 or BMDM primary macrophages at MOI 0.25. Individual data from three experiments (circles) with mean and SD (solid lines). Statistical significance assessed with Mann-Whitney rank test.
Figure 3
Figure 3
Individual bacteria exhibit independent fates in the same host cell (A) Experimental rationale: fates of red and green L. monocytogenes in the same host cell determine pathogen and host contribution to replicative invasion. If both bacteria share the same fate in the same host cell, the host environment controls the outcome, if fates are independent, bacteria control the outcome. (B) Representative images of different outcomes of RAW 264.7 macrophages simultaneously infected with Lm-dsRed and Lm-GFP at combined MOI 5 (at 1:1 ratio). Shown are the mean proportion and SDs of different infection outcomes of triplicate data subset of cells with one Lm-dsRed and one Lm-GFP at t0 (total 167 cells). Scale bar 10 μM. (C) Quantification of the replication probability for multiple invasion events per host cell. Representative images of data from b, with cells harbouring 1-4 bacteria at t0. Increased pathogen number over time (as highlighted on the image) indicates that at least one bacterium replicated. Scale bar 10 μM. (D) Schematic representation of collective invasion strategies: (1) Cooperative invasion: multiple bacteria in the same cell promote each other’s replication, leading to increased replication probability; (2) non-cooperative invasion: bacterial replication is independent in the same host (probability of replication given by statistical independence pn=1-(1-p0)n, where n is the number of bacteria, p0 replication probability for 1 bacteria); (3) inhibitory invasion: reduced bacterial replication probability as number of bacteria increases due to enhanced immune response. (E) Probability that at least one L. monocytogenes replicates as a function of number of bacteria per host cell at t0. Shown in black are observed probabilities (mean and SDs, based on three replicate experiments). Solid pink line depicts expected probabilities assuming statistical independence, and 95% confidence intervals in broken lines.
Figure 4
Figure 4
Phagocytosis affects internalisation of bacteria (A) Probability of replication depends on MOI. Shown is the probability at least one L. monocytogenes replicates as a function of number of bacteria per host cell at t0. Solid black line is the predicted probability (with SDs in broken lines) for MOI 0.25, calculated for multiple invasions per host cell given the replication probability p0 = 0.32 (±0.06) for one bacterium per cell (black circle, from Figure 1C ). Similarly, in blue the observed (circles denoting mean with SDs) and expected (solid line with broken line SDs) probabilities for MOI 5 (from Figure 2E ). (B) Representative images from internalisation assay showing RAW 264.7 macrophages (brightfield) infected with Lm-GFP (green) at MOI 5 fixed at t0 and stained with anti-Lm 594 (red). Scale bar 10 μM. (C) Rate of phagocytosis depends on the MOI. The proportion of intracellular Lm-GFP at t0 for MOI 0.25 and 5.0 (as a function of the total interactions) from assay depicted in (B) Individual data points (circles) from four biological replicates with solid lines indicating mean and SD. Statistical significance (* = p-value <0.05) assessed using Mann-Whitney two sample test. (D) Representative images of live-cell infection with Lm-GFP internalisation staining and infection outcome tracking. Shown are Lm-GFP (green), anti-Lm (blue) and RAW 264.7 (brightfield) infection at MOI 0.25, at indicated times. Scale bar 10 μM. (E) Proportion of replicating bacteria based on the internalisation status as depicted in (D) Shown is proportion replicating of the total Lm-GFP associated with a host cell at t0 (all), proportion of the internalised at t0 (intracellular) or proportion of the bacteria that is associated but are not internalised at t0 (extracellular), evaluated at 5 (H) RAW 264.7 macrophages infected with Lm-GFP at MOI 0.25 using anti-Lm 421 antibody to mark extracellular bacteria at t0. Shown are individual data points (circles) from three replicates with solid lines indicating mean and SD. (F) Schematic representation of the conditional probability of replication based on the probability of replication being adjusted to account for the contribution of probability of internalisation. (G) Phagocytosis rate explains MOI-specific replication probabilities. Shown are conditional probabilities (of replication given internalisation as described in (F) of at least one bacterium replicating as a function of number of bacteria per host cell at t0. Black line indicates the expected probability (mean with SDs) calculated for multiple invasions per host cell given the replication probability p0 = 0.52 ±0.14 (black circle) of internalised bacteria for MOI 0.25 (from Figure 3E ). Solid blue line depicts expected conditional probabilities assuming statistical independence and a single overall internalisation rate (0.28 ±0.04 from (C) based on the probabilities in Figure 2E . Blue circles denote conditional probabilities (mean and SDs, based on three replicate experiments) for MOI 5, calculated from data in Figure 2A based on the proportion of internalised bacteria in Figure S3 . .
Figure 5
Figure 5
Listeriolysin O controls infection outcomes at the population-level (A) Schematic representation of experimental set up for infections with Lm-GFP and Lm-mCherry strains at combined MOI 5 vs Lm-GFP MOI 0.25 control. (B) Proportion of Lm-GFP MOI 0.25 replicating upon infection of RAW 264.7 macrophages for Lm-GFP only (control), or for Lm-GFP when live (+live) or PFA fixed (+dead) Lm-mCherry added for combined MOI 5 (as a function of the total Lm-GFP interactions). Triplicate data (circles) with mean and SD (solid lines). Statistical significance assessed using Kruskal-Wallis ANOVA with Dunn’s correction for multiple comparisons (ns = non-significant, * = p-value<0.05). (C) Proportion of Lm-GFP (MOI 0.25) replicating upon infection of RAW 264.7 macrophages for Lm-GFP only (control), or for Lm-GFP when Δ Lm-mCherry (+Δhly) added for combined MOI 5 (as a function of the total Lm-GFP interactions). Replicate data from four experiments (circles) with mean and SD (solid lines). Statistical significance assessed with Mann-Whitney rank test (ns = non-significant). (D) Proportion of Lm-GFP replicating upon infection of BMDMs at MOI (0.25) (control), or when live WT Lm-mCherry (+live) or Δhly Lm-mCherry (+Δhly) added for combined MOI 5 (as a function of the total Lm-GFP interactions). Data from four experiments (circles) with mean and SD (solid lines). Statistical significance assessed using Kruskal-Wallis ANOVA with Dunn’s correction for multiple comparisons (ns = non-significant, * = p-value<0.05). (E) Proportion of Lm-GFP replicating upon infection of RAW 264.7 macrophages at MOI 0.25 (as a function of the total interactions at t0), with addition recombinant listeriolysin (rLLO). Individual data from four experiments (circles) with mean and SD (solid lines). rLLO at indicated concentrations added with inoculant and removed at t0. Statistical significance assessed using Kruskal-Wallis ANOVA with Dunn’s correction for multiple comparisons (ns = non-significant, ** = p-value<0.01). (F) Proportion of Lm-GFP replicating upon infection of BMDM at MOI 0.25 (as a function of the total Lm-GFP interactions), incubated with 0 or 2 nM rLLO. Individual data from three experiments (circles) with mean and SD (solid lines). rLLO added with inoculant and removed at t0. Statistical significance assessed with Mann-Whitney rank test (* = p-value<0.05). (G) Proportion of WT Lm-GFP and ΔhlyLm-GFP internalised into RAW 264.7 macrophages at MOI 0.25 and 5 (as a function of the total interactions). Data obtained from internalisation assay using anti-Lm 594 staining of infected cells fixed at t0 as depicted in 3b. Values from triplicate data (circles) with mean and SD (solid lines). Statistical significance assessed using Kruskal-Wallis ANOVA with Dunn’s correction for multiple comparisons (ns = non-significant, * = p-value<0.05). (H) Proportion of Lm-GFP internalised into RAW 264.7 macrophages at MOI 0.25 (as a function of the total Lm-GFP interactions) in the presence of recombinant LLO (rLLO). Individual replicate data from four experiments (circles) with mean and SD (solid lines), from internalisation assays using anti-Lm 594 staining of infected cells fixed at t0. rLLO concentration indicated on the graph. Statistical significance assessed using Kruskal-Wallis ANOVA with Dunn’s correction for multiple comparisons (ns = non-significant, * = p-value<0.05).

Similar articles

Cited by

References

    1. Cheng Z, Taylor B, Ourthiague DR, Hoffmann A. Distinct single-cell signaling characteristics are conferred by the MyD88 and TRIF pathways during TLR4 activation. Sci Signaling (2015) 8. doi: 10.1126/scisignal.aaa5208 - DOI - PMC - PubMed
    1. Adamson A, Boddington C, Downton P, Rowe W, Bagnall J, Lam C, et al. . Signal transduction controls heterogeneous NF-[kappa]B dynamics and target gene expression through cytokine-specific refractory states. Nat Commun (2016) 7. doi: 10.1038/ncomms12057 - DOI - PMC - PubMed
    1. Kellogg RA, Tian C, Etzrodt M, Tay Savaş. Cellular decision making by non-integrative processing of TLR inputs. Cell Rep (2017) 19:125–35. doi: 10.1016/j.celrep.2017.03.027 - DOI - PMC - PubMed
    1. Czerkies M, Korwek Z, Prus W, Kochanczyk M, Jaruszewicz-Blonska J, Tudelska K, et al. . Cell fate in antiviral response arises in the crosstalk of IRF, NF-kappaB and JAK/STAT pathways. Nat Commun (2018) 9:493. doi: 10.1038/s41467-017-02640-8 - DOI - PMC - PubMed
    1. Patel P, Drayman N, Liu P, Bilgic M, Tay S. Computer vision reveals hidden variables underlying NF-κB activation in single cells. Sci Adv (2021) 7:eabg4135. doi: 10.3389/fnmol.2013.00002 - DOI - PMC - PubMed

Publication types

LinkOut - more resources