. 2023 Jul 12;5(10):100843.
doi: 10.1016/j.jhepr.2023.100843. eCollection 2023 Oct.

Loss of hepatic FTCD promotes lipid accumulation and hepatocarcinogenesis by upregulating PPARγ and SREBP2

Affiliations

Loss of hepatic FTCD promotes lipid accumulation and hepatocarcinogenesis by upregulating PPARγ and SREBP2

Siying Wang et al. JHEP Rep. .

Abstract

Background & aims: Exploiting key regulators responsible for hepatocarcinogenesis is of great importance for the prevention and treatment of hepatocellular carcinoma (HCC). However, the key players contributing to hepatocarcinogenesis remain poorly understood. We explored the molecular mechanisms underlying the carcinogenesis and progression of HCC for the development of potential new therapeutic targets.

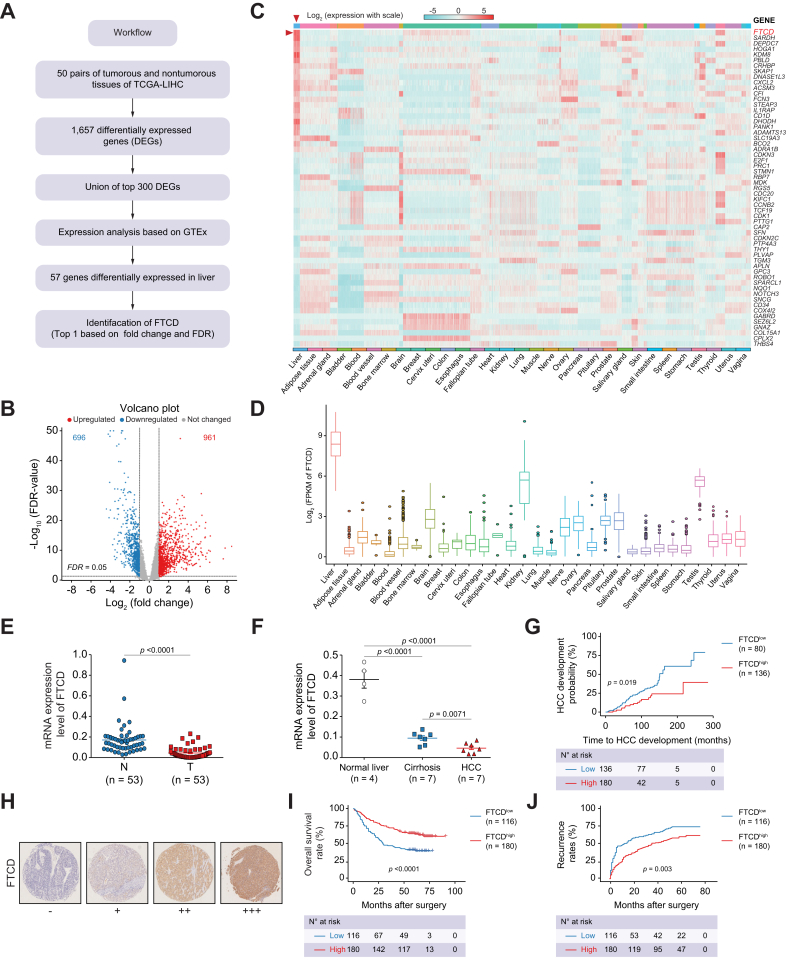
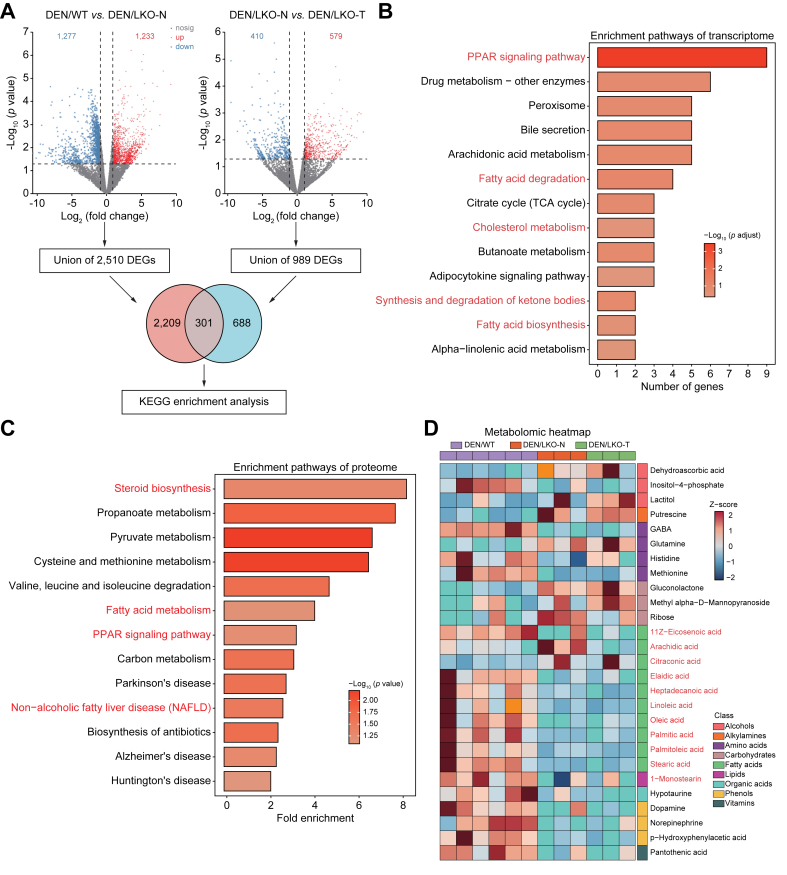
Methods: The Cancer Genome Atlas-Liver Hepatocellular Carcinoma (TCGA-LIHC) and Genotype-Tissue Expression (GTEx) databases were used to identify genes with enhanced expression in the liver associated with HCC progression. A murine liver-specific Ftcd knockout (Ftcd-LKO) model was generated to investigate the role of formimidoyltransferase cyclodeaminase (FTCD) in HCC. Multi-omics analysis of transcriptomics, metabolomics, and proteomics data were applied to further analyse the molecular effects of FTCD expression on hepatocarcinogenesis. Functional and biochemical studies were performed to determine the significance of loss of FTCD expression and the therapeutic potential of Akt inhibitors in FTCD-deficient cancer cells.

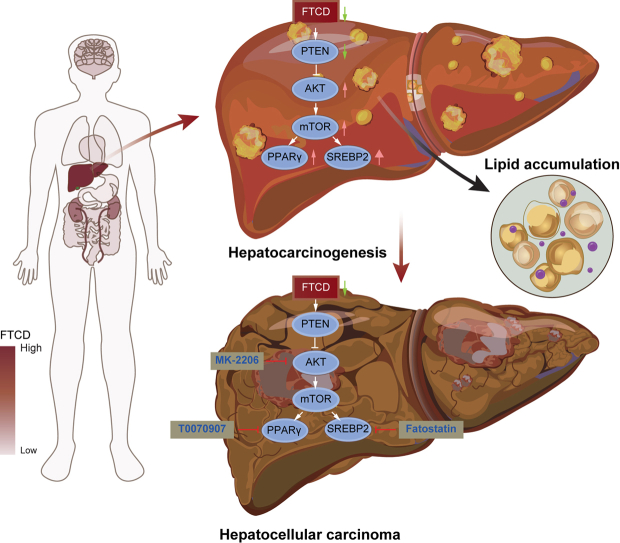
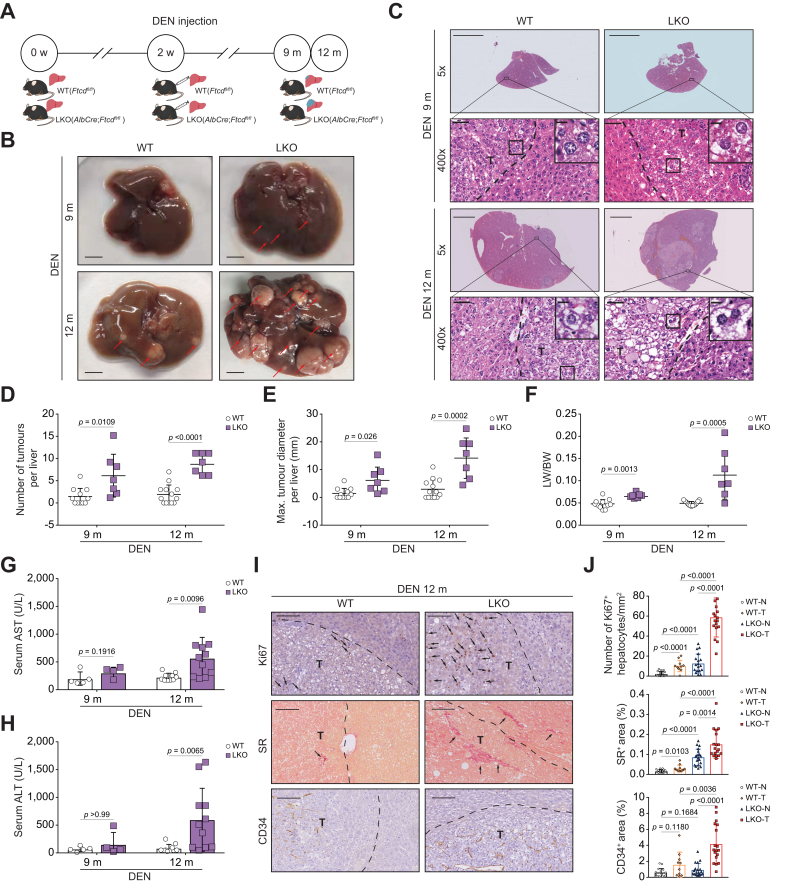
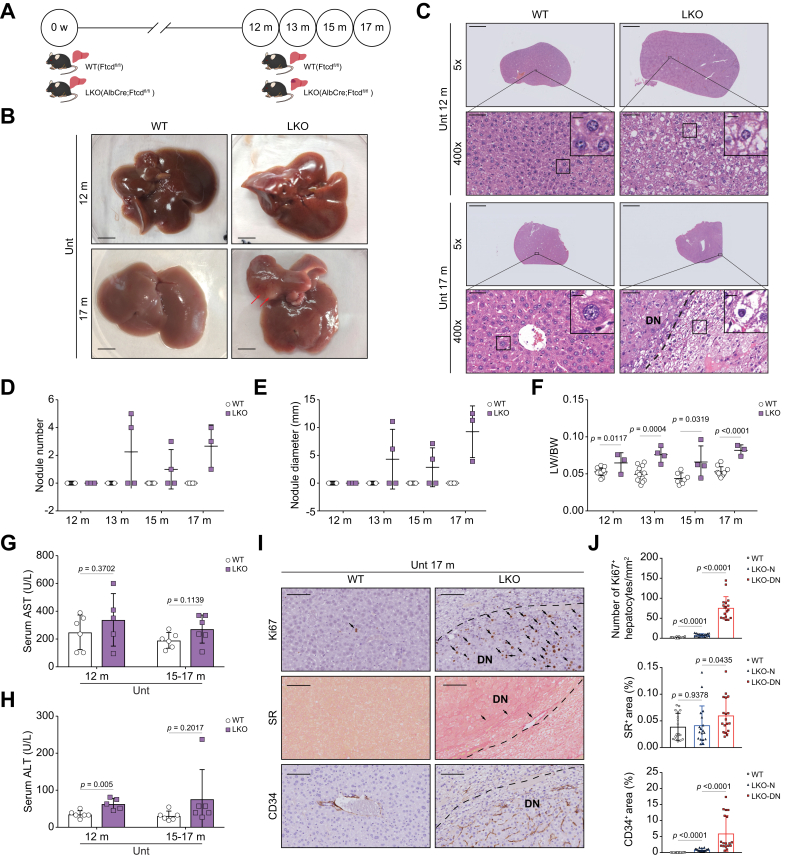
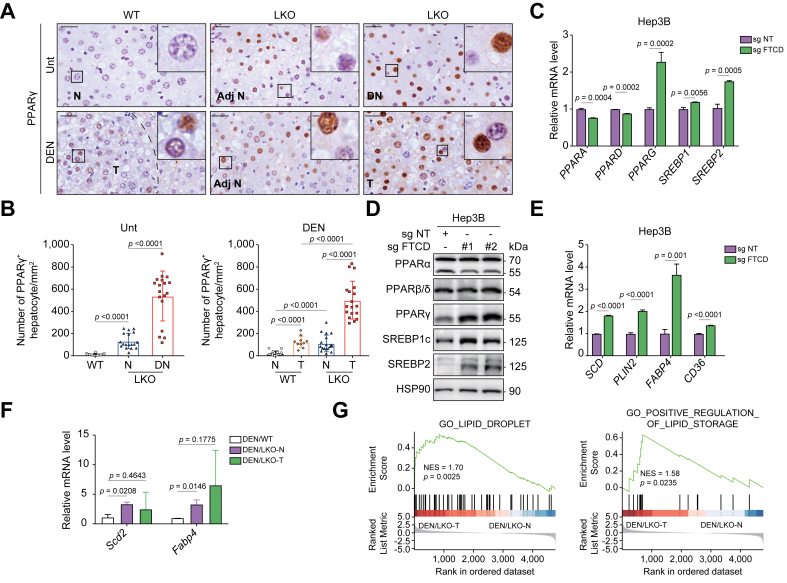
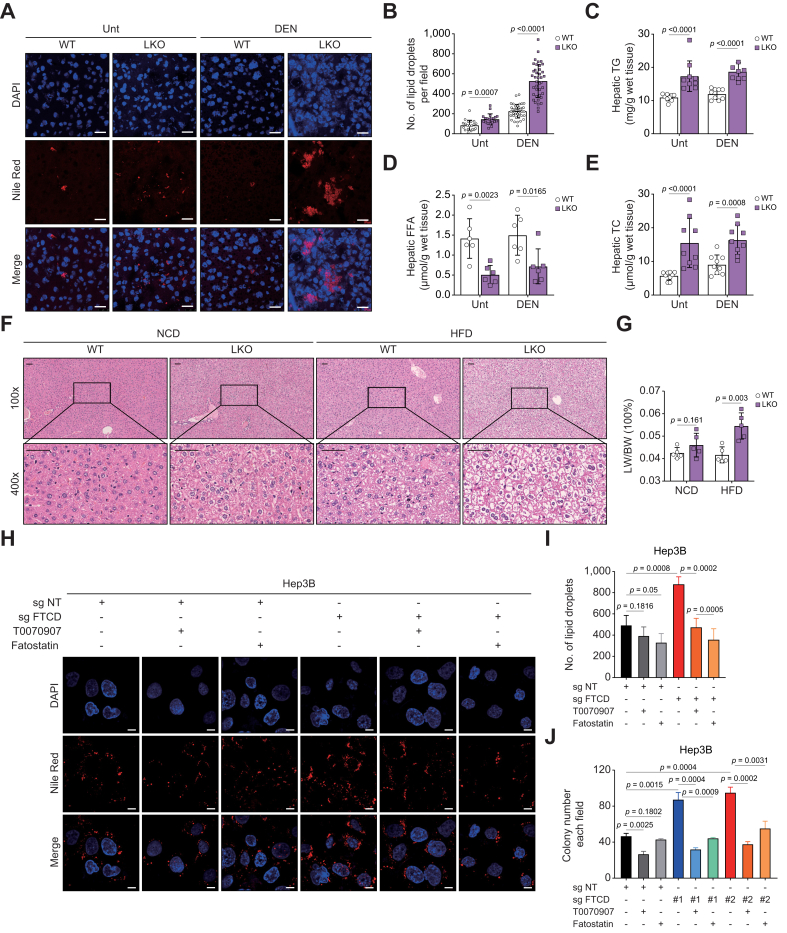
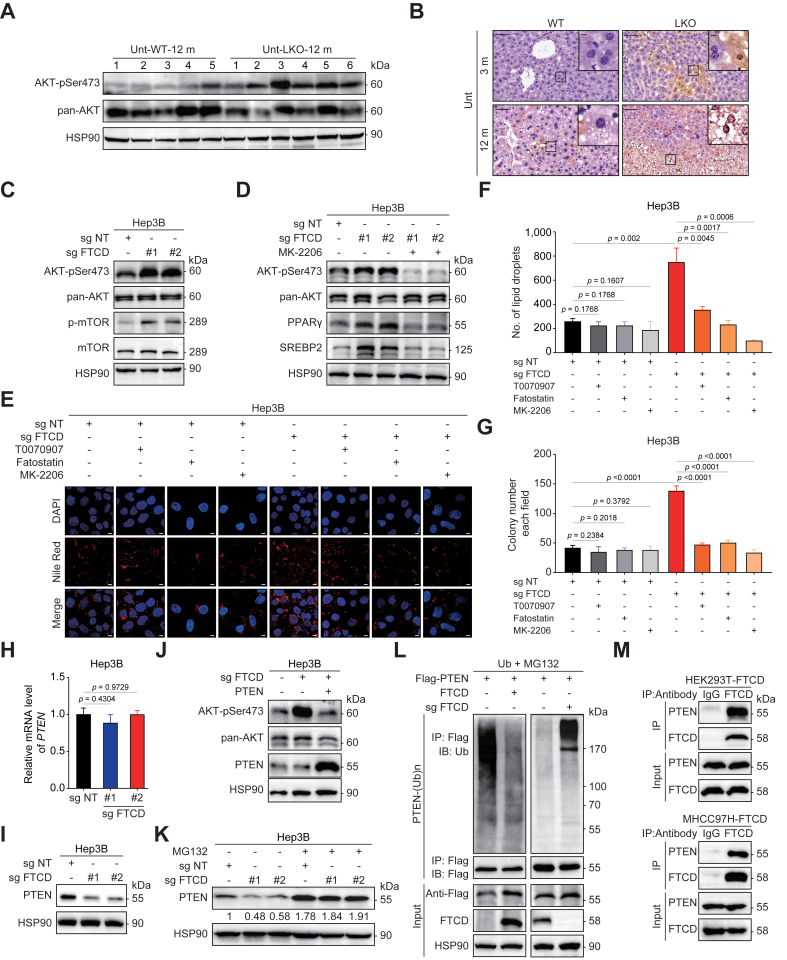
Results: FTCD is highly expressed in the liver but significantly downregulated in HCC. Patients with HCC and low levels of FTCD exhibited worse prognosis, and patients with liver cirrhosis and low FTCD levels exhibited a notable higher probability of developing HCC. Hepatocyte-specific knockout of FTCD promoted both chronic diethylnitrosamine-induced and spontaneous hepatocarcinogenesis in mice. Multi-omics analysis showed that loss of FTCD affected fatty acid and cholesterol metabolism in hepatocarcinogenesis. Mechanistically, loss of FTCD upregulated peroxisome proliferator-activated receptor (PPAR)γ and sterol regulatory element-binding protein 2 (SREBP2) by regulating the PTEN/Akt/mTOR signalling axis, leading to lipid accumulation and hepatocarcinogenesis.

Conclusions: Taken together, we identified a FTCD-regulated lipid metabolic mechanism involving PPARγ and SREBP2 signaling in hepatocarcinogenesis and provide a rationale for therapeutically targeting of HCC driven by downregulation of FTCD.

Impact and implications: Exploiting key molecules responsible for hepatocarcinogenesis is significant for the prevention and treatment of HCC. Herein, we identified formimidoyltransferase cyclodeaminase (FTCD) as the top enhanced gene, which could serve as a predictive and prognostic marker for patients with HCC. We generated and characterised the first Ftcd liver-specific knockout murine model. We found loss of FTCD expression upregulated peroxisome proliferator-activated receptor (PPAR)γ and sterol regulatory element-binding protein 2 (SREBP2) by regulating the PTEN/Akt/mTOR signalling axis, leading to lipid accumulation and hepatocarcinogenesis, and provided a rationale for therapeutic targeting of HCC driven by downregulation of FTCD.

Keywords: Formimidoyltransferase cyclodeaminase; Hepatocarcinogenesis; Lipid metabolism; Tumour suppressor.


Conflict of interest statement

All authors declare no conflicts of interest. Please refer to the accompanying ICMJE disclosure forms for further details.

Figures

None
Graphical abstract
Fig. 1
Fig. 1
Identification of FTCD as a candidate tumour suppressor of HCC. (A) Schematic diagram for identification of FTCD in HCC. (B) Volcano plot of 1657 differentially expressed genes (696 downregulated and 961 upregulated genes) identified from 50 paired samples of T and their corresponding N tissues from TCGA-LIHC database. Log2 (fold change) >1.0 or log2 (fold change) <−1.0; false discovery rate (FDR-value) <0.05. (C) Heatmap displaying the expression profiles of 57 differentially expressed genes (22 upregulated, 35 downregulated) in the liver compared with 30 other tissues from Homo sapiens extracted from the GTEX database. Log2 (fold change) >1.0 or log2 (fold change) <−1.0; false discovery rate (FDR-value) <0.05. (D) Expression of FTCD in 31 normal organs of Homo sapiens from the GTEX database. Data are represented as mean ± SEM. mRNA levels of FTCD were determined by real time qRT-PCR in 53 paired samples of HCC (E), as well as in normal liver (n = 4), cirrhosis (n = 7), and HCC (n = 7) tissue samples (F). β-actin was used as a loading control. (G) Kaplan–Meier analysis of HCC development probability for patients with 216 cirrhosis with differential expression of FTCD (GSE15654). (H) Immunohistochemical staining of FTCD in tumour tissues from 296 patients with HCC. Magnification: 100x. Kaplan-Meier analysis of the overall survival rate (I) and recurrence rate (J) was performed according to expression of FTCD. Data are represented as mean ± SEM; p values are calculated by two-tailed unpaired t test. FDR-value, false discovery rate; FTCD, formimidoyltransferase cyclodeaminase; GTEx, Genotype-Tissue Expression; HCC, hepatocellular; LIHC, liver hepatocellular carcinoma; N, non-tumour; T, tumour; TCGA, The Cancer Genome Atlas.
Fig. 2
Fig. 2
FTCD deletion promotes carcinogen-induced hepatocarcinogenesis in mice. (A) Schematic image of the DEN-induced HCC model in mice. (B to J) Wild-type (Ftcdfl/fl, referred as WT) and Ftcd liver-specific knockout (AlbCre; Ftcdfl/fl, referred as LKO) mice were treated by single intraperitoneal injection of DEN (20 mg/kg) at the age of 2 weeks. Representative whole liver images (B) and H&E staining (C) from mice 9 months or 12 months after DEN treatment. Scale bars: 5 mm (B and C, magnification: 5 × ), 50 μm and 10 μm (C, magnification: 400 × ). Arrows and dotted lines indicate HCC and the HCC border, respectively. Number of tumours (D), maximum tumour diameter and I liver-to-body weight-ratio (F) in WT (n = 11 for 9 months; n = 13 for 12 months) and LKO (n = 7 per group) mice after DEN treatment. Serum levels of AST (G) and ALT (H) in mice (n = 5 for WT mice and n = 4 for LKO mice 9 months after DEN treatment; n = 10 for WT mice and n = 11 for LKO mice 12 months after DEN treatment). Representative IHC staining images for Ki67, SR (Sirius Red), CD34 (I), and corresponding quantifications in (A). Magnification: 10x high-power field (J) of livers from DEN-induced mice (n = 10 from three mice for WT-T group; n = 18 from three mice for other three groups). Arrows indicate Ki67-positive hepatocytes or positive areas for SR. Scale bars: 100 μm. Dotted line indicates tumour border. Data are represented as mean ± SEM; p values are calculated by two-tailed unpaired t test in (D to F), Mann–Whitney test in (G, H, and J). ALT, alanine aminotransferase; AST, aspartate aminotransferase; DEN, diethylnitrosamine; FTCD, formimidoyltransferase cyclodeaminase; H&E, Haematoxylin and eosin; LKO, liver-specific Ftcd knockout; T, tumour site; WT, wild type.
Fig. 3
Fig. 3
FTCD deletion promotes spontaneous hepatocarcinogenesis in mice. (A) Schematic image of mice model strategy. (B to J) Phenotype for DEN-Unt liver-specific Ftcd-LKO mice. Representative whole liver images (B) and H&E staining (C) for 12- and 17-month-old mice are shown. Scale bars: 5 mm (magnification: 5× ), 50 μm and 10 μm (C, magnification: 400 × ). Dotted line indicates DN border. Dysplastic nodule number (D), diameter (E) and liver-to-body weight-ratio (F) in the WT (n = 15 for 12-month; n = 13 for 13-month; n = 7 for 15-month; n = 10 for 17-month mice) and LKO model (n = 3 for 12-month or 17-month; n = 4 for 13-month or 15-month mice). Serum levels of AST (G) and ALT (H) (n = 5 for LKO mice at the age of 12 months; n = 6 mice for other groups). Representative IHC staining for Ki67, SR (Sirius red), CD34 (I) and corresponding quantification in (A) magnification: 10× high-power field (J) of livers from DEN-untreated mice (n = 18 from three mice per group). Arrows indicate Ki67-positive hepatocytes or positive areas for SR. Scale bars: 100 μm. Dotted line indicates DN border. Data are represented as mean ± SEM; p values are calculated by two-tailed unpaired t test in (F, G) and Mann-Whitney test in (H, J). Data is shown as dot-plots in (D, E). FTCD, formimidoyltransferase cyclodeaminase; DEN, diethylnitrosamine; AST, aspartate aminotransferase; DN, dysplastic nodule; H&E, Haematoxylin and eosin; IHC, immunohistochemical; LKO, liver-specific Ftcd knockout; SR, Sirius Red; Unt, untreated; WT, wild type.
Fig. 4
Fig. 4
Multi-omics analysis reveals a novel function of FTCD in modulating lipid metabolism. (A) RNA-Sequencing and bioinformatics analysis for liver tissues from mice 12 months after DEN treatment. DEN/WT indicates liver tissues from WT mice; DEN/LKO-T and DEN/LKO-N indicate tumour and non-tumour liver tissues from Ftcd knockout (LKO) mice, respectively; DEN/WT vs. DEN/LKO-N indicates DEN/LKO-N group compared with DEN/WT group; DEN/LKO-N vs. DEN/LKO-T indicates DEN/LKO-T group compared with DEN/LKO-N group; DEGs indicates differentially expressed genes. (B) KEGG enrichment analysis for representative pathways of 301 overlapping genes in (A), p <0.05. (C) KEGG enrichment analysis for metabolic-related pathways of proteomics for liver tissues from LKO mice and WT littermates without DEN treatment. p <0.05. (D) Z-Score heatmap of 27 significantly altered metabolites in tumour and non-tumour tissues from livers in LKO mice compared with liver tissues from WT mice. All tissues were from mice 12 months after DEN treatment. p <0.05. DEN, diethylnitrosamine; FTCD, formimidoyltransferase cyclodeaminase; KEGG, Kyoto Encyclopedia of Genes and Genomes; LKO, liver-specific Ftcd knockout; WT, wild type.
Fig. 5
Fig. 5
Loss of FTCD upregulates PPARγ and SREBP2 signalling. (A) Immunohistochemical staining of PPARγ of livers from DEN-untreated mice and DEN-induced mice. Scale bars: 25 μm (left) and 2.5 μm (right). Dotted line indicates HCC border. (B) Numbers of PPARγ+ hepatocytes of immunohistochemical staining were counted. N = 18 from three mice per group in the Unt graph; n = 10 from three mice for WT-T group and n = 18 from three mice for other three groups in DEN graph. Expression of key transcription factors involved in lipid metabolism in HCC cells were detected by real time RT-qPCR (C) and western blotting (D), respectively. (E) Expression of PPARγ/SREBP2-target genes in HCC cells were detected by real time RT-qPCR. (F) Expression of PPARγ/SREBP2-target genes in livers from DEN-induced mice were detected by real time RT-qPCR. (G) GSEA of PPARγ/SREBP2-regulated pathways from transcriptome in DEN-induced mice. Representative images are shown for (A) and (D). n = 3 biologically independent replicates. Data are represented as mean ± SEM; p values are calculated by Mann-Whitney test in (B), and two-tailed unpaired t test in (C, E, and F). Adj N, adjacent normal tissues; DN, dysplastic nodules; FTCD, formimidoyltransferase cyclodeaminase; GSEA, gene set enrichment analysis; N, normal liver tissues; T, tumour site; Unt, untreated.
Fig. 6
Fig. 6
FTCD suppresses lipid accumulation by regulating PPARγ and SREBP2. (A) Confocal fluorescence analysis showing lipid accumulation in livers from WT or Ftcd knockout (LKO) mice. Staining nuclei with DAPI in blue and lipids with Nile Red in red. Scale bars: 25 μm. (B) Number of lipid droplets in a high-power field of liver tissues in (A). n = 20 from two mice per group for DEN-untreated mice, and n = 40 from four mice per group for DEN-treated mice. Quantification of hepatic TG (C), FFA (D), and TC (E) from DEN-untreated mice and DEN-induced mice 12 months after DEN treatment (n = 6 per group in D, and n = 9 per group in C and E). Representative H&E staining of livers (F) and liver-to-body weight-ratio (G) from normal chow diet (NCD)-fed or high-fat diet (HFD)-fed mice (n = 5 per group). Scale bars: 50 μm. Representative images (H), quantification (I) of confocal fluorescence analysis for lipid accumulation and colony formation assays (J) in HCC cells after PPARγ inhibitor (T0070907) and SREBP2 inhibitor (fatostatin) treatment. Scale bars: 10 μm. N = 3 biologically independent samples. Representative images are shown. Data are represented as mean ± SEM; p values are calculated by two-tailed unpaired t test in (B, D, G, I, and J) and Mann–Whitney test in (C and E). DAPI, 4′,6-diamidino-2-phenylindole; DEN, diethylnitrosamine; FFA, free fatty acid; FTCD, formimidoyltransferase cyclodeaminase; H&E, Haematoxylin and eosin; HFD, high-fat diet; LKO, liver-specific Ftcd knockout; NCD, normal chow diet; TC, total cholesterol; TG, triglyceride; Unt, untreated with DEN; WT, wild type.
Fig. 7
Fig. 7
FTCD negatively regulates the Akt/mTOR signal pathway and lipid accumulation via binding and reducing PTEN stability. (A) Total and phosphorylated Akt were detected by western blotting in livers from WT or Ftcd knockout (LKO) mice in 12-month-old mice.(B) Immunohistochemical staining of phosphorylated Akt for livers from 3- and 12-month-old untreated mice. Scale bars: 50 μm (left) and 5 μm (right). (C) Total and phosphorylated Akt and mTOR were detected by western blotting after knockout of FTCD in HCC cells. (D) Expression of PPARγ and SREBP2 were detected by western blotting after Akt inhibitor (MK-2206) treatment in HCC cells. (E to G) Confocal fluorescence analysis for lipid accumulation (E, F) and colony formation assays (G) in HCC cells treated with T0070907, fatostatin and MK-2206. N = 3 biologically independent samples. Expression of PTEN in HCC cells were detected by real time RT-qPCR (H) and western blotting (I), respectively. (J) Total and phosphorylated Akt were detected by western blotting after knockout of FTCD or overexpression of PTEN in HCC cells. (K) Protein levels of PTEN in HCC cells with proteasome inhibitor MG132 treatment. (L) Immunoprecipitation detected ubiquitination modification of PTEN in HEK293T cells. (M) The binding of FTCD with PTEN protein was detected by co-immunoprecipitation in HEK293T cells (upper) and MHCC97H cells (lower) with FTCD overexpression. Three independent experiments were conducted with similar results. Data are represented as mean ± SEM; p values are calculated by two-tailed unpaired t test in (F, G, and H). FTCD, formimidoyltransferase cyclodeaminase; LKO, knockout; Ub, ubiquitin; WT, wildtype.

Similar articles

Cited by

References

    1. Sung H., Ferlay J., Siegel R.L., Laversanne M., Soerjomataram I., Jemal A., et al. Global Cancer Statistics 2020: GLOBOCAN estimates of incidence and mortality worldwide for 36 cancers in 185 countries. CA Cancer J Clin. 2021;71:209–249. - PubMed
    1. El-Serag H.B., Rudolph K.L. Hepatocellular carcinoma: epidemiology and molecular carcinogenesis. Gastroenterology. 2007;132:2557–2576. - PubMed
    1. Park J.W., Chen M., Colombo M., Roberts L.R., Schwartz M., Chen P.J., et al. Global patterns of hepatocellular carcinoma management from diagnosis to death: the BRIDGE Study. Liver Int. 2015;35:2155–2166. - PMC - PubMed
    1. Llovet J.M., Ricci S., Mazzaferro V., Hilgard P., Gane E., Blanc J.F., et al. Sorafenib in advanced hepatocellular carcinoma. N Engl J Med. 2008;359:378–390. - PubMed
    1. Llovet J.M., Ricci S., Mazzaferro V., Hilgard P., Gane E., Blanc J.F., et al. Lenvatinib versus sorafenib in first-line treatment of patients with unresectable hepatocellular carcinoma: a randomised phase 3 non-inferiority trial. Lancet. 2018;391:1163–1173. - PubMed