

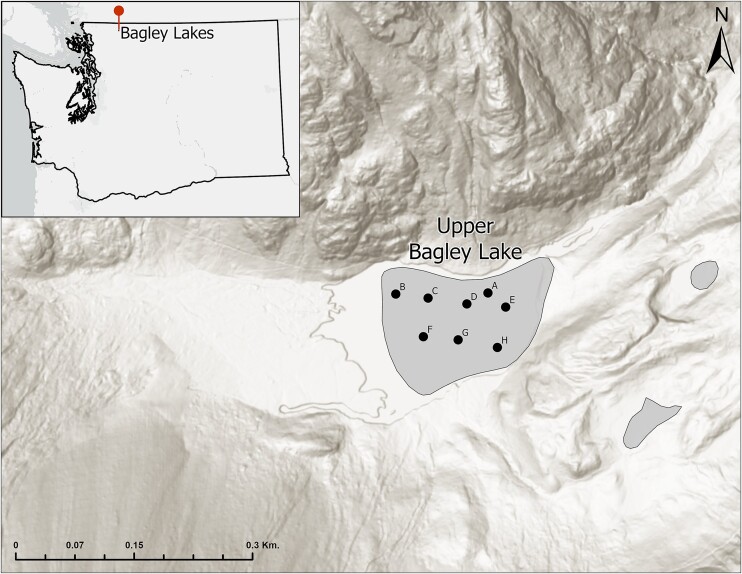
Patchy and Pink: Dynamics of a Chlainomonas sp. (Chlamydomonadales, chlorophyta) algal bloom on Bagley Lake, North Cascades, WA
- PMID: 37675994
- PMCID: PMC10580270
- DOI: 10.1093/femsec/fiad106
Patchy and Pink: Dynamics of a Chlainomonas sp. (Chlamydomonadales, chlorophyta) algal bloom on Bagley Lake, North Cascades, WA
Abstract
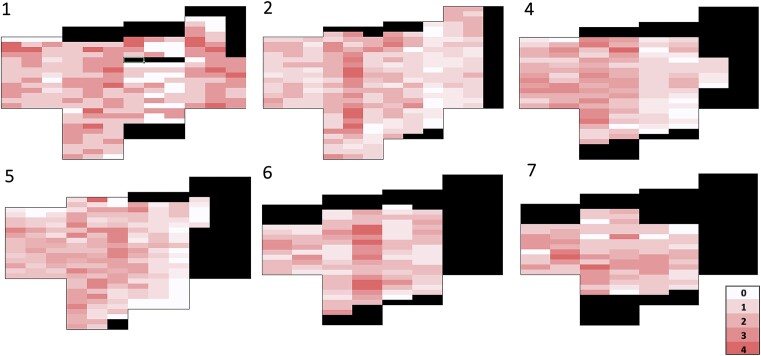
Snow algal blooms frequently occur throughout alpine and polar environments during spring and summer months; however, our understanding of bloom dynamics is limited. We tracked a recurrent bloom of Chlainomonas sp. on Upper Bagley Lake in the North Cascade Mountains, USA, to assess the spatiotemporal dynamics in bloom color intensity, community photophysiology, and community composition over eight weeks. We found that the algae biomass had a dynamic patchy distribution over space and time, which was decoupled from changes in community composition and life-cycle progress averaged across the bloom. The proportional representation of Chlainomonas sp. remained consistent throughout the study while the overall community composition shows a progression through the bloom. We found that community photophysiology, measured by the maximum quantum yield of PSII (Fv/Fm), decreased on average throughout the bloom. These findings suggest that the Chlainomonas sp. community on Bagley Lake is not simply an algal bloom with rapid increase in biomass followed by a population crash, as is often seen in aquatic systems, though there is a physiological trajectory and sensitivity to environmental stress. These results contribute to our understanding of the biology of Chlainomonas sp. and its response to environmental stress, specifically an extreme warming event.
Keywords: Chlainomonas sp; blooms; dynamics; photophysiology; snow algae.
© The Author(s) 2023. Published by Oxford University Press on behalf of FEMS.
Conflict of interest statement
All authors declare no conflicts of interest.
Figures


References
-
- Abràmoff MD, Magalhães PJ, Ram SJ. Image processing with ImageJ. Biophotonics Int. 2004;11(7):36–42.
-
- Anesio AM, Laybourn-Parry J. Glaciers and ice sheets as a biome. Trends Ecol Evol. 2012;27(4):219–25. - PubMed
-
- Brown SP, Olson BJ, Jumpponen A. Fungi and algae co-occur in snow: an issue of shared habitat or algal facilitation of heterotrophs?. Arctic Antarctic Alpine Res. 2015;47(4):729–49.
