. 2023 Dec 12;13(12):2584-2609.
doi: 10.1158/2159-8290.CD-23-0306.

Master Transcription Factor Reprogramming Unleashes Selective Translation Promoting Castration Resistance and Immune Evasion in Lethal Prostate Cancer

Affiliations

Master Transcription Factor Reprogramming Unleashes Selective Translation Promoting Castration Resistance and Immune Evasion in Lethal Prostate Cancer

Sandra Santasusagna et al. Cancer Discov. .

Abstract

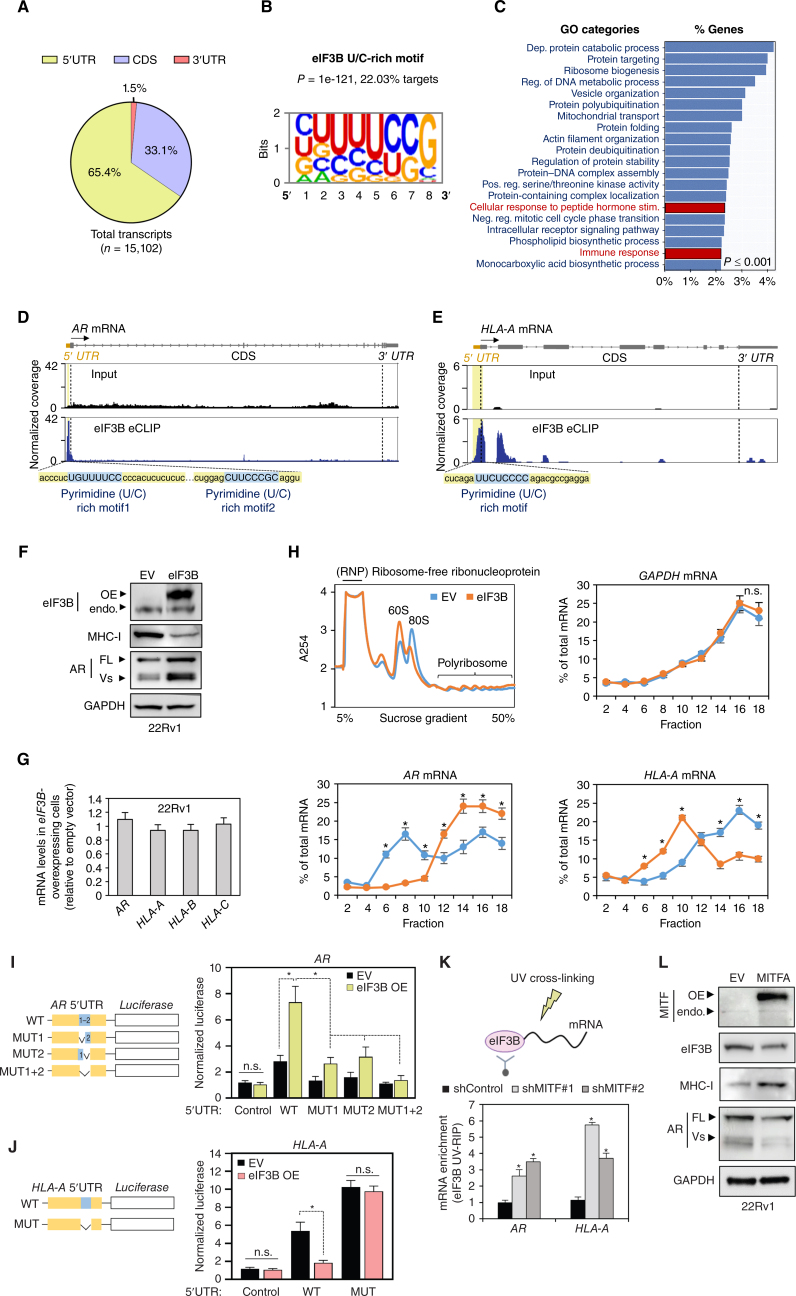
Signaling rewiring allows tumors to survive therapy. Here we show that the decrease of the master regulator microphthalmia transcription factor (MITF) in lethal prostate cancer unleashes eukaryotic initiation factor 3B (eIF3B)-dependent translation reprogramming of key mRNAs conferring resistance to androgen deprivation therapy (ADT) and promoting immune evasion. Mechanistically, MITF represses through direct promoter binding eIF3B, which in turn regulates the translation of specific mRNAs. Genome-wide eIF3B enhanced cross-linking immunoprecipitation sequencing (eCLIP-seq) showed specialized binding to a UC-rich motif present in subsets of 5' untranslated regions. Indeed, translation of the androgen receptor and major histocompatibility complex I (MHC-I) through this motif is sensitive to eIF3B amount. Notably, pharmacologic targeting of eIF3B-dependent translation in preclinical models sensitizes prostate cancer to ADT and anti-PD-1 therapy. These findings uncover a hidden connection between transcriptional and translational rewiring promoting therapy-refractory lethal prostate cancer and provide a druggable mechanism that may transcend into effective combined therapeutic strategies.

Significance: Our study shows that specialized eIF3B-dependent translation of specific mRNAs released upon downregulation of the master transcription factor MITF confers castration resistance and immune evasion in lethal prostate cancer. Pharmacologic targeting of this mechanism delays castration resistance and increases immune-checkpoint efficacy. This article is featured in Selected Articles from This Issue, p. 2489.


Figures

Figure 1. MITF expression is downregulated in advanced lethal prostate cancer patient samples. A, Heat maps of master transcription factor (TF) gene expression in indicated publicly available datasets (GSE35988, GSE3933, and GSE21032). The value in the heat map refers to the color bar. The bar plot shows the signed –log10 P values of the t test by comparing advanced/autopsy to primary prostate cancer. The bar marked in red highlights MITF. B, Venn diagram of upregulated and downregulated master TFs (P < 0.01) among three publicly available datasets. Top 10 commonly deregulated master TFs including at least 2 patient datasets are listed. C, Representative MITF IHC and quantification of MITF-positive cells in morphologically normal prostate glands from prostatectomy specimens, primary prostate cancer, and advanced prostate cancer. PCa, prostate cancer. Scale bar, 100 µm. D, Disease-free survival based on MITF protein expression in a cohort of 52 patients with primary prostate cancer with clinical follow-up. The MITF cutoff point was low ≤20% and high >20% MITF nuclear staining positive cells. E, Disease-free survival based on MITF mRNA expression in patients with primary prostate cancer from two publicly available datasets with clinical follow-up (GSE21032 and https://www.cancer.gov/tcga). The optimal cutoff point was selected automatically using the surv_cutpoint method from the survminer package in R/Bioconductor. TCGA, The Cancer Genome Atlas. *, P < 0.05.
Figure 1.
MITF expression is downregulated in advanced lethal prostate cancer patient samples. A, Heat maps of master transcription factor (TF) gene expression in indicated publicly available datasets (GSE35988, GSE3933, and GSE21032). The value in the heat map refers to the color bar. The bar plot shows the signed –log10P values of the t test by comparing advanced/autopsy to primary prostate cancer. The bar marked in red highlights MITF. B, Venn diagram of upregulated and downregulated master TFs (P < 0.01) among three publicly available datasets. Top 10 commonly deregulated master TFs including at least 2 patient datasets are listed. C, Representative MITF IHC and quantification of MITF-positive cells in morphologically normal prostate glands from prostatectomy specimens, primary prostate cancer, and advanced prostate cancer. PCa, prostate cancer. Scale bar, 100 µm. D, Disease-free survival based on MITF protein expression in a cohort of 52 patients with primary prostate cancer with clinical follow-up. The MITF cutoff point was low ≤20% and high >20% MITF nuclear staining positive cells. E, Disease-free survival based on MITF mRNA expression in patients with primary prostate cancer from two publicly available datasets with clinical follow-up (GSE21032 and https://www.cancer.gov/tcga). The optimal cutoff point was selected automatically using the surv_cutpoint method from the survminer package in R/Bioconductor. TCGA, The Cancer Genome Atlas. *, P < 0.05.
Figure 2. MITF downregulation increases the aggressiveness of prostate cancer. A, Heat map of MITF gene signature in DU145, 22Rv1, and ARCaPM cells transfected with siControl or two siRNAs targeting MITF, in triplicates. Red and blue colors indicate high and low gene expression, respectively. B, Biological processes (FDR ≤0.05) identified by gene ontology (GO) analysis of MITF gene signature. C, Modulation of MITF target gene signature from A in primary and advanced prostate cancer (PCa) patient samples from three publicly available datasets (GSE35988, GSE21032, and GSE3933). Orange and green colors indicate statistical significance (FDR) of induction and suppression of the target gene signatures, respectively (modified GSEA). D, Representative image and quantification of photon flux signals of mice intracardially injected with 105 DU145, 22Rv1, and ARCaPM shControl (C) or shMITF luciferase-tagged cells after 21 days. Ten male mice were used in each experimental group. E, Survival curves of mice from D. *, P < 0.05.
Figure 2.
MITF downregulation increases the aggressiveness of prostate cancer. A, Heat map of MITF gene signature in DU145, 22Rv1, and ARCaPM cells transfected with siControl or two siRNAs targeting MITF, in triplicates. Red and blue colors indicate high and low gene expression, respectively. B, Biological processes (FDR ≤0.05) identified by gene ontology (GO) analysis of MITF gene signature. C, Modulation of MITF target gene signature from A in primary and advanced prostate cancer (PCa) patient samples from three publicly available datasets (GSE35988, GSE21032, and GSE3933). Orange and green colors indicate statistical significance (FDR) of induction and suppression of the target gene signatures, respectively (modified GSEA). D, Representative image and quantification of photon flux signals of mice intracardially injected with 105 DU145, 22Rv1, and ARCaPM shControl (C) or shMITF luciferase-tagged cells after 21 days. Ten male mice were used in each experimental group. E, Survival curves of mice from D. *, P < 0.05.
Figure 3. eIF3B is a direct functional effector gene of MITF in prostate cancer. A, Diagram illustrates the experimental workflow used to identify and functionally validate 11 commonly deregulated genes in three MITF-depleted experimental models and two publicly available patient datasets (GSE35988 and GSE21032). RNA-seq, RNA sequencing. B and C, Quantification of colony formation in DU145, 22Rv1, and ARCaPM cells with upregulated (stable shMITF cells; B) and downregulated (shControl cells; C) target genes transfected with control siRNA or two siRNAs targeting each MITF target gene. C, control. D, Pearson correlation analysis between MITF and eIF3B gene expression levels in indicated publicly available clinical prostate cancer datasets (GSE35988 and GSE21032). E, Representative MITF and eIF3B IHC and quantification in prostate cancer tissue samples. The MITF staining was scored as low ≤20% positive nuclei and high >20% positive nuclei, and eIF3B staining intensity was scored as low (− or +) and high (++) in three different areas of each tumor section. χ2 test = Chi-square test. Scale bar, 100 µm. F, Quantification of cell population doubling in DU145, 22Rv1, and ARCaPM cells transfected with empty (EV), MITFA, and/or eIF3B vectors. OE, overexpression. G, MITF ChIP-sequencing profile at the eIF3B locus in 22Rv1 cells. H, Cartoon depicting the five predicted MITF-binding elements (MBE) in the promoter region of eIF3B and ChIP-qPCR of MITF occupancy at MBE1–5 and flanking negative region in the eIF3B promoter of DU145, 22Rv1, and ARCaPM cells. TSS, transcription start site. I, Luciferase eIF3B promoter activity in DU145, 22Rv1, and ARCaPM cells following cotransfection of siRNA control or two siRNAs targeting MITF, or a Renilla transfection control (normalized relative to control siRNA). J, Luciferase eIF3B promoter activity in DU145, 22Rv1, and ARCaPM cells following cotransfection with an empty or MITFA vector, eIF3B promoter luciferase reporter wild-type (WT) or mutated MBE2–3, or a Renilla transfection control. Data, mean ± SD of at least 3 experiments. *, P < 0.05.
Figure 3.
eIF3B is a direct functional effector gene of MITF in prostate cancer. A, Diagram illustrates the experimental workflow used to identify and functionally validate 11 commonly deregulated genes in three MITF-depleted experimental models and two publicly available patient datasets (GSE35988 and GSE21032). RNA-seq, RNA sequencing. B and C, Quantification of colony formation in DU145, 22Rv1, and ARCaPM cells with upregulated (stable shMITF cells; B) and downregulated (shControl cells; C) target genes transfected with control siRNA or two siRNAs targeting each MITF target gene. C, control. D, Pearson correlation analysis between MITF and eIF3B gene expression levels in indicated publicly available clinical prostate cancer datasets (GSE35988 and GSE21032). E, Representative MITF and eIF3B IHC and quantification in prostate cancer tissue samples. The MITF staining was scored as low ≤20% positive nuclei and high >20% positive nuclei, and eIF3B staining intensity was scored as low (− or +) and high (++) in three different areas of each tumor section. χ2 test = Chi-square test. Scale bar, 100 µm. F, Quantification of cell population doubling in DU145, 22Rv1, and ARCaPM cells transfected with empty (EV), MITFA, and/or eIF3B vectors. OE, overexpression. G, MITF ChIP-sequencing profile at the eIF3B locus in 22Rv1 cells. H, Cartoon depicting the five predicted MITF-binding elements (MBE) in the promoter region of eIF3B and ChIP-qPCR of MITF occupancy at MBE1–5 and flanking negative region in the eIF3B promoter of DU145, 22Rv1, and ARCaPM cells. TSS, transcription start site. I, Luciferase eIF3B promoter activity in DU145, 22Rv1, and ARCaPM cells following cotransfection of siRNA control or two siRNAs targeting MITF, or a Renilla transfection control (normalized relative to control siRNA). J, Luciferase eIF3B promoter activity in DU145, 22Rv1, and ARCaPM cells following cotransfection with an empty or MITFA vector, eIF3B promoter luciferase reporter wild-type (WT) or mutated MBE2–3, or a Renilla transfection control. Data, mean ± SD of at least 3 experiments. *, P < 0.05.
Figure 4. The MITF–eIF3B axis regulates a specialized translation circuitry in prostate cancer. A, 5′UTR, coding sequence (CDS), and 3′UTR peak distribution in triplicate eIF3B eCLIP-seq. B, HOMER motif analysis of 5′UTR peaks reveals an 8-nucleotide UC motif. C, GO biological categories significantly (FDR < 0.01) enriched for transcripts containing the 5′UTR UC motif peaks. Dep., dependent; Neg. reg., negative regulation; Pos. reg., positive regulation; Reg., regulation. D and E, eIF3B eCLIP and input plots of the AR (D) or HLA-A (E) transcript. Blue indicates the UC-rich motifs. F, eIF3B, MHC-I, and AR immunoblot in 22Rv1 cells transduced with empty (EV) or eIF3B vector. endo, endogenous; FL, full length; OE, overexpression; Vs, variants. G, Quantification of mRNA levels of specified genes in 22Rv1 cells transduced with and EV or eIF3B vector. H, Polysome profiling of 22Rv1 cells transduced with EV or eIF3B vector. AR, HLA-A, and GAPDH mRNA levels were determined by qPCR from polysome fractions of 22Rv1 cells transduced with EV or eIF3B vector. Percentage of AR, HLA-A, and GAPDH mRNA distributed in each fraction against total mRNA is shown. I and J, WT or HOMER UC motif deletion mutant of AR (I) or HLA-A (J) 5′UTRs with Firefly luciferase reporter constructs were transfected, and each luciferase reporter activity measured in 22Rv1 cells transduced with EV or eIF3B vector. Results were normalized to Renilla expression and luciferase mRNA. K, AR and HLA-A mRNA enrichment in eIF3B UV-RIP in shControl or shMITF 22Rv1 cells. L, MITF, eIF3B, MHC-I, and AR immunoblot in 22Rv1 cells transduced with an EV or MITFA vector. Data, mean ± SD of at least 3 experiments. n.s., not significant. *, P < 0.05.
Figure 4.
The MITF–eIF3B axis regulates a specialized translation circuitry in prostate cancer. A, 5′UTR, coding sequence (CDS), and 3′UTR peak distribution in triplicate eIF3B eCLIP-seq. B, HOMER motif analysis of 5′UTR peaks reveals an 8-nucleotide UC motif. C, GO biological categories significantly (FDR < 0.01) enriched for transcripts containing the 5′UTR UC motif peaks. Dep., dependent; Neg. reg., negative regulation; Pos. reg., positive regulation; Reg., regulation. D and E, eIF3B eCLIP and input plots of the AR (D) or HLA-A (E) transcript. Blue indicates the UC-rich motifs. F, eIF3B, MHC-I, and AR immunoblot in 22Rv1 cells transduced with empty (EV) or eIF3B vector. endo, endogenous; FL, full length; OE, overexpression; Vs, variants. G, Quantification of mRNA levels of specified genes in 22Rv1 cells transduced with and EV or eIF3B vector. H, Polysome profiling of 22Rv1 cells transduced with EV or eIF3B vector. AR, HLA-A, and GAPDH mRNA levels were determined by qPCR from polysome fractions of 22Rv1 cells transduced with EV or eIF3B vector. Percentage of AR, HLA-A, and GAPDH mRNA distributed in each fraction against total mRNA is shown. I and J, WT or HOMER UC motif deletion mutant of AR (I) or HLA-A (J) 5′UTRs with Firefly luciferase reporter constructs were transfected, and each luciferase reporter activity measured in 22Rv1 cells transduced with EV or eIF3B vector. Results were normalized to Renilla expression and luciferase mRNA. K,AR and HLA-A mRNA enrichment in eIF3B UV-RIP in shControl or shMITF 22Rv1 cells. L, MITF, eIF3B, MHC-I, and AR immunoblot in 22Rv1 cells transduced with an EV or MITFA vector. Data, mean ± SD of at least 3 experiments. n.s., not significant. *, P < 0.05.
Figure 5. The MITF–eIF3B axis confers resistance to ADT. A, Pearson correlation analysis between MITF or eIF3B mRNA abundance with the expression of a 31-androgen receptor signature in tumor specimens from the indicated prostate cancer datasets (https://www.cancer.gov/tcga and GSE21032). TCGA, The Cancer Genome Atlas. B, Cell population doubling of LNCaP and VCaP cells transduced with shControl, shMITF, empty (EV), or eIF3B vector cultured in CS FBS and phenol red–free media. C, Representative imaging and quantification of tumor photon flux signals in castrated mice after 6 weeks of subcutaneous injection of 106 LNCaP and VCaP shControl or shMITF luciferase-tagged cells. Ten mice were used for each experimental group. C, control. D, Representative image and quantification of tumor weights in castrated mice subcutaneously injected with 106 LNCaP and VCaP EV or eIF3B vector luciferase-tagged cells. E, Diagram depicts the workflow used to generate patient-derived hormone-sensitive xenograft and organoid models. PC, prostate cancer; PDX, patient-derived xenograft. F, Representative image and cell viability (MTS) quantification of EV or eIF3B-overexpressing prostate cancer organoids cultured in regular media supplemented with FBS 10% or CS and phenol red–free media. G, Tumor growth curves of subcutaneous tumors generated after injecting control (EV) or eIF3B-overexpressing organoids (Org) in intact host mice and after castration. Mice were castrated (arrow) once tumors reached a size of 200 mm3. Ten mice were used for each experimental group. Data, mean ± SD of at least 3 experiments. *, P < 0.05; **, P < 0.0001.
Figure 5.
The MITF–eIF3B axis confers resistance to ADT. A, Pearson correlation analysis between MITF or eIF3B mRNA abundance with the expression of a 31-androgen receptor signature in tumor specimens from the indicated prostate cancer datasets (https://www.cancer.gov/tcga and GSE21032). TCGA, The Cancer Genome Atlas. B, Cell population doubling of LNCaP and VCaP cells transduced with shControl, shMITF, empty (EV), or eIF3B vector cultured in CS FBS and phenol red–free media. C, Representative imaging and quantification of tumor photon flux signals in castrated mice after 6 weeks of subcutaneous injection of 106 LNCaP and VCaP shControl or shMITF luciferase-tagged cells. Ten mice were used for each experimental group. C, control. D, Representative image and quantification of tumor weights in castrated mice subcutaneously injected with 106 LNCaP and VCaP EV or eIF3B vector luciferase-tagged cells. E, Diagram depicts the workflow used to generate patient-derived hormone-sensitive xenograft and organoid models. PC, prostate cancer; PDX, patient-derived xenograft. F, Representative image and cell viability (MTS) quantification of EV or eIF3B-overexpressing prostate cancer organoids cultured in regular media supplemented with FBS 10% or CS and phenol red–free media. G, Tumor growth curves of subcutaneous tumors generated after injecting control (EV) or eIF3B-overexpressing organoids (Org) in intact host mice and after castration. Mice were castrated (arrow) once tumors reached a size of 200 mm3. Ten mice were used for each experimental group. Data, mean ± SD of at least 3 experiments. *, P < 0.05; **, P < 0.0001.
Figure 6. The MITF–eIF3B axis promotes immune evasion. A, Representative IHC and quantification of eIF3B and MHC-I expression in prostate cancer tissue samples. The eIF3B and MHC-I staining intensity was scored as low (− or +) and high (++) in three different areas of each tumor section. χ2 test = Chi-square test. B, Representative IHC and quantification of the CD8/CD3 ratio in eIF3B low and high expressing prostate tumors. CD8- and CD3-positive cells were counted in three different areas of each tumor section. C, Pearson correlation analysis between eIF3B mRNA abundance and the expression of a T-cell effector signature (CD8A, GZMA, and GZMB) in tumor specimens from the indicated prostate cancer datasets (https://www.cancer.gov/tcga, GSE21032, GSE84043, and GSE35988, https://github.com/cBioPortal/datahub/tree/master/public/prad_su2c_2019). TCGA, The Cancer Genome Atlas. D, Representative image and quantification of tumor weights of empty vector (EV) and eIF3B-overexpressing TRAMP-C2 and MyC-CaP tumors intratumorally injected with vehicle (Veh.; PBS) or Poly(I:C) 2.5 mg/kg, intratumoral. Five male mice were used for each experimental group. E, Cytometry by time of flight (CyTOF) analysis of TRAMP-C2 tumors. PhenoGraph-defined cellular distribution and clustering, as defined by tSNE1 and tSNE2 (t-distributed stochastic neighbor embedding), colored by cellular phenotypes in TRAMP-C2 EV and eIF3B-overexpressing tumors from mice at 2 days after the last intratumoral injection of vehicle (PBS) or Poly(I:C). F, CyTOF analysis of TRAMP-C2 tumors. Data derived from normalized viable single cells analyzed by the PhenoGraph algorithm are shown in the bar graph as means ± SD (n = 3). Statistical significance was determined by one-way ANOVA with Bonferroni correction for multiple tests. CTL, cytotoxic T lymphocyte; MDSC, myeloid-derived suppressor cells; NK, natural killer cells. G, Tumor growth curves of TRAMP-C2 and MyC-CaP subcutaneous tumors generated after injecting 106 eIF3B-overexpressing or EV cells in mice intraperitoneally treated with IgG or anti–PD-1 (250 μg/i.p., alternate days). Ten male mice were used for each experimental group. Data, mean ± SD of at least 3 experiments. *, P < 0.05. Scale bar, 100 μm.
Figure 6.
The MITF–eIF3B axis promotes immune evasion. A, Representative IHC and quantification of eIF3B and MHC-I expression in prostate cancer tissue samples. The eIF3B and MHC-I staining intensity was scored as low (− or +) and high (++) in three different areas of each tumor section. χ2 test = Chi-square test. B, Representative IHC and quantification of the CD8/CD3 ratio in eIF3B low and high expressing prostate tumors. CD8- and CD3-positive cells were counted in three different areas of each tumor section. C, Pearson correlation analysis between eIF3B mRNA abundance and the expression of a T-cell effector signature (CD8A, GZMA, and GZMB) in tumor specimens from the indicated prostate cancer datasets (https://www.cancer.gov/tcga, GSE21032, GSE84043, and GSE35988, https://github.com/cBioPortal/datahub/tree/master/public/prad_su2c_2019). TCGA, The Cancer Genome Atlas. D, Representative image and quantification of tumor weights of empty vector (EV) and eIF3B-overexpressing TRAMP-C2 and MyC-CaP tumors intratumorally injected with vehicle (Veh.; PBS) or Poly(I:C) 2.5 mg/kg, intratumoral. Five male mice were used for each experimental group. E, Cytometry by time of flight (CyTOF) analysis of TRAMP-C2 tumors. PhenoGraph-defined cellular distribution and clustering, as defined by tSNE1 and tSNE2 (t-distributed stochastic neighbor embedding), colored by cellular phenotypes in TRAMP-C2 EV and eIF3B-overexpressing tumors from mice at 2 days after the last intratumoral injection of vehicle (PBS) or Poly(I:C). F, CyTOF analysis of TRAMP-C2 tumors. Data derived from normalized viable single cells analyzed by the PhenoGraph algorithm are shown in the bar graph as means ± SD (n = 3). Statistical significance was determined by one-way ANOVA with Bonferroni correction for multiple tests. CTL, cytotoxic T lymphocyte; MDSC, myeloid-derived suppressor cells; NK, natural killer cells. G, Tumor growth curves of TRAMP-C2 and MyC-CaP subcutaneous tumors generated after injecting 106 eIF3B-overexpressing or EV cells in mice intraperitoneally treated with IgG or anti–PD-1 (250 μg/i.p., alternate days). Ten male mice were used for each experimental group. Data, mean ± SD of at least 3 experiments. *, P < 0.05. Scale bar, 100 μm.
Figure 7. Targeting eIF3B-dependent translation increases the efficacy of ADT and ICI therapy. A, Representative images and quantification of eIF4G–eIF4E and eIF3B–eIF4E proximity ligation assays (PLA) in 22Rv1 cells treated with vehicle (DMSO) or 4EGI-1 (10 μmol/L) for 24 hours. B, Representative polysome profiling; AR, HLA-A, and GAPDH mRNA levels determined by qPCR from polysome fractions of 22Rv1 cells treated with vehicle (DMSO) or 4EGI-1 (5 μmol/L, 24 hours). The percentage of AR, HLA-A, and GAPDH mRNA distributed in each fraction against total mRNA is shown. C, eIF3B, AR, and MHC-I immunoblot in 22Rv1 empty vector (EV) or eIF3B-overexpressing cells treated with vehicle (DMSO) or 4EGI-1 (5 μmol/L, 24 hours). endo, endo­genous; FL, full length; OE, overexpression; Vs, variants. D, Puromycin, AR, and MHC-I immunoblot in 22Rv1 cells cultured with puromycin (100 nmol/L) and treated with vehicle (DMSO) or 4EGI-1 (5 or 50 μmol/L) for 24 hours. E, Representative image and quantification of tumor photon flux signals of castrated male mice bearing subcutaneous LNCaP and VCaP luciferase-tagged tumors treated with vehicle (DMSO) or 4EGI-1 (75 mg/kg/i.p., 5 days a week). Five male mice were used for each treatment group. F, Experimental diagram and quantification of LNCaP and VCaP tumor weights of intact and castrated (ADT) mice treated with vehicle (DMSO) or 4EGI-1 (75 mg/kg/i.p., 5 days a week) for 28 days. Five male mice were used for each treat­ment group. G, Representative cleaved-caspase 3 IHC and quantification in LNCaP and VCaP xenografts from castrated mice treated with vehicle (DMSO) or 4EGI-1 (75 mg/kg/i.p., 5 days a week) for 1 week. Five male mice were used for each treatment group. H, Survival of intact and castrated mice intracardially injected with 105 PDX prostate cancer cells treated with vehicle (DMSO) or 4EGI-1 (75 mg/kg/i.p., 5 days a week). *, P < 0.05 (intact mice). *, P < 0.05 (castrated mice). Ten male mice were used for each treatment group. I, Representative image and quantification of TRAMP-C2 and MyC-CaP tumor weight of mice treated with vehicle (DMSO), 4EGI-1 (75 mg/kg/i.p., 5 days a week), anti–PD-1 (250 μg/i.p., alternate days) alone or in combination. Ten male mice were used for each treatment group. J, Survival curves of mice intracardially injected with 105 TRAMP-C2 and MyC-CaP cells treated with vehicle (DMSO), 4EGI-1 (75 mg/kg/i.p., 5 days a week), or anti–PD-1 (250 μg/i.p., alternate days) alone or in combination. Ten male mice were used for each treatment group. Data, mean ± SD of at least 3 experiments. ns, not significant. *, P < 0.05. Scale bar, 100 μm.
Figure 7.
Targeting eIF3B-dependent translation increases the efficacy of ADT and ICI therapy. A, Representative images and quantification of eIF4G–eIF4E and eIF3B–eIF4E proximity ligation assays (PLA) in 22Rv1 cells treated with vehicle (DMSO) or 4EGI-1 (10 μmol/L) for 24 hours. B, Representative polysome profiling; AR, HLA-A, and GAPDH mRNA levels determined by qPCR from polysome fractions of 22Rv1 cells treated with vehicle (DMSO) or 4EGI-1 (5 μmol/L, 24 hours). The percentage of AR, HLA-A, and GAPDH mRNA distributed in each fraction against total mRNA is shown. C, eIF3B, AR, and MHC-I immunoblot in 22Rv1 empty vector (EV) or eIF3B-overexpressing cells treated with vehicle (DMSO) or 4EGI-1 (5 μmol/L, 24 hours). endo, endo­genous; FL, full length; OE, overexpression; Vs, variants. D, Puromycin, AR, and MHC-I immunoblot in 22Rv1 cells cultured with puromycin (100 nmol/L) and treated with vehicle (DMSO) or 4EGI-1 (5 or 50 μmol/L) for 24 hours. E, Representative image and quantification of tumor photon flux signals of castrated male mice bearing subcutaneous LNCaP and VCaP luciferase-tagged tumors treated with vehicle (DMSO) or 4EGI-1 (75 mg/kg/i.p., 5 days a week). Five male mice were used for each treatment group. F, Experimental diagram and quantification of LNCaP and VCaP tumor weights of intact and castrated (ADT) mice treated with vehicle (DMSO) or 4EGI-1 (75 mg/kg/i.p., 5 days a week) for 28 days. Five male mice were used for each treat­ment group. G, Representative cleaved-caspase 3 IHC and quantification in LNCaP and VCaP xenografts from castrated mice treated with vehicle (DMSO) or 4EGI-1 (75 mg/kg/i.p., 5 days a week) for 1 week. Five male mice were used for each treatment group. H, Survival of intact and castrated mice intracardially injected with 105 PDX prostate cancer cells treated with vehicle (DMSO) or 4EGI-1 (75 mg/kg/i.p., 5 days a week). *, P < 0.05 (intact mice). *, P < 0.05 (castrated mice). Ten male mice were used for each treatment group. I, Representative image and quantification of TRAMP-C2 and MyC-CaP tumor weight of mice treated with vehicle (DMSO), 4EGI-1 (75 mg/kg/i.p., 5 days a week), anti–PD-1 (250 μg/i.p., alternate days) alone or in combination. Ten male mice were used for each treatment group. J, Survival curves of mice intracardially injected with 105 TRAMP-C2 and MyC-CaP cells treated with vehicle (DMSO), 4EGI-1 (75 mg/kg/i.p., 5 days a week), or anti–PD-1 (250 μg/i.p., alternate days) alone or in combination. Ten male mice were used for each treatment group. Data, mean ± SD of at least 3 experiments. ns, not significant. *, P < 0.05. Scale bar, 100 μm.

References

    1. Labrie M, Brugge JS, Mills GB, Zervantonakis IK. Therapy resistance: opportunities created by adaptive responses to targeted therapies in cancer. Nat Rev Cancer 2022;22:323–39. - PMC - PubMed
    1. Konieczkowski DJ, Johannessen CM, Garraway LA. A convergence-based framework for cancer drug resistance. Cancer Cell 2018;33:801–15. - PMC - PubMed
    1. Sung H, Ferlay J, Siegel RL, Laversanne M, Soerjomataram I, Jemal A, et al. . Global cancer statistics 2020: GLOBOCAN estimates of incidence and mortality worldwide for 36 cancers in 185 countries. CA Cancer J Clin 2021;71:209–49. - PubMed
    1. Carceles-Cordon M, Kelly WK, Gomella L, Knudsen KE, Rodriguez-Bravo V, Domingo-Domenech J. Cellular rewiring in lethal prostate cancer: the architect of drug resistance. Nat Rev Urol 2020;17:292–307. - PMC - PubMed
    1. Davies AH, Beltran H, Zoubeidi A. Cellular plasticity and the neuro­endocrine phenotype in prostate cancer. Nat Rev Urol 2018;15:271–86. - PubMed

Publication types

MeSH terms