. 2023 Nov 1;133(21):e162788.
doi: 10.1172/JCI162788.

CD8+ T cells recognizing a neuron-restricted antigen injure axons in a model of multiple sclerosis

Affiliations

CD8+ T cells recognizing a neuron-restricted antigen injure axons in a model of multiple sclerosis

Benjamin Ds Clarkson et al. J Clin Invest. .

Abstract

CD8+ T cells outnumber CD4+ cells in multiple sclerosis (MS) lesions associated with disease progression, but the pathogenic role and antigenic targets of these clonally expanded effectors are unknown. Based on evidence that demyelination is necessary but not sufficient for disease progression in MS, we previously hypothesized that CNS-infiltrating CD8+ T cells specific for neuronal antigens directly drive the axonal and neuronal injury that leads to cumulative neurologic disability in patients with MS. We now show that demyelination induced expression of MHC class I on neurons and axons and resulted in presentation of a neuron-specific neoantigen (synapsin promoter-driven chicken ovalbumin) to antigen-specific CD8+ T cells (anti-ovalbumin OT-I TCR-transgenic T cells). These neuroantigen-specific effectors surveilled the CNS in the absence of demyelination but were not retained. However, upon induction of demyelination via cuprizone intoxication, neuroantigen-specific CD8+ T cells proliferated, accumulated in the CNS, and damaged neoantigen-expressing neurons and axons. We further report elevated neuronal expression of MHC class I and β2-microglobulin transcripts and protein in gray matter and white matter tracts in tissue from patients with MS. These findings support a pathogenic role for autoreactive anti-axonal and anti-neuronal CD8+ T cells in MS progression.

Keywords: Immunology; Multiple sclerosis; Neurological disorders; Neuroscience; T cells.


Conflict of interest statement

Conflict of interest: The authors have declared that no conflict of interest exists.

Figures

Figure 1
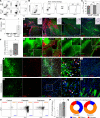
Figure 1. Antigen processing and presentation genes are upregulated in neurons during CNS demyelination.
(A) Schematic of the microfluidic device used to physically isolate pure axonal fields from neuron cell bodies. Representative fluorescence microscopy image of AAV.Syn.GFP-transduced cortical neurons projecting long axons in such a device. For inflammatory stimulation, IFN-γ was added to the distal axon chamber. (B) Axonal fields of mouse cortical neurons were stimulated with 100 ng/mL IFN-γ or vehicle for 72 hours. RNA was isolated from the cell body chamber and processed by microarray analysis of gene transcripts; 296 genes were identified as significantly upregulated (P < 0.05, fold change> 2; genes listed in Supplemental Figure 1). (C) RT-PCR analysis confirmed that multiple antigen processing and presentation genes were retrogradely upregulated in neurons by axonal IFN-γ stimulation (n = 3 samples per condition, B and C). Photomicrographs of axial (D, G, H, I, J) and coronal (E, F, K, L) sections from Syn.Cre × RPL22 mice stained with DAPI (blue; nuclei) and for anti-hemagglutinin (red; HA-tagged ribosomal subunit of Rpl22) in neurons of cortex, hippocampus, and cerebellum. Boxes indicate high-magnification insets (i–vi). Representative of n = 5 mice. Original magnification, ×5 (DF) and ×10 (digitally magnified insets in GL). (M) Differentially expressed genes (DEGs) among mRNAs isolated specifically from neurons in Syn.Cre × RPL22 mouse cerebral cortices 18 days after induction of MOG EAE or after 6 weeks on cuprizone diet (CUP), compared with controls. (N) Venn diagram of DEGs upregulated in M. (O) Heatmap showing levels of selected transcripts undergoing active translation in neurons. (P and Q) Relative expression of MHC class I and associated antigen presentation genes in neurons isolated as above (P) or from retina (Q) at 18 days of EAE or after 6 weeks on cuprizone diet (CUP), compared with controls. Each dot represents an individual animal. (R and S) Representative photomicrographs (×40 magnification) of MHC class I expression (red; H2-Db and/or H2-Kb) in cortical neurons and axons (green; AAV.Syn.GFP) counterstained with DAPI (blue; nuclei) in cuprizone (R) and control mice (S). Representative of n > 5 mice per condition. Error bars are the 95% CI. *P < 0.05; **P < 0.01 by multiple unpaired t tests with Welch’s correction and Benjamini-Hochberg correction for multiple comparisons (C) or Kruskal-Wallis 1-way ANOVA with Dunn’s pairwise comparison (P and Q).
Figure 2
Figure 2. Axons present self-antigen on MHC class I in response to inflammation.
(A) Schematic showing elements of the adeno-associated virus (AAV) plasmid encoding synapsin (Syn) promoter–driven expression of cytosolic ovalbumin (OVA) with an axon-targeting motif coupled to EGFP by a T2A autocatalytic sequence (AAV.Syn.OVA.GFP). (B) Representative Western blot of lysates prepared from DIV 12 cortical neurons transduced at plating with 2,000 (2K) or 20,000 (20K) MOI of AAV.Syn.OVA.GFP or AAV.Syn.GFP, probed with anti-OVA. (C) Representative (n = 5 mice) photomicrographs of AAV.Syn.OVA.GFP-transduced mouse cortex showing immunostaining for OVA (red) in GFP-expressing neurons (green). Scale bars: 50 μm. (D and E) Representative images of the OVA peptide SIINFEKL presented on the H2-Kb MHC class I molecule (anti-H2Kb:SIINFEKL; red) colocalized with GFP+ neurons and axons in mice demyelinated by cuprizone (×60 magnification). The absence of staining with no primary antibody and in non–cuprizone-treated AAV.Syn.OVA-GFP–transduced mice is shown on the right. (F and G) H2Kb:SIINFEKL (red) on OVA-GFP+ axons (green) from cortical neurons cultured in microfluidic chambers following axonal stimulation with PBS (F) or 100 ng/mL IFN-γ for 72 hours (G). Yellow puncta in the higher-magnification panels at the bottom indicate expression of SIINFEKL peptide–loaded MHC class I on axons (×40 magnification). (H) Quantification of H2Kb:SIINFEKL labeling on axons in F and G relative to GFP. In vitro data are representative of at least 3 independent experiments. Error bars are SEM. *P < 0.01 by unpaired, 2-tailed t test (H).
Figure 3
Figure 3. Immune surveillance of a neuron-restricted antigen is increased during CNS demyelination.
(A) Gating strategy for identifying CD8+Vα2+ OT-I T cells among deep cervical lymph node (CLN) cells in mice receiving adoptive transfer of 2 × 10⁶ CMFDA-labeled OT-I cells 5 days prior to analysis. (B) OT-I T cell proliferation in deep CLNs and spleen of cuprizone-fed mice transduced with AAV.Syn.GFP (AAV.GFP, green) or AAV.Syn.OVA.GFP (AAV.OVA, red). (C) Percentage of CLN OT-I T cells exhibiting an LFA-1hi phenotype in mice transduced with AAV.Syn.GFP (green) or AAV.Syn.OVA.GFP (red) and fed either control chow (CON) or cuprizone (CUP). (D) Proliferation of adoptively transferred OT-I T cells in deep CLNs or spleen of mice transduced with AAV.Syn.OVA.GFP and fed control chow (gray) or cuprizone (blue). (E and F) Representative images of brain-draining deep CLNs showing CD11c+ dendritic cells (E; green) and Lyve-1+ stromal cells (F; green) colocalized with OVA (red) in cuprizone-fed mice transduced by intracranial inoculation with AAV.Syn.OVA.GFP. The same field from tissue labeled with 4 colors has been false colored to present CD11c and Lyve-1 individually. (G) Image of deep CLN showing CD11c+ (green) and CD8a+ (red) dendritic cells. (H) Representative image showing CD11c+ (green) and CD8a+ (blue) cells in the deep CLN of cuprizone-fed mice transduced by intracranial inoculation with AAV.Syn.OVA.GFP present SIINFEKL on H2-Kb (red). Images representative of 5 mice. Long scale bars: 100 μm; short scale bars: 10 μm. Error bars show the 95% CI. *P < 0.05; **P < 0.01 by 1-way ANOVA with Benjamini-Hochberg correction for multiple comparisons (C) or multiple unpaired t tests with Holm-Šidák multiple comparison correction (D).
Figure 4
Figure 4. CD8+ neuronal antigen–specific T (nasT) cells are recruited to the demyelinated CNS.
(A) Representative flow plots of blood cells stained as indicated for OT-I markers in lightly irradiated mice adoptively transferred with B6 or OT-I CD8+ T cells. (B) Gating strategy for identifying CD8+Vα2+Vβ5.1+ OT-I cells among brain-infiltrating lymphocytes in cuprizone-fed mice transduced with AAV.Syn.OVA.GFP. (C) Percentage of brain-infiltrating OT-I CD8+ T cells expressing high levels of the LFA-1 activation marker in mice transduced with either AAV.Syn.GFP (GFP) or AAV.Syn.OVA.GFP (OVA) and fed either normal chow or cuprizone for 6 weeks. (D) Total number of OT-I T cells accumulating in the brain in mice transduced with either AAV.Syn.GFP (GFP) or AAV.Syn.OVA.GFP (OVA) and fed either normal chow or cuprizone for 6 weeks. (E) Representative images of CD45+ (red) cells in proximity to GFP+ neurons and axons (green) in the hippocampus and thalamus of AAV.Syn.OVA.GFP-transduced mice adoptively transferred with OT-I or B6 T cells after 6 weeks on cuprizone. Insets show H&E-stained sections, with boxes indicating location of the fluorescent image. (F) Quantitation of CD3+ cells in the brain following adoptive transfer of B6 (WT) or OT-I T cells into AAV.Syn.OVA.GFP-transduced mice fed cuprizone for 6 weeks. (GJ) Representative images of CD3+ T cells (red) in the brain in cuprizone-fed mice transduced with AAV.Syn.OVA.GFP (G and H) or AAV.Syn.GFP (I and J) receiving adoptive transfer (AT) of B6 (G and I) or OT-I (H and J) T cells. (K and L) Representative images of CD8+ T cells (red) adjacent to GFP+ cells and axons on the ipsilateral side of brain transduced with AAV.Syn.OVA.GFP (K) or AAV.Syn.GFP (L) in mice fed cuprizone for 6 weeks prior to adoptive transfer of OT-I T cells. (M and N) CD8+ T cells (red) adjacent to GFP+ structures in the contralateral cortex under the same conditions as (K) and (L). Images are representative of n = 5 AAV.Syn.OVA.GFP mice and n = 2 AAV.Syn.GFP mice. (O) Flow plots showing LFA-1+ brain-infiltrating OT-I T cells in mice receiving intraperitoneal pertussis toxin (200 ng at 96 and 48 hours prior to tissue collection) relative to mice fed cuprizone for 6 weeks. (P) Quantitation of brain accumulation of OT-I T cells from mice in O. (Q) Pie chart representation of the percentage of brain-infiltrating OT-I T cells exhibiting a naive (LFA-1loVα2hi; blue), effector (LFA-1hiVα2hi; orange), or activated effector (LFA-1hiVα2lo; red) phenotype in O. Scale bars: 100 μm. Error bars show the 95% CI; each symbol represents 1 animal. *P < 0.01 by 1-way ANOVA with Benjamini-Hochberg correction (C and D), unpaired, 2-tailed t test (F), or Kruskal-Wallis 1-way ANOVA with Dunn’s pairwise comparison (P).
Figure 5
Figure 5. Brain-infiltrating nasT cells exhibit an activated phenotype.
(A) Number of adoptively transferred B6 (CD8+Vα2Thy1.1+) and OT-I (CD8+Vα2+Thy1.1+) T cells recovered from the brain 5 days after reconstitution with a 1:1 mixture into Thy1.1-negative hosts transduced with AAV.Syn.OVA.GFP or AAV.Syn.GFP and fed control chow (–) or cuprizone (+) for 6 weeks. n = 3–5 mice per condition. Quantitation of IFN-γ production in response to ex vivo stimulation of these brain-infiltrating CD8+ T cells with SIINFEKL peptide, PMA + ionomycin, or vehicle. (B) Cytokine production by brain-infiltrating CD8+ T cells after 24 hours in culture. CD8+ T cells were magnetically purified from brain-infiltrating leukocytes collected from AAV.Syn.OVA.GFP-transduced, cuprizone-fed B6 mice that received adoptive transfer of B6 (WT) or OT-I T cells. (C) Levels of surface activation markers on brain-infiltrating CD8+ T cells collected from mice treated as in A, shown as the ratio of antigen-specific T cell MFI (CD8+Vα2+Thy1.1+) to antigen-naive T cell MFI (CD8+Vα2Thy1.1+). (D) Analysis of expression level of 25 markers in brain-infiltrating OT-I T cells (red) vs. splenic OT-I T cells (blue) using mass cytometry. Mice were transduced with AAV.Syn.OVA.GFP and demyelinated with cuprizone for 6 weeks prior to adoptive transfer of the OT-I T cells. Error bars are the 95% CI. *P < 0.05; **P < 0.01; ***P < 0.001; ****P < 0.0001 by 2-way ANOVA with Holm-Šidák multiple-comparison test (A), unpaired, 2-tailed t test (B), 1-way ANOVA with Dunnett’s multiple-comparison test (C), or multiple unpaired t tests with Benjamini-Hochberg correction for multiple comparisons (D).
Figure 6
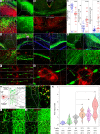
Figure 6. CD8+ nasT cells injure neurons in the demyelinated brain.
(A) Representative images showing APP (red) in cortex 5 days after adoptive transfer of OT-I T cells into AAV.Syn.OVA.GFP-transduced mice fed cuprizone or control chow for 6 weeks. Boxes indicate higher magnification images shown directly beneath each panel. (B) Representative images showing nonphosphorylated neurofilament (npNF; red) and GFP+ axons (green) in the corpus callosum in AAV.Syn.OVA.GFP-transduced B6 or OT-I mice fed cuprizone for 6 weeks. (C) Quantitation of axonal injury parameters following adoptive transfer of B6 (blue) or OT-I (red) T cells into AAV.Syn.OVA.GFP-transduced mice fed cuprizone for 6 weeks. (D) Representative images of RFP+ OT-I T cells (red) in proximity to GFP+ axons (green) in the cortex and corpus callosum 5 days after adoptive transfer into AAV.Syn.OVA.GFP-transduced mice fed cuprizone for 6 weeks. (E) Representative images of the same approach used in D in mice transduced with AAV.Syn.GFP. Boxes in D and E indicate insets (D, i–iv; E, i–ii) shown at higher magnification immediately below the corresponding panel. (F) Optical sections from a z-stack image of a brain-infiltrating RFP+ OT-I T cell (red) in apposition to a GFP+ axon (green) in a mouse transduced with AAV.Syn.OVA.GFP and fed cuprizone for 6 weeks prior to adoptive transfer. (G) 3D renderings of an RFP+ OT-I T cell in contact with a GFP+ axon. (H) Schematic of the multichambered microfluidic device used to introduce T cells to axons. Representative image showing GFP+ axons under attack by RFP+ OT-I T cells; box indicates inset at higher magnification. (I) Axons (green) from cortical neurons transduced with AAV.Syn.OVA.GFP or AAV.Syn.GFP were stimulated for 72 hours with IFN-γ prior to incubation for 1 hour (top row) or 24 hours (bottom row) with RFP+ OT-I T cells isolated from the brain (BILs) 5 days after adoptive transfer into AAV.Syn.OVA.GFP-transduced mice fed cuprizone for 6 weeks. (J) The same approach as in I using blood-derived OT-I T cells. (K) Quantitation of axonal injury from the experiment shown in I after 24 to 72 hours. Low-magnification images in A, B, D, E, and H were acquired with 10× objective. High-magnification insets were acquired with 60× objective (A and DG) or 40× objective (H). Immunostained tissue sections representative of n = 3–5 mice per condition. In vitro data representative of T cells independently isolated from n = 5 mice. Error bars show the 95% CI. **P < 0.01; ***P < 0.001; ****P < 0.0001 by unpaired, 2-tailed t test (C) or 1-way ANOVA with Dunnett’s multiple-comparison test (K).
Figure 7
Figure 7. Neuronal MHC class I and β2M expression is upregulated in MS patient brain tissue.
(A and B) Representative micrographs and quantitation of β2M (A) and HLA-A,B,C (B) immunostaining in cingulate cortical and thalamic gray matter (GM) and in adjacent white matter (WM) tracts from controls (CON) (n = 10) and MS patients (n = 18). (C) Representative micrographs and quantitation of in situ hybridization for β2M mRNA in MS and control cingulate cortex. Scale bars: 100 μm. Signal quantification shown in violin plots to the right of associated images. **P < 0.05; ***P < 0.01 by unpaired, 2-tailed t tests comparing MS vs. CON in GM and MS vs. CON in WM (A and B) or unpaired, 2-tailed t test (C).

References

    1. Filippi M, et al. Diagnosis of multiple sclerosis: 2017 revisions of the McDonald criteria. Lancet Neurol. 2018;4(1):43–173. doi: 10.1016/S1474-4422(17)30470-2. - DOI - PubMed
    1. Reich DS, et al. 2021 MAGNIMS-CMSC-NAIMS consensus recommendations on the use of MRI in patients with multiple sclerosis. Lancet Neurol. 2018;378(2):169–670. doi: 10.1016/S1474-4422(21)00095-8. - DOI - PubMed
    1. Ness NH, et al. Differentiating societal costs of disability worsening in multiple sclerosis. J Neurol. 2020;267(4):1035–1042. doi: 10.1007/s00415-019-09676-4. - DOI - PubMed
    1. Hamada MS, et al. Loss of saltation and presynaptic action potential failure in demyelinated axons. Front Cell Neurosci. 2017;11:45. doi: 10.3389/fncel.2017.00045. - DOI - PMC - PubMed
    1. Hamada MS, Kole MH. Myelin loss and axonal ion channel adaptations associated with gray matter neuronal hyperexcitability. J Neurosci. 2015;35(18):7272–7286. doi: 10.1523/JNEUROSCI.4747-14.2015. - DOI - PMC - PubMed

Publication types