

Molecular features of prostate cancer after neoadjuvant therapy in the phase 3 CALGB 90203 trial
- PMID: 37676819
- PMCID: PMC10777679
- DOI: 10.1093/jnci/djad184
Molecular features of prostate cancer after neoadjuvant therapy in the phase 3 CALGB 90203 trial
Abstract
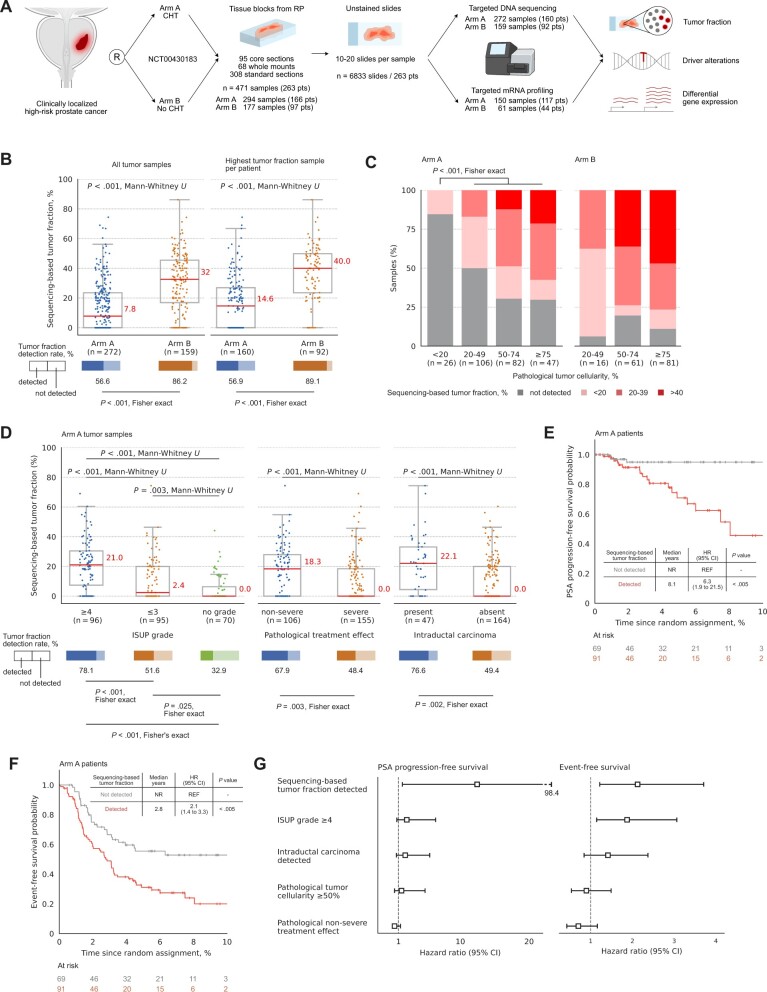
Background: The phase 3 CALGB 90203 (Alliance) trial evaluated neoadjuvant chemohormonal therapy for high-risk localized prostate cancer before radical prostatectomy. We dissected the molecular features of post-treated tumors with long-term clinical outcomes to explore mechanisms of response and resistance to chemohormonal therapy.
Methods: We evaluated 471 radical prostatectomy tumors, including 294 samples from 166 patients treated with 6 cycles of docetaxel plus androgen deprivation therapy before radical prostatectomy and 177 samples from 97 patients in the control arm (radical prostatectomy alone). Targeted DNA sequencing and RNA expression of tumor foci and adjacent noncancer regions were analyzed in conjunction with pathologic changes and clinical outcomes.
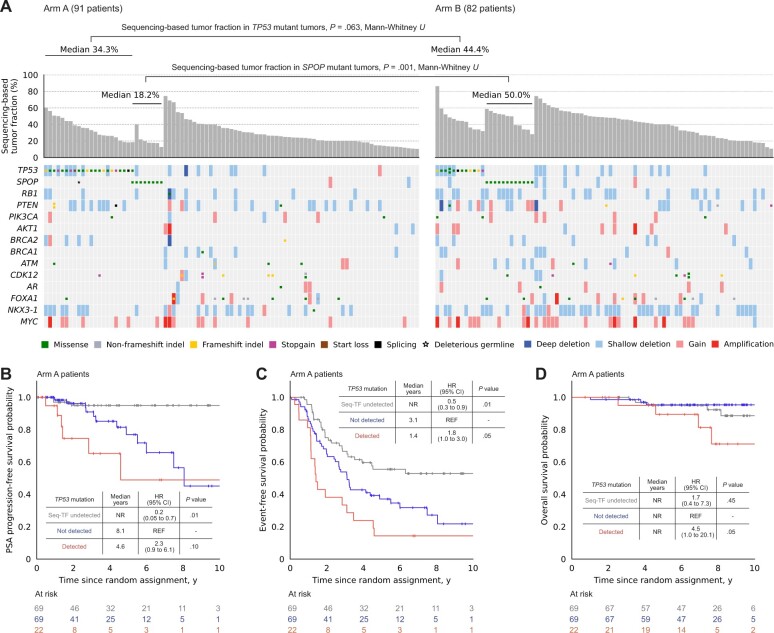
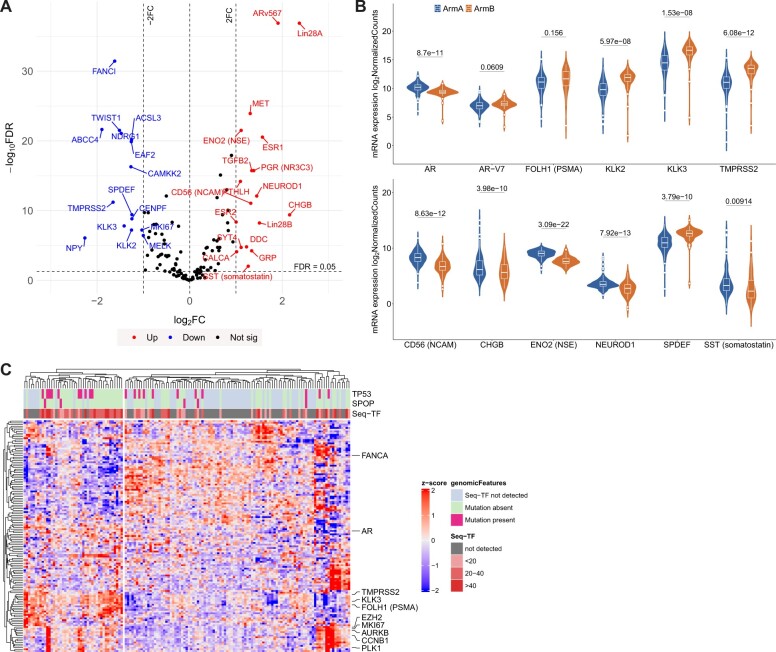
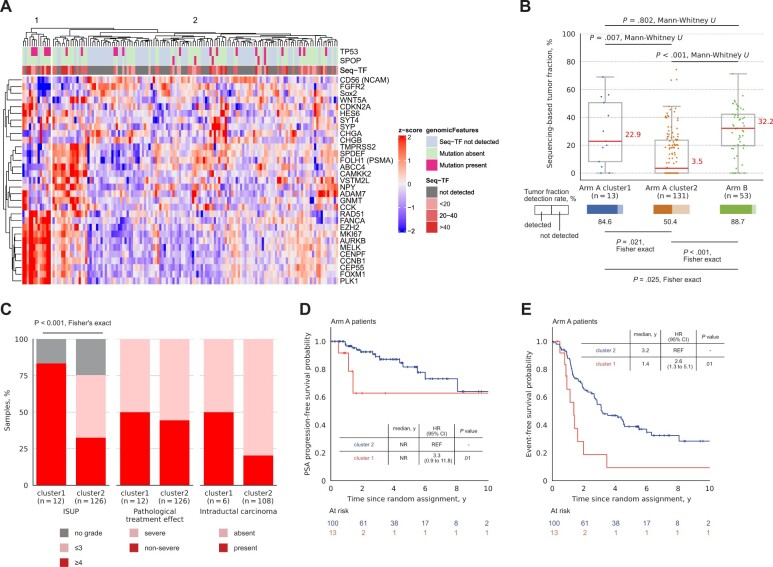
Results: Tumor fraction estimated from DNA sequencing was significantly lower in post-treated tumor tissues after chemohormonal therapy compared with controls. Higher tumor fraction after chemohormonal therapy was associated with aggressive pathologic features and poor outcomes, including prostate-specific antigen-progression-free survival. SPOP alterations were infrequently detected after chemohormonal therapy, while TP53 alterations were enriched and associated with shorter overall survival. Residual tumor fraction after chemohormonal therapy was linked to higher expression of androgen receptor-regulated genes, cell cycle genes, and neuroendocrine genes, suggesting persistent populations of active prostate cancer cells. Supervised clustering of post-treated high-tumor-fraction tissues identified a group of patients with elevated cell cycle-related gene expression and poor clinical outcomes.
Conclusions: Distinct recurrent prostate cancer genomic and transcriptomic features are observed after exposure to docetaxel and androgen deprivation therapy. Tumor fraction assessed by DNA sequencing quantifies pathologic response and could be a useful trial endpoint or prognostic biomarker. TP53 alterations and high cell cycle transcriptomic activity are linked to aggressive residual disease, despite potent chemohormonal therapy.
© The Author(s) 2023. Published by Oxford University Press. All rights reserved. For permissions, please email: journals.permissions@oup.com.
Conflict of interest statement
A.W. reports advisory roles and/or speaking engagements for Astellas, AstraZeneca, Bayer, EMD Serono, Janssen, Merck, and Pfizer and a contract research agreement with ESSA Pharma. H.B. has served as consultant/advisory board member for Janssen, Astellas, Merck, Pfizer, Foundation Medicine, Blue Earth Diagnostics, Amgen, Bayer, Oncorus, LOXO, Daiichi Sankyo, Sanofi, Curie Therapeutics, Astra Zeneca, Novartis, and Fusion Pharma and has received research funding (to institution) from Janssen, AbbVie/Stemcentrx, Eli Lilly, Astellas, Millennium, Bristol Myers Squibb, Circle Pharma, and Daiichi Sankyo.
Figures
Comment in
-
Defining biology and recurrence risk in prostate cancers treated by neoadjuvant chemohormonal therapy.J Natl Cancer Inst. 2024 Jan 10;116(1):12-14. doi: 10.1093/jnci/djad192. J Natl Cancer Inst. 2024. PMID: 37816132 Free PMC article. No abstract available.
Similar articles
-
Postradical prostatectomy prostate-specific antigen outcomes after 6 versus 18 months of perioperative androgen-deprivation therapy in men with localized, unfavorable intermediate-risk or high-risk prostate cancer: Results of part 2 of a randomized phase 2 trial.Cancer. 2024 May 1;130(9):1629-1641. doi: 10.1002/cncr.35170. Epub 2024 Jan 1. Cancer. 2024. PMID: 38161319 Clinical Trial.
-
Neo-adjuvant and adjuvant hormone therapy for localised and locally advanced prostate cancer.Cochrane Database Syst Rev. 2006 Oct 18;2006(4):CD006019. doi: 10.1002/14651858.CD006019.pub2. Cochrane Database Syst Rev. 2006. PMID: 17054269 Free PMC article.
-
177Lu-PSMA-617 Consolidation Therapy After Docetaxel in Patients with Synchronous High-Volume Metastatic Hormone-Sensitive Prostate Cancer: A Randomized, Phase 2 Trial.J Nucl Med. 2025 Jul 1;66(7):1068-1074. doi: 10.2967/jnumed.125.269913. J Nucl Med. 2025. PMID: 40404393 Clinical Trial.
-
EAU guidelines on prostate cancer. Part II: Treatment of advanced, relapsing, and castration-resistant prostate cancer.Eur Urol. 2014 Feb;65(2):467-79. doi: 10.1016/j.eururo.2013.11.002. Epub 2013 Nov 12. Eur Urol. 2014. PMID: 24321502
-
Early versus deferred androgen suppression in the treatment of advanced prostatic cancer.Cochrane Database Syst Rev. 2002;(1):CD003506. doi: 10.1002/14651858.CD003506. Cochrane Database Syst Rev. 2002. Update in: Cochrane Database Syst Rev. 2019 Jun 11;6:CD003506. doi: 10.1002/14651858.CD003506.pub2. PMID: 11869665 Updated.
Cited by
-
Defining biology and recurrence risk in prostate cancers treated by neoadjuvant chemohormonal therapy.J Natl Cancer Inst. 2024 Jan 10;116(1):12-14. doi: 10.1093/jnci/djad192. J Natl Cancer Inst. 2024. PMID: 37816132 Free PMC article. No abstract available.
-
Validation of a Digital Pathology-Based Multimodal Artificial Intelligence Biomarker in a Prospective, Real-World Prostate Cancer Cohort Treated with Prostatectomy.Clin Cancer Res. 2025 Apr 14;31(8):1546-1553. doi: 10.1158/1078-0432.CCR-24-3656. Clin Cancer Res. 2025. PMID: 39983011 Free PMC article.
References
-
- Pompe RS, Karakiewicz PI, Tian Z, et al.Oncologic and functional outcomes after radical prostatectomy for high or very high risk prostate cancer: European validation of the current NCCN® guideline. J Urol. 2017;198(2):354-361. - PubMed
-
- Sundi D, Tosoian JJ, Nyame YA, et al.Outcomes of very high-risk prostate cancer after radical prostatectomy: validation study from 3 centers. Cancer. 2019;125(3):391-397. - PubMed
-
- Wilkins LJ, Tosoian JJ, Sundi D, et al.Surgical management of high-risk, localized prostate cancer. Nat Rev Urol. 2020;17(12):679-690. - PubMed
Publication types
MeSH terms
Substances
Grants and funding
- UG1 CA233290/CA/NCI NIH HHS/United States
- U01 CA157703/CA/NCI NIH HHS/United States
- R37 CA24148601A1/BC/NCI NIH HHS/United States
- U10 CA180821/CA/NCI NIH HHS/United States
- P30 CA008748/CA/NCI NIH HHS/United States
- 5 U01 CA157703/GF/NIH HHS/United States
- U10CA180821/NH/NIH HHS/United States
- U10 CA180863/CA/NCI NIH HHS/United States
- UG1 CA233180/CA/NCI NIH HHS/United States
- U10 CA180882/CA/NCI NIH HHS/United States
- R37 CA241486/CA/NCI NIH HHS/United States
- U24 CA196171/CA/NCI NIH HHS/United States
- NH/NIH HHS/United States
LinkOut - more resources
Full Text Sources
Medical
Research Materials
Miscellaneous
