. 2023 Sep 7;19(9):e1010931.
doi: 10.1371/journal.pgen.1010931. eCollection 2023 Sep.

Modeling of African population history using f-statistics is biased when applying all previously proposed SNP ascertainment schemes

Affiliations

Modeling of African population history using f-statistics is biased when applying all previously proposed SNP ascertainment schemes

Pavel Flegontov et al. PLoS Genet. .

Abstract

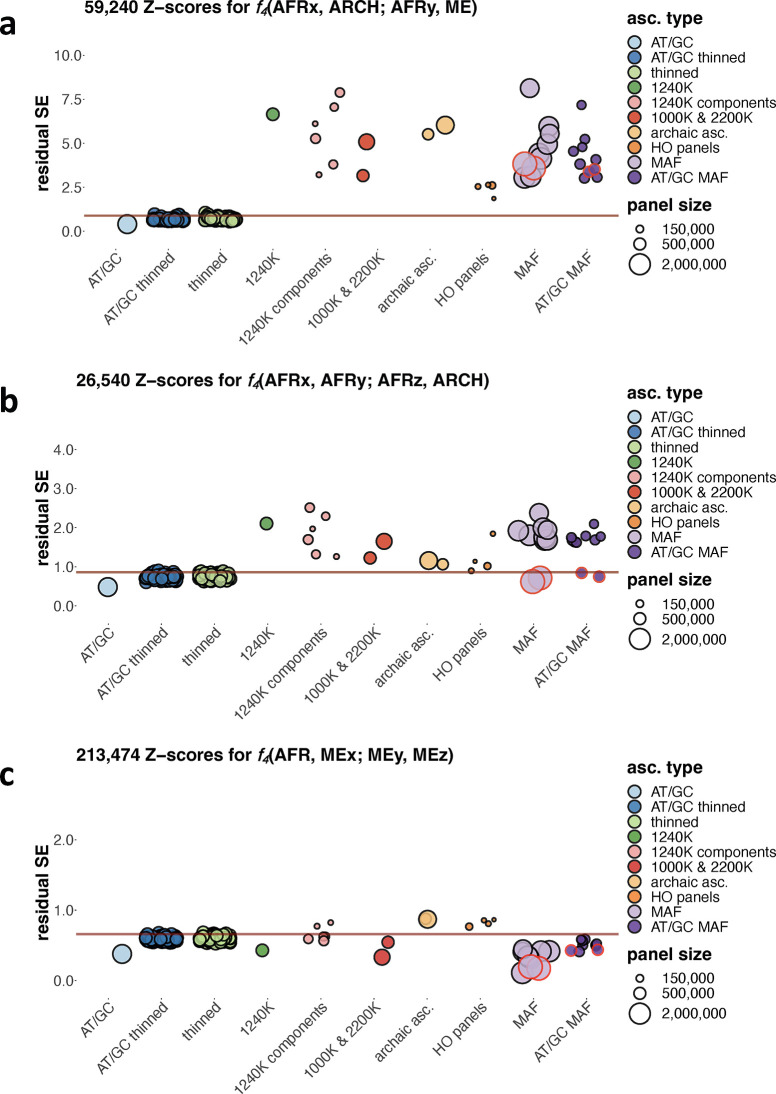
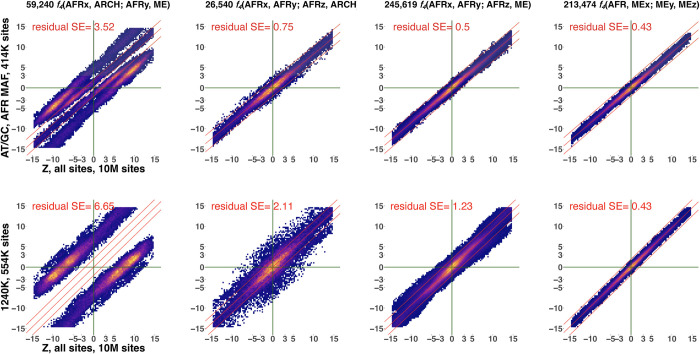
f-statistics have emerged as a first line of analysis for making inferences about demographic history from genome-wide data. Not only are they guaranteed to allow robust tests of the fits of proposed models of population history to data when analyzing full genome sequencing data-that is, all single nucleotide polymorphisms (SNPs) in the individuals being analyzed-but they are also guaranteed to allow robust tests of models for SNPs ascertained as polymorphic in a population that is an outgroup in a phylogenetic sense to all groups being analyzed. True "outgroup ascertainment" is in practice impossible in humans because our species has arisen from a substructured ancestral population that does not descend from a homogeneous ancestral population going back many hundreds of thousands of years into the past. However, initial studies suggested that non-outgroup-ascertainment schemes might produce robust enough results using f-statistics, and that motivated widespread fitting of models to data using non-outgroup-ascertained SNP panels such as the "Affymetrix Human Origins array" which has been genotyped on thousands of modern individuals from hundreds of populations, or the "1240k" in-solution enrichment reagent which has been the source of about 70% of published genome-wide data for ancient humans. In this study, we show that while analyses of population history using such panels work well for studies of relationships among non-African populations and one African outgroup, when co-modeling more than one sub-Saharan African and/or archaic human groups (Neanderthals and Denisovans), fitting of f-statistics to such SNP sets is expected to frequently lead to false rejection of true demographic histories, and failure to reject incorrect models. Analyzing panels of SNPs polymorphic in archaic humans, which has been suggested as a solution for the ascertainment problem, has limited statistical power and retains important biases. However, by carrying out simulations of diverse demographic histories, we show that bias in inferences based on f-statistics can be minimized by ascertaining on variants common in a union of diverse African groups; such ascertainment retains high statistical power while allowing co-analysis of archaic and modern groups.


Conflict of interest statement

The authors declare no competing interests.

Figures

Fig 1
Fig 1. Scatterplots illustrating the effects of the 1240K ascertainment on worst f4-statistic residuals of admixture graphs (WR), explored on exhaustive collections of simple graphs.
Five thousand best-fitting graphs (according to log-likelihood scores on all sites) of 32,745 possible graphs were selected for each combination of five populations, and correlation of WRs was explored for graphs fitted on all sites and on ascertained datasets. WR, also known as admixture graph Z-score, is the residual of an f4-statistic that is fitted the worst by the admixture graph model. Log-likelihood score of an admixture graph model (LL [23]) reflects deviation of all relevant f-statistics from their values predicted under the model and their covariance. Results are shown for three population combinations indicated in plot titles. On x-axes results for all sites or for a randomly thinned site set are shown. Results for the 1240K ascertainment are shown in the upper row on the y-axes, and results for AT/GC sites are shown in the lower row on the y-axes. Linear trends fitted to the plotted points are shown in blue, along with Pearson correlation coefficient.
Fig 2
Fig 2. The effect of ascertainment bias on admixture graph fits illustrated on a population combination "Altai Neanderthal, Ju|’hoan North, Biaka, Yoruba, Agaw".
Five thousand best-fitting graphs (according to log-likelihood scores on all sites) of 32,745 possible graphs were selected, and correlation of worst f4-statistic residuals (WR) of admixture graphs was explored for models fitted on all sites and on ascertained sites. Results for ascertainment on variants common in Africans (either those having no detectable West Eurasian ancestry or all Africans in the SGDP dataset) are circled in red. Thirty eight site subsampling schemes were analyzed (see panel a): 1) AT/GC; 2) random thinning of the AT/GC dataset to the 1240K SNP count for a given combination of groups (no missing data allowed at the group level), results for 100 thinned replicates are shown; 3) random thinning of all sites to the 1240K SNP count, results for 100 thinned replicates are shown; 4) the 1240K enrichment panel; 5) major components of the 1240K panel: sites included in the Illumina 650Y and/or Human Origins (HO) SNP arrays, sites included exclusively in one of them, and remaining sites; 6) the 1000K and 2200K SNP panels; 7) archaic ascertainment (either all such sites or transversions only); 8) the largest HO panels (4, 5, 13) or their union (4+5); 9) MAF ascertainment in one of nine continental-scale groups; 10) the same procedure repeated on AT/GC sites. The size of the resulting SNP panels is coded by point size, and the ten broad ascertainment types are coded by color according to the legend. Squared Pearson correlation coefficients (R2) for admixture graph WR on unascertained vs. ascertained data are plotted. The 2.5th WR percentile of all the thinned replicates combined, including those on all sites and AT/GC sites, is marked with the brown line. The area of the plot where ascertainments are considered biased according to this classifier is highlighted in red on the left. Scatterplots illustrating effects of selected ascertainment schemes on WR are shown in panels b–i. Dots on these scatterplots correspond to distinct admixture graph topologies. The corresponding ascertainment schemes are marked with letters b–i in panel a.
Fig 3
Fig 3. Exploring the influence of non-outgroup ascertainment on fits of admixture graphs in the case of a single simulated history reproducing some known features of the genetic history of anatomically modern and archaic humans (but differing in other respects from the widely accepted model [53]).
Results are presented for two topologies (with or without the Neanderthal to non-African gene flow simulated) and for eight types of SNP sets: 1) 10 sets of randomly selected variable sites matching the average size of the “HO one-panel” set, 500K sites (abbreviated as “subsampled non-asc.”); 2) unascertained sites (on average 5.55M polymorphic sites without missing data at the group level); 3) HO one-panel ascertainment based on the “African 2” group (500K sites on average across simulation iterations); 4) HO four-panel ascertainment, based on randomly selected individuals from four groups (“African 1”, “African 2”, “non-African 1”, and “non-African 2”, 1.34M sites on average); 5) archaic ascertainment (1.05M sites on average); 6) “AFR MAF”, that is restricting to sites with MAF >5% in the union of the “African 1” and “African 2” groups (1.85M sites on average); 7) global MAF ascertainment on the union of the “African 1”, “African 2”, “non-African 1”, and “non-African 2” groups (1.62M sites on average); 8) non-African MAF ascertainment on the union of the “non-African 1” and “non-African 2” groups (1.48M sites on average). (a) The simulated topology, with dates (in generations) shown on the y-axis (for the sake of visual clarity, the axis is not to scale). The Neanderthal to non-African gene flow was simulated either at 0% or at ~2% as shown in the figure. Effective population sizes and population split times are omitted for clarity (see S13 Table). The out-of-Africa bottleneck is marked with a star. (b) Boxplots illustrating the effects of various ascertainment schemes on fits (worst f4-statistic residuals, WR) of the correct admixture graphs. The dashed line on the logarithmic scale marks a WR threshold often used in the literature for classifying models into fitting and non-fitting ones, 3 standard errors. The observation that common ascertainment schemes consistently produce much higher Z-scores than this threshold provides unambiguous evidence that ascertainment bias can profoundly compromise admixture graph fitting. The topologies fitted to the data are shown beside the boxplots. In the panels on the right, simple graphs including only one archaic lineage are fitted (with “Neanderthal 1” used as an example, but very similar results were obtained for the “Neanderthal 2” and “Denisovan” groups). In the panels on the left, results for the full simulated model fitted to the data are shown.
Fig 4
Fig 4. Effects of non-outgroup and true outgroup ascertainment on fits of admixture graphs explored on a collection of 80 random simulated histories.
The worst f4-statistic residual (WR) of the correct admixture graph was used as a measure of bias. (a) WRs for unascertained data and four ascertainment schemes are summarized with boxplots: 1) HO one-panel; 2) HO four-panel; 3) MAF ascertainment on random sets of four populations (abbreviated as “MAF asc.”); 4) ascertainment on sites polymorphic in random sets of three individuals (one individual sampled per population; abbreviated as “3 groups poly asc.”). HO one-panel ascertainment was performed on various types of simulated populations: on non-outgroup populations (“non-OG groups”) or on more or less drifted phylogenetic outgroups (having effective population sizes of 1,000 or 100,000 diploid individuals, respectively) co-modelled with the other populations (abbreviated as “drifted OG” and “OG”, respectively). The individual that was used for HO one-panel ascertainment either acted as the only representative of its group for model fitting, or the whole group of 10 individuals was included in the fitted graph. Alternatively, the group used for HO one-panel ascertainment was not included in the fitted graph: it was either the more or less drifted outgroup, the true root, or the last common ancestor of non-outgroup populations (“non-OG root”). These details are reflected in the plot labels on the right and on the y-axis. The dashed vertical line corresponds to WR = 3 SE. (b) Correct admixture graphs under HO one-panel ascertainment are guaranteed to be well-fitting (WR < ca. 4 SE) if FST between the whole population sample used for ascertainment vs. the sample at the root of the simulation is below 0.12. (c) DAF spectra (derived allele count in a sample of 20 chromosomes vs. proportion of sites in square root scale) are summarized across simulated non-outgroup populations binned by the level of bias in admixture graph fits (approximated by WR of the true admixture graph) observed when HO ascertainment is performed on the respective population. DAF spectra in populations that are the last common ancestors of non-outgroup populations (abbreviated as “non-OG root”) are shown for comparison. The spectra shown here are based only on sites polymorphic in a sample of 20 chromosomes drawn at the root of the simulation (data for sites that are fixed derived or fixed ancestral are not shown, see complete results in S8 Fig). The boxplots summarize DAF across all the simulated admixture graph topologies, and are binned by derived allele counts from 1 to 19.
Fig 5
Fig 5. Variance in f4-statistic Z-scores resulting from ascertainment and random site subsampling expressed as residual standard deviation of a linear trend fitted to a scatterplot of Z-scores on unascertained vs. ascertained data (abbreviated as “residual SE” and expressed in the same units as f4-statistic Z-scores).
Results are shown for three classes of f4-statistics: f4(Africanx, archaic; Africany, Mediterranean/Middle Eastern), f4(Africanx, Africany; Africanz, archaic), and f4(African, Med/MEx; Med/MEy, Med/MEz). The following abbreviations are used for naming the f4-statistics classes: AFR, African populations; ARCH, archaic human individuals (Neanderthals and Denisovans); Med/ME or ME, Mediterranean and Middle Eastern populations. Results for ascertainment on variants common in Africans (either those having no detectable West Eurasian ancestry according to Fan et al. [67] or on all Africans in the SGDP dataset) are circled in red. Residual SE values for f4-statistic Z-scores lying not far from 0 (absolute Z-scores on all sites < 15) are plotted. The 97.5% percentiles of all the thinned replicates combined, including those on all sites and AT/GC sites, are marked by the brown lines. Size of the SNP panels is coded by point size, and the broad ascertainment types are coded by color according to the legend. Thirty eight ascertainment schemes were explored, identical to those in Fig 2.
Fig 6
Fig 6. Scatterplots illustrating the effects of two ascertainment schemes on Z-scores of f4-statistics of four classes including African (abbreviated as AFR) and/or archaic (ARHC) and/or Mediterranean/Middle Eastern (ME) groups.
The f4-statistic classes were selected to represent severe ascertainment bias (leftmost panels), moderate level of bias (two middle panels) and no bias (rightmost panels). The ascertainments selected are 1240K (a SNP enrichment panel most widely used in the archaeogenetic literature) and the new “African MAF” ascertainment scheme proposed in this study to mitigate bias for nearly all f4-statistic classes. For results on other f4-statistic classes see S13 Fig, and results for a wider range of ascertainment schemes are summarized in S11 and S12 Figs. Labels of f4-statistic classes and numbers of statistics plotted are shown above the panels. Instead of individual points, heatmaps illustrating point density are shown. Z-scores on all sites (10 million sites, as indicated on the x-axes) are compared to Z-scores on ascertained datasets on the y-axes. Ascertainment schemes and site counts are shown on the y-axes. All plots include only statistics with absolute Z-scores below 15 on all sites. A linear model fitted to the data and lines representing ± 2 SE are shown in red. Residual standard deviations (residual SE) for those linear trends are shown in each plot in red.

Update of

Similar articles

Cited by

References

    1. Skoglund P, Mathieson I. Ancient genomics of modern humans: The first decade. Annu Rev Genomics Hum Genet. 2018;19: 381–404. doi: 10.1146/annurev-genom-083117-021749 - DOI - PubMed
    1. Stoneking M, Arias L, Liu D, Oliveira S, Pugach I, Rodriguez JJRB. Genomic perspectives on human dispersals during the Holocene. Proc Natl Acad Sci USA. 2023;120: e2209475119. doi: 10.1073/pnas.2209475119 - DOI - PMC - PubMed
    1. Lipson M, Cheronet O, Mallick S, Rohland N, Oxenham M, Pietrusewsky M, et al.. Ancient genomes document multiple waves of migration in Southeast Asian prehistory. Science. 2018;361: 92–95. doi: 10.1126/science.aat3188 - DOI - PMC - PubMed
    1. Hajdinjak M, Mafessoni F, Skov L, Vernot B, Hübner A, Fu Q, et al.. Initial Upper Palaeolithic humans in Europe had recent Neanderthal ancestry. Nature. 2021;592: 253–257. doi: 10.1038/s41586-021-03335-3 - DOI - PMC - PubMed
    1. Prüfer K, Posth C, Yu H, Stoessel A, Spyrou MA, Deviese T, et al.. A genome sequence from a modern human skull over 45,000 years old from Zlatý kůň in Czechia. Nat Ecol Evol. 2021;5: 820–825. doi: 10.1038/s41559-021-01443-x - DOI - PMC - PubMed

Publication types