. 2023 Sep 7;21(9):e3002268.
doi: 10.1371/journal.pbio.3002268. eCollection 2023 Sep.

Reservoir host immunology and life history shape virulence evolution in zoonotic viruses

Affiliations

Reservoir host immunology and life history shape virulence evolution in zoonotic viruses

Cara E Brook et al. PLoS Biol. .

Abstract

The management of future pandemic risk requires a better understanding of the mechanisms that determine the virulence of emerging zoonotic viruses. Meta-analyses suggest that the virulence of emerging zoonoses is correlated with but not completely predictable from reservoir host phylogeny, indicating that specific characteristics of reservoir host immunology and life history may drive the evolution of viral traits responsible for cross-species virulence. In particular, bats host viruses that cause higher case fatality rates upon spillover to humans than those derived from any other mammal, a phenomenon that cannot be explained by phylogenetic distance alone. In order to disentangle the fundamental drivers of these patterns, we develop a nested modeling framework that highlights mechanisms that underpin the evolution of viral traits in reservoir hosts that cause virulence following cross-species emergence. We apply this framework to generate virulence predictions for viral zoonoses derived from diverse mammalian reservoirs, recapturing trends in virus-induced human mortality rates reported in the literature. Notably, our work offers a mechanistic hypothesis to explain the extreme virulence of bat-borne zoonoses and, more generally, demonstrates how key differences in reservoir host longevity, viral tolerance, and constitutive immunity impact the evolution of viral traits that cause virulence following spillover to humans. Our theoretical framework offers a series of testable questions and predictions designed to stimulate future work comparing cross-species virulence evolution in zoonotic viruses derived from diverse mammalian hosts.


Conflict of interest statement

The authors have declared that no competing interests exist.

Figures

Fig 1
Fig 1. Conceptual mechanistic framework to predict zoonotic virus virulence from reservoir immunology and life history traits.
(A) A within-host predator–prey-like model of leukocyte–virus dynamics is embedded in a population-level transmission model for reservoir hosts. Between-host rates of transmission (βrR) and virulence (αrR) are expressed as functions of within-host dynamics to derive optimal virus growth rates in the reservoir (rR*). See S1 File and Table 1 for parameter definitions and values. (B) Because most mammalian hosts are relatively intolerant of virus pathology and immunopathology, viruses typically evolve low optimal growth rates in reservoir hosts (rR*) that minimize virulence incurred on the reservoir (αrR*). Low growth rates should also generate relatively low between-host transmission in the reservoir population (βrR*). Zoonotic viruses evolved in a reservoir host spillover to human hosts to generate acute infections. These spillover infections yield spillover host virulence (αS), which we express as a function of the original growth rate of the reservoir-optimized virus (rR*), combined with the spillover host tolerance of direct virus pathology (TvS). We model this latter term as inverse to phylogenetic distance between reservoir and spillover (human) host. Zoonoses with low rR*—and those from phylogenetically related hosts (like primates) that result in high human TvS—should generate correspondingly low spillover virulence (αS) in human hosts. (C) As a result of unique bat virus tolerance, viruses evolved in bat reservoir hosts may optimize at high rR* values that maximize bat-to-bat transmission (βrR*) but cause only minimal pathology in the bat host (αrR*). Such viruses are likely to generate extreme virulence upon spillover (αS) to secondary hosts, including humans, that lack bat life history traits. The virulence of a virus in its spillover host is amplified (αS) in cases where large phylogenetic distance between reservoir and spillover host results in minimal spillover host tolerance of virus pathology (TvS).
Fig 2
Fig 2. Optimal virus growth rates—and subsequent spillover virulence—vary across reservoir host immunological and life history parameters.
Rows (top-down) indicate the evolutionarily optimal within-host virus growth rate (rR*) and the corresponding between-host transmission rate (βrR*), and virus-induced mortality rate (αrR*) for a reservoir host infected with a virus at rR*. The bottom row then demonstrates the resulting virulence (αS) of a reservoir-optimized virus evolved to rR* upon nascent spillover to a novel, secondary host. Columns demonstrate the dependency of these outcomes on variable within-host parameters in the reservoir host: background mortality (μR), magnitude of constitutive immunity (g0R), rate of leukocyte activation upon viral contact (gR), rate of virus consumption by leukocytes (cR), and leukocyte mortality rate (mR). Darker colored lines depict outcomes at higher reservoir host tolerance of direct virus pathology (TvR, red) or immunopathology (TwR, blue), assuming no tolerance of the opposing type. Heat maps demonstrate how TvR and TwR interact to produce each outcome. Parameter values are reported in Table 1. Figure assumes tolerance in the “constant” form. See S2 Fig for “complete” tolerance assumptions and S3 Fig for changes in αS across a variable range of parameter values for spillover host tolerance of direct virus pathology, TvS, and immunopathology, TwS. Data and code used to generate all figure panels are available in our publicly available GitHub repository (github.com/brooklabteam/spillover-virulence-v1.0.0; doi: 10.5281/zenodo.8136864).
Fig 3
Fig 3. Reservoir host life history traits predict evolution of zoonotic virus virulence.
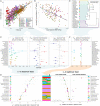
(A) Variation in log10 maximum lifespan (y-axis, in years) with log10 adult body mass (x-axis, in grams) across mammals, with data derived from Jones and colleagues [54] and Healy and colleagues [55]. Points are colored by mammalian order, corresponding to legend. Black line depicts predictions of mammalian lifespan per body mass, summarized from fitted model (but excluding random effect of mammalian order), presented in S2 Table. (B) Baseline neutrophil concentrations (y-axis, in 109 cells/L) per mass-specific metabolic rate (x-axis, in W/g) across mammals, with data from Jones and colleagues [54] and Healy and colleagues [55] combined with neutrophil concentrations from Species360 [53]. Black line projects neutrophil concentration per mass-specific metabolic rate (excluding random effects of mammalian order), simplified from fitted model presented in S2 Table. (C) Order-level parameters for nested modeling framework were derived from fitting of linear models and linear mixed models visualized here and presented in S4 Fig and S2 Table to data from (A) and (B). Average annual mortality rate (μR) was predicted from a linear regression of species-level annual mortality (the inverse of maximum lifespan), as described by a predictor variable of host order; tolerance of immunopathology (TwR) was derived from the scaled effect of host order on the linear mixed effects regression of log10 maximum lifespan (in years) by log10 mass (in grams), incorporating a random effect of order. The magnitude of constitutive immunity (g0R) was derived from the scaled effect of order on the regression of log10 neutrophil concentration per log10 body mass (in grams), combined with BMR (in W) (S4 Fig and S1 and S2 Tables). Panels shown here give numerical estimates for μR and order-level effects from fitted models that were scaled to numerical values for TwR and g0R, as presented in S4 Fig (S1 Table). Red and blue colors correspond to, respectively, significantly positive or negative order-level partial effects from these regressions. (D) Reservoir-host estimates for μR, TwR, and g0R were combined in our modeling framework to generate a prediction of optimal growth rate for a virus evolved in a host of each mammalian order (rR*). Here, point size corresponds to the average number of species-level data points used to generate each of the 3 variable parameters impacting rR*, as indicated in legend. (E) Phylogenetic distance from Primates (in millions of years, indicated by color) on a timescaled phylogeny, using data from TimeTree [56]. (F) An order-level estimate for the nested model parameter, TvS, the spillover human host tolerance of pathology induced by a virus evolved in a different reservoir order, was estimated as the scaled inverse of the phylogenetic distance shown in (E) (S4 Fig and S1 Table). (G) Reservoir-host predictions of optimal virus growth rates (rR*) from (D) were combined with human spillover host estimates of tolerance for direct virus pathology (TvS) from (F) in our nested modeling framework to generate a prediction of the relative spillover virulence (αS) of a virus evolved in a given reservoir host order immediately following spillover into a secondary, human host. Here, the left panel visualizes predictions from our nested modeling framework, using order-specific parameters for μR, TwR, g0R, and TvS (S1 Table). The right panel depicts relative human αS estimates derived from case fatality rates and infection duration reported in the zoonotic literature [8]. For the left panel, point size corresponds to the average number of species-level data points used to generate each of the 4 variable parameters impacting αS. For the right panel, point size indicates the total number of independent host–virus associations from which virulence estimates were determined. In (C), (D), and (G), 95% confidence intervals were computed by standard error; in (G) for the left panel, these reflect the upper and lower confidence intervals of the optimal virus growth rate in (D). See S1 Table for order-level values for rR*, μR, TwR, g0R, and TvS and Table 1 for all other default parameters involved in calculation of αS. Sensitivity analyses for zoonotic predictions are summarized in S5–S9 Figs and S3 Table. Data and code used to generate all figure panels are available in our publicly available GitHub repository (github.com/brooklabteam/spillover-virulence-v1.0.0; doi: 10.5281/zenodo.8136864).

Comment in

Similar articles

Cited by

References

    1. Bonneaud C, Longdon B. Emerging pathogen evolution. EMBO Rep. 2020;21:e51374. - PMC - PubMed
    1. André JB, Hochberg ME. Virulence evolution in emerging infectious diseases. Evolution. 2005;59(7):1406. - PubMed
    1. Bolker BM, Nanda A, Shah D. Transient virulence of emerging pathogens. J R Soc Interface. 2010;7(46):811–822. doi: 10.1098/rsif.2009.0384 - DOI - PMC - PubMed
    1. Guth S, Visher E, Boots M, Brook CE. Host phylogenetic distance drives trends in virus virulence and transmissibility across the animal—human interface. Philos Trans R Soc B. 2019;374(1782):20190296. doi: 10.1098/rstb.2019.0296 - DOI - PMC - PubMed
    1. Farrell MJ, Davies TJ. Disease mortality in domesticated animals is predicted by host evolutionary relationships. Proc Natl Acad Sci U S A. 2019;116(16):7911–7915. doi: 10.1073/pnas.1817323116 - DOI - PMC - PubMed

Publication types