. 2023 Sep 8;381(6662):eabn4180.
doi: 10.1126/science.abn4180. Epub 2023 Sep 8.

Modulation of the proteostasis network promotes tumor resistance to oncogenic KRAS inhibitors

Affiliations

Modulation of the proteostasis network promotes tumor resistance to oncogenic KRAS inhibitors

Xiangdong Lv et al. Science. .

Abstract

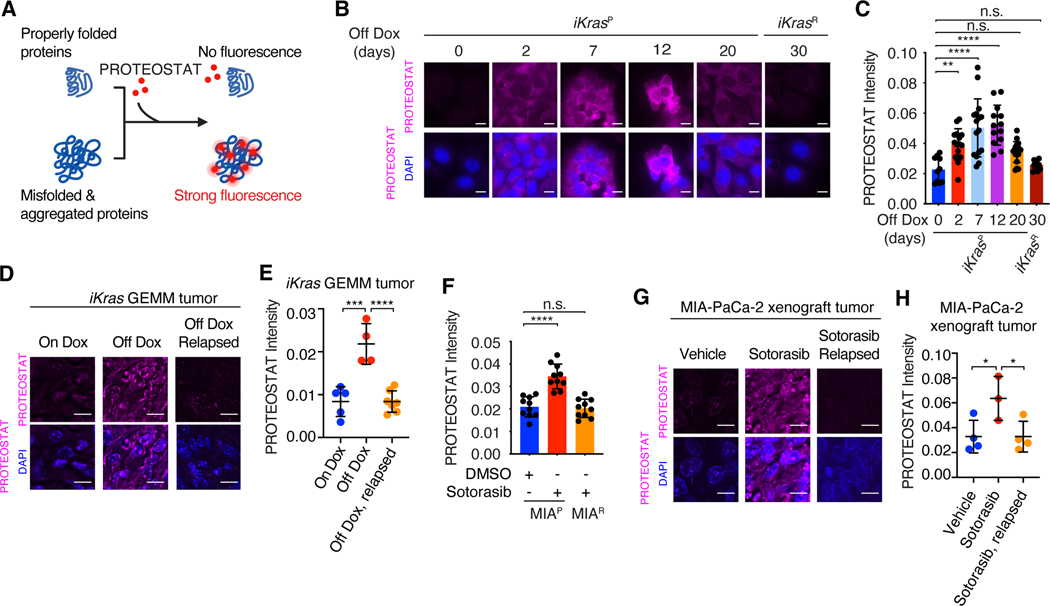
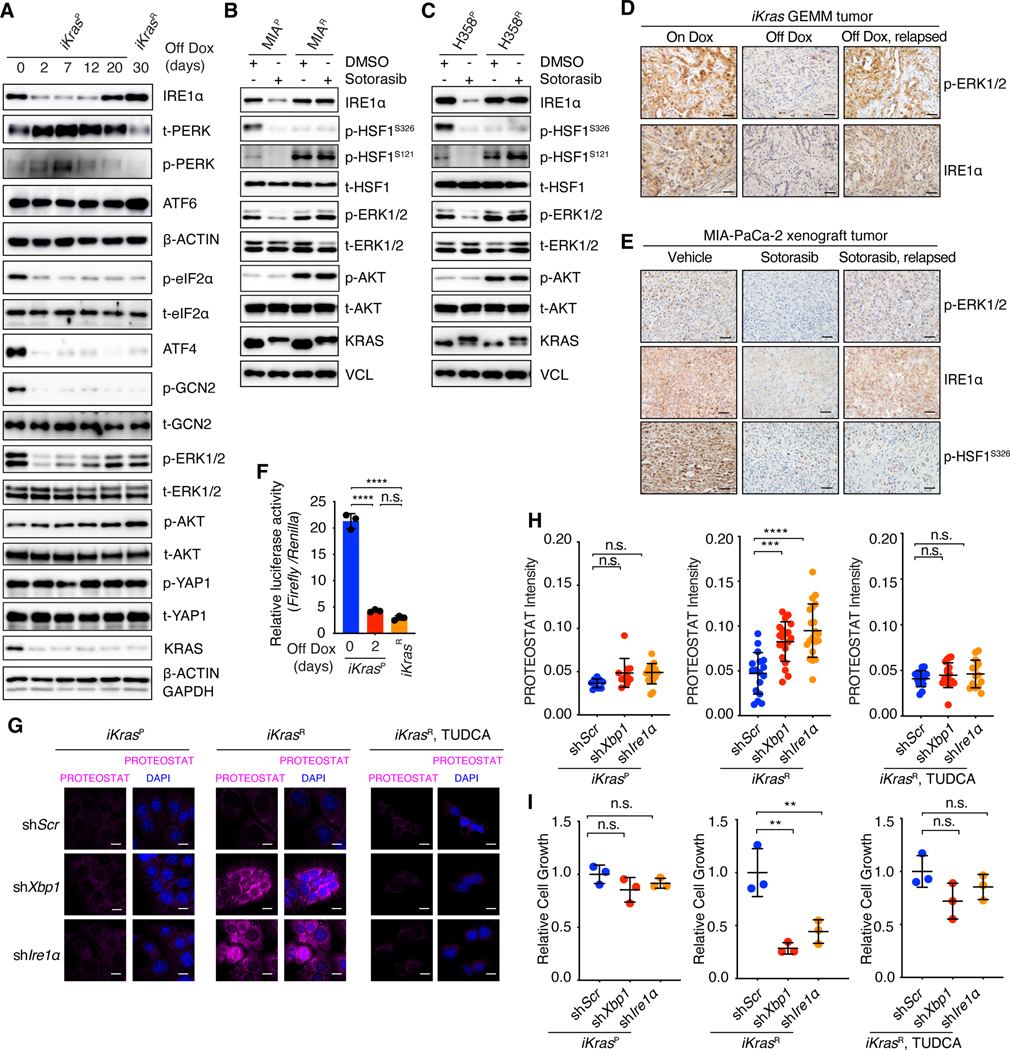
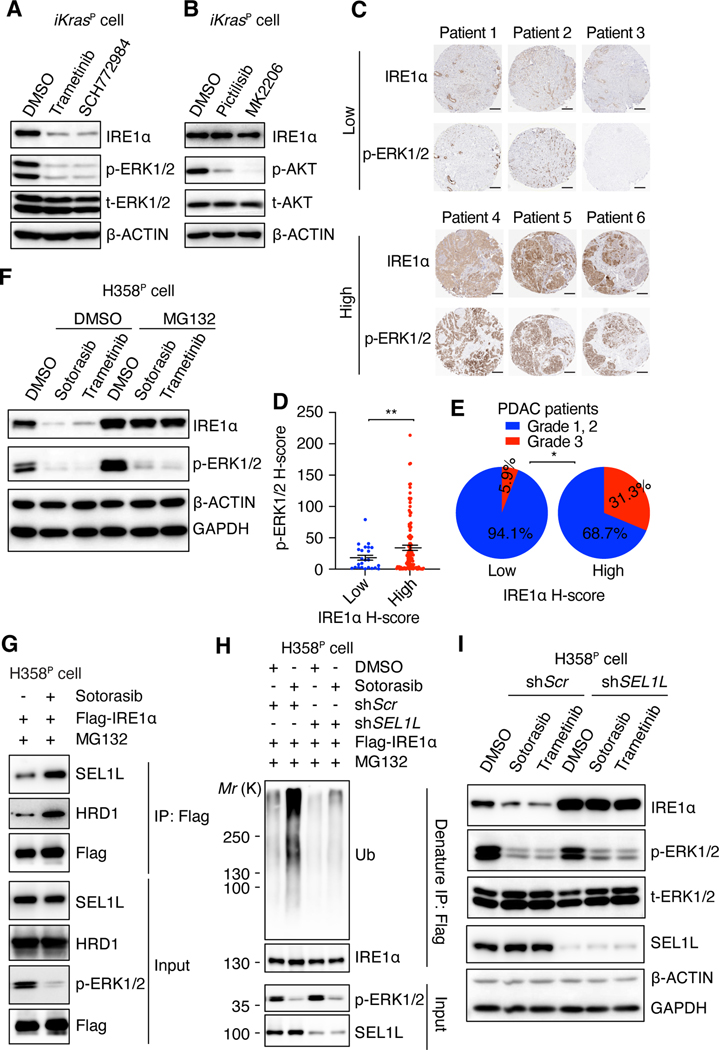
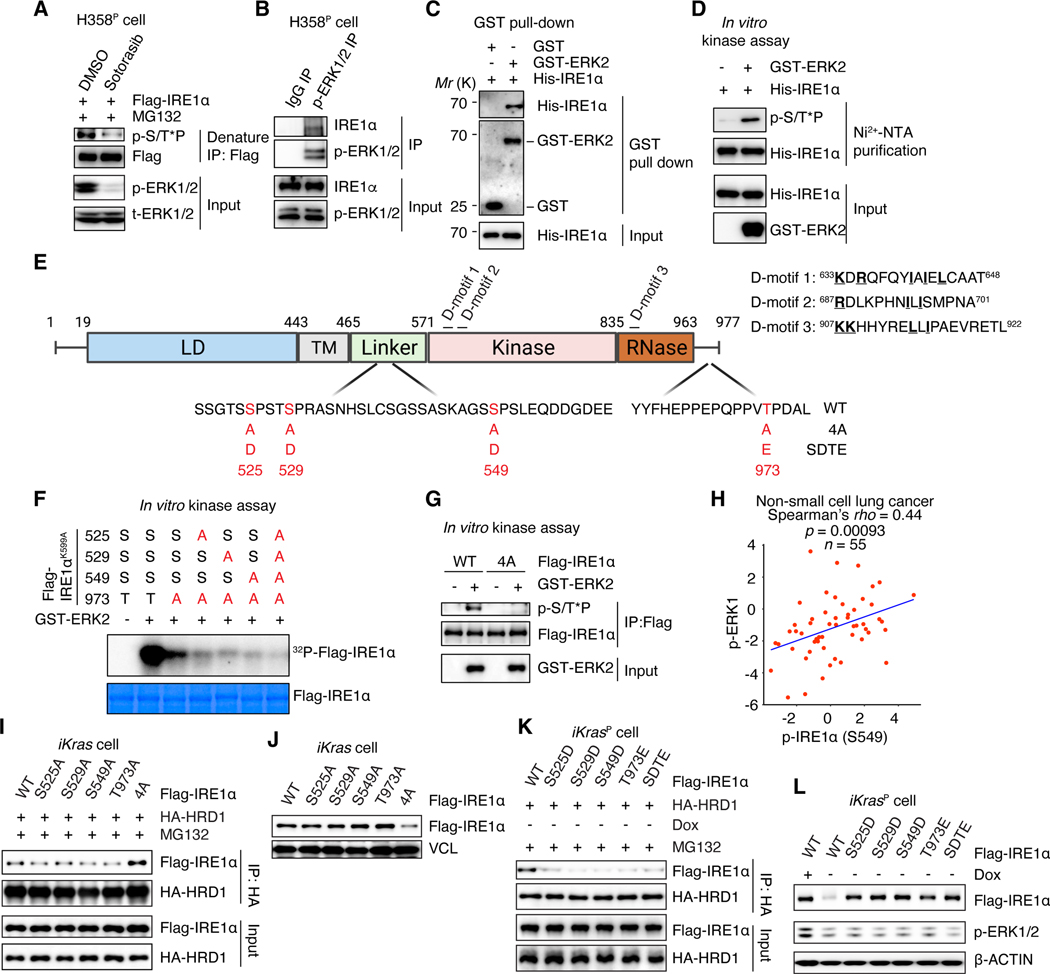
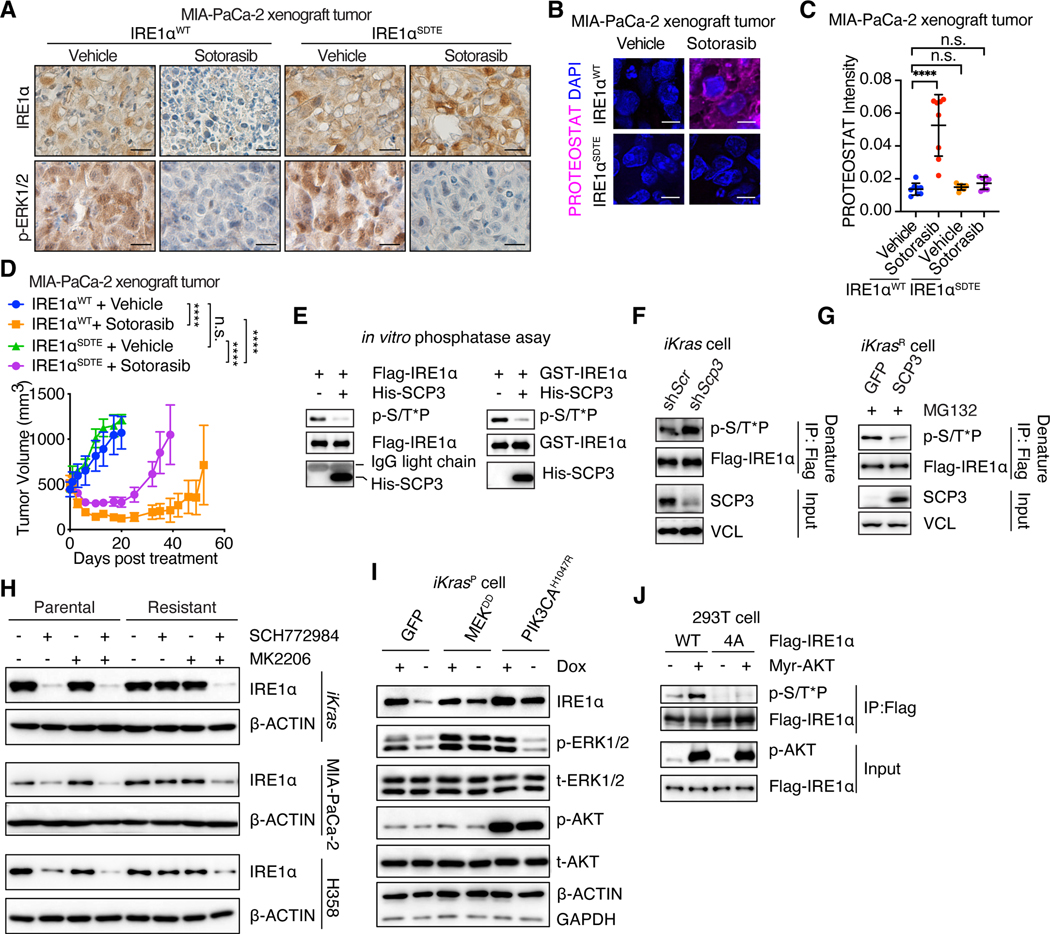
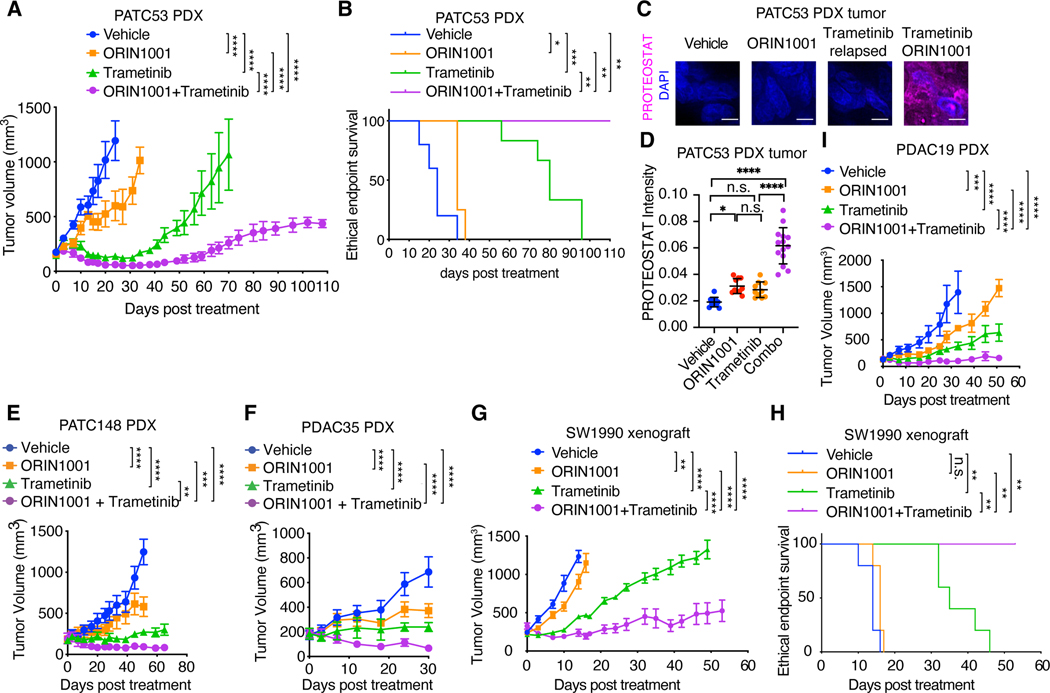
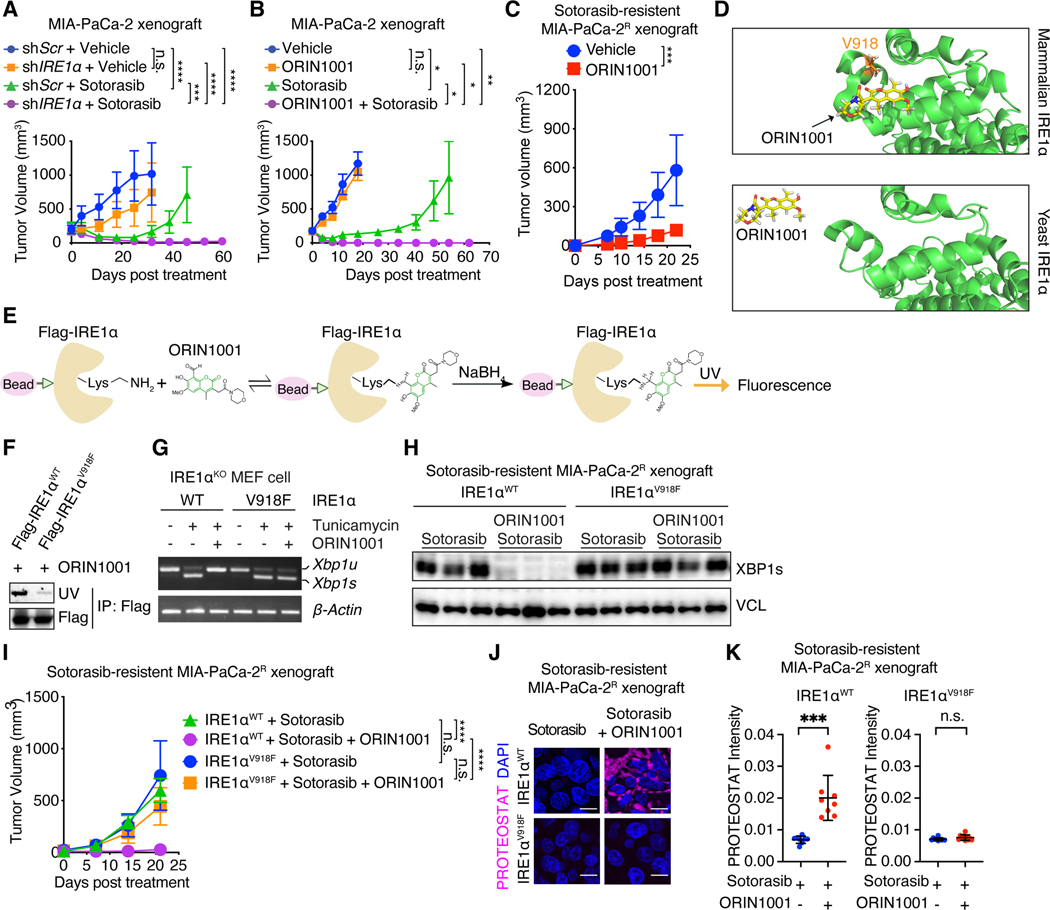
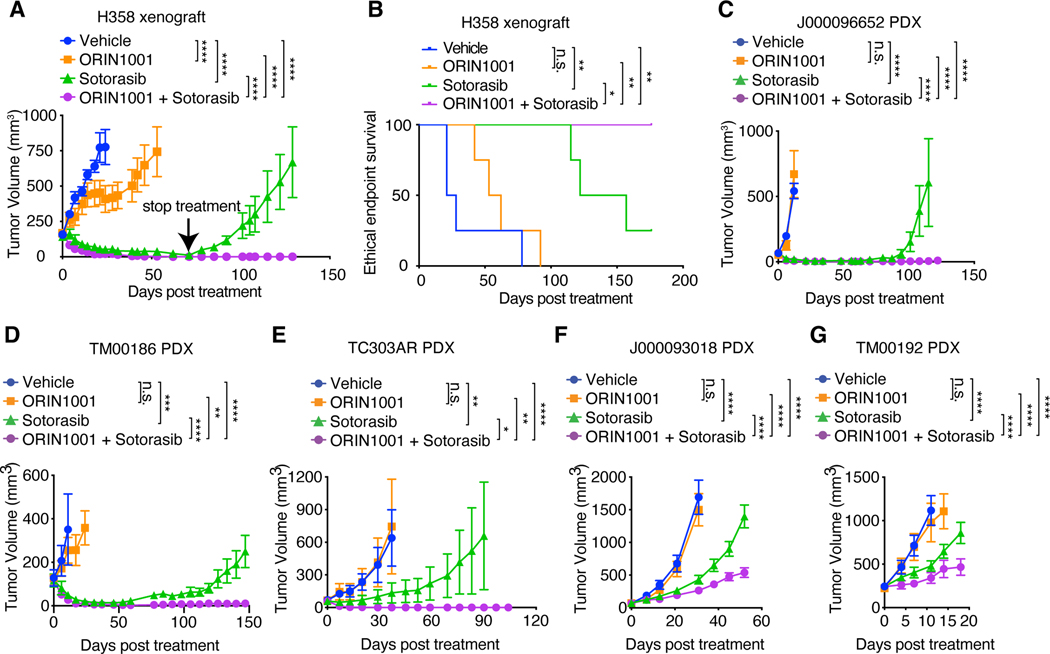
Despite substantial advances in targeting mutant KRAS, tumor resistance to KRAS inhibitors (KRASi) remains a major barrier to progress. Here, we report proteostasis reprogramming as a key convergence point of multiple KRASi-resistance mechanisms. Inactivation of oncogenic KRAS down-regulated both the heat shock response and the inositol-requiring enzyme 1α (IRE1α) branch of the unfolded protein response, causing severe proteostasis disturbances. However, IRE1α was selectively reactivated in an ER stress-independent manner in acquired KRASi-resistant tumors, restoring proteostasis. Oncogenic KRAS promoted IRE1α protein stability through extracellular signal-regulated kinase (ERK)-dependent phosphorylation of IRE1α, leading to IRE1α disassociation from 3-hydroxy-3-methylglutaryl reductase degradation (HRD1) E3-ligase. In KRASi-resistant tumors, both reactivated ERK and hyperactivated AKT restored IRE1α phosphorylation and stability. Suppression of IRE1α overcame resistance to KRASi. This study reveals a druggable mechanism that leads to proteostasis reprogramming and facilitates KRASi resistance.


Conflict of interest statement

M.F.R. receives research funding from Pfizer and Genentech. M.F.R. is a consultant and receives consulting fees from: Novartis, Seagen, Macrogenics, and AstraZeneca. M.F.R. is the Principal Investigator of the clinical trial NCT03950570. X.C. reports previous research funding from Fosun Pharma. J.A.R. reports receiving a commercial research grant from The University of Texas MD Anderson Cancer Center, sponsored research agreement from Genprex, Inc, has ownership interest (including stock, patents, etc.) in Genprex, Inc., and is a consultant/advisory board member for Genprex, Inc. M.J.E. reports full time employment with AstraZeneca from March 7th 2022. M.J.E. holds patents and receives income from Veracyte on the PAM50-based products, Prosigna.

Figures

Fig. 1.
Fig. 1.. Oncogenic KRAS inactivation reprograms proteostasis.
(A) Schematic illustration of labeling and detection of misfolded and aggregated proteins with PROTEOSTAT dye. Upon intercalation into the cross-beta spine typically found in misfolded and aggregated proteins, PROTEOSTAT dye emits strong fluorescence. (B and C) Representative images (B) and quantification (C) of PROTEOSTAT (magenta) and DAPI (blue) staining in iKrasP cells at different time points after KrasG12D inactivation by Dox-withdrawal (Off Dox) until the cells acquired resistance to KrasG12D inactivation (iKrasR cell). (D and E) Representative images (D) and quantification (E) of PROTEOSTAT (magenta) staining in spontaneous tumors from the Dox-inducible, KrasG12D-driven PDAC mouse model (iKras GEMM) treated with doxycycline (Dox, 2g/L, n=5), Dox withdrawal for 3 days (n=4) or relapsed after 30 weeks of Dox-withdrawal (n=7). (F) Quantification of PROTEOSTAT intensity in parental MIA-PaCa-2 (MIAP) cells treated with DMSO or 30nM sotorasib for 2 days or in sotorasib-resistant MIA-PaCa-2 (MIAR) cells treated with 30nM sotorasib. MIAR cells were generated in vitro by continued sotorasib treatment until the cells acquired resistance. (G and H) Representative images (G) and quantification (H) of PROTEOSTAT (magenta) and DAPI (blue) staining in MIA-PaCa-2 xenograft tumors treated with vehicle (n=4), sotorasib (30mg/kg for 1 day, n=3), or relapsed after 9 weeks of sotorasib treatment (30mg/kg, n=4). Data represent average fluorescence intensity of PROTEOSTAT/cell from each image (C and F) or tumor (E and H) and are presented as mean ± SD from n≥10 images. Scale bar: 20μm. Ordinary one-way ANOVA with Dunnett’s multiple comparisons test (C, E, F and H) was used to calculate P values. n.s., not significant, * P<0.05, **P < 0.01, ***P < 0.001, ****P < 0.0001.
Fig. 2.
Fig. 2.. Oncogenic KRAS inactivation differentially impacts the key nodes of the proteostasis regulatory network.
(A) Immunoblot with indicated antibodies in whole-cell lysates of iKrasP at different time points after KrasG12D inactivation by Dox-withdrawal (Off Dox) until the cells acquired resistance to KrasG12D inactivation (iKrasR cell). (B and C) Immunoblot with indicated antibodies in whole-cell lysates of parental or sotorasib-resistant MIA-PaCa-2 (B) or H358 (C) cells treated with DMSO or 30 nM sotorasib. (D) Immunohistochemical (IHC) staining with indicated antibodies in iKras GEMM tumors treated with doxycycline (On Dox), Dox withdrawal for 3 days (Off Dox), or relapsed after 30 weeks of Dox-withdrawal (Off Dox, relapsed). (E) IHC staining with indicated antibodies in MIA-PaCa-2 xenograft tumors treated with vehicle, sotorasib (30mg/kg for 1 day), or relapsed after 9 weeks of sotorasib treatment (30mg/kg). (F) Relative HSE luciferase activity in iKrasP or iKrasR cells cultured in the presence or absence of Dox for 2 days. Data are shown as mean ± SD, n=3. (G and H) Representative images (G) and quantification (H) of PROTEOSTAT (magenta) and DAPI (blue) staining in iKrasP or iKrasR cells infected with lentiviruses encoding scramble shRNA (shScr), Xbp1 shRNA (shXbp1) or Ire1 α shRNA (shIre1α). Cells were treated with 2.5mM TUDCA dissolved in water for 2 days as indicated. Data represent the average fluorescence intensity of PROTEOSTAT/cell from each image acquired and presented as mean ± SD from n=10 (On Dox), n=17 (Off Dox), or n=17 (Off Dox + TUDCA) images. (I) CCK-8 assay was used to quantify cell viability of iKras cells treated as in G and H. Data are presented as mean ± SD relative to shScr, n=3. Ordinary one-way ANOVA with Dunnett’s multiple comparisons test (H and I) or ordinary one-way ANOVA with Tukey’s multiple comparisons test (F) was used to calculate P values. n.s., not significant, **P < 0.01, ***P < 0.001, ****P < 0.0001. Scale bar: 40μm (D and E) or 20μm (G).
Fig. 3.
Fig. 3.. KRAS-MAPK signaling stabilizes IRE1a through inhibiting SEL1L-HRD1 mediated IRE1a ubiquitination.
(A and B) Immunoblot with indicated antibodies in whole-cell lysates of iKrasP cells treated with DMSO, trametinib (MEK inhibitor, 20 nM), SCH772984 (ERK inhibitor, 1 μM), pictilisib (PI3K inhibitor, 1 μM), or MK2206 (AKT inhibitor, 2 μM) as indicated for 2 days. (C) Representative images of IHC staining of IRE1α and p-ERK1/2 in tissue microarray of treatment naïve tumors from PDAC patients. Scale bar: 200μm. (D) H-score of p-ERK1/2 in tissue microarray samples with distinct IRE1α intensities. Data are presented as mean ± SEM. (E) Proportion of patients with different tumor grades in PDAC patients with low or high IRE1α H-score. (F) Immunoblot with indicated antibodies in whole-cell lysates of H358P cells treated with DMSO, 30 nM sotorasib or 20 nM trametinib for 2 days. Cells were treated with DMSO or 1 μM MG132 for 12h before harvest. (G) Sotorasib promotes the interaction between IRE1α and SEL1L/HRD1. H358P cells expressing Flag-IRE1a were treated with DMSO or 30 nM sotorasib for 2 days and subjected to immunoprecipitation (IP) with anti-Flag M2 agarose beads. (H) Sotorasib promotes SEL1L-dependent IRE1α ubiquitination. H358P cells expressing Flag-IRE1α and shScr or shSEL1L were treated with DMSO or 30 nM sotorasib for 2 days and subjected to denature IP with anti-Flag M2 agarose beads. The immunoblot was probed with anti-ubiquitin (Ub) antibody to detect IRE1α ubiquitination. MG132 (1 μM) was added into the culture medium 12 h before harvest (G and H). (I) Immunoblot with indicated antibodies in whole-cell lysates of H358P cells infected with lentiviruses encoding shScr or shSEL1L and treated with DMSO, 30 nM sotorasib, or 20 nM trametinib for 2 days. 2-tailed, unpaired Student’s t test with Welch’s correction (D) or Fisher’s exact test (E) was used to calculate P values. * P<0.05, **P < 0.01.
Fig. 4.
Fig. 4.. ERK directly phosphorylates and stabilizes IRE1α.
(A) H358P cells expressing Flag-IRE1a were treated with DMSO or 30 nM sotorasib for 2 days and subjected to denature IP with anti-Flag M2 agarose beads. The immunoblot was probed with anti-phospho-MAPK substrates motif (S/T*P) antibody (p-S/T*P) to detect IRE1α phosphorylation. (B) Whole-cell lysate of H358P cells were subjected to co-IP with rabbit anti-p-ERK1/2 antibody or normal rabbit IgG. (C) GST pull-down assay was performed using recombinant His-tagged IRE1α and GST-ERK2 protein. (D) In vitro kinase assay was performed using recombinant GST-ERK2 and His-IRE1α. After phosphorylation reaction, the proteins were denatured by 8M urea buffer and subjected to purification of His-IRE1α with Ni2+-NTA agarose to detect IRE1α phosphorylation using anti-p-S/T*P antibody. (E) Schematic illustration of human IRE1α protein domains, three putative ERK binding D-motifs and ERK phosphorylation sites at Ser525, Ser529, Ser549, and Thr973 (red). Phospho-deficient (4A) and phospho-mimetic (SDTE) mutations of IRE1α are shown. LD: luminal domain. TM: transmembrane domain. (F) In vitro [g-32P] ATP kinase assay using different Flag-tagged IRE1α mutants and GST-ERK2. The IRE1α phosphorylation was detected by autoradiography. One-Step Blue Protein Stain was used to detect IRE1α protein loading. (G) In vitro kinase assay using equal amount of Flag-tagged WT or phospho-deficient IRE1α mutant proteins (4A) and GST-ERK2. (H) Spearman correlation between p-IRE1α (at S549) and p-ERK1 (at Y204) in 55 patients with non-small cell lung cancer. (I and K) Whole-cell lysates of iKras cells expressing HA-HRD1 together with WT or mutant IRE1α cultured in the absence of Dox were subjected to IP with anti-HA agarose beads to detect IRE1α interaction with HRD1. MG132 (1 μM) was added into the culture medium 12h before harvest (A, I and K). (J and L) Immunoblot of WT or mutant IRE1α in whole-cell lysates of iKras cells cultured in the presence or absence of Dox for 2 days.
Fig. 5.
Fig. 5.. Multiple pathways converge to restore IRE1α in KRASi-resistant cancer cells.
(A) IHC staining of p-ERK1/2 and IRE1α in shRNA-resistant IRE1αWT- or IRE1αSDTE-transduced, endogenous IRE1α-depleted MIA-PaCa-2 tumors treated with vehicle or sotorasib (100mg/kg) for 4 days. Scale bar: 40μm. (B-C) Representative images (B) and quantification (C) of PROTEOSTAT (magenta) and DAPI (blue) staining in MIA-PaCa-2 tumors as in (A). Data represent average fluorescence intensity of PROTEOSTAT/cell from each image acquired and are presented as mean ± SD from n=8 independent images. Scale bar: 20μm. (D) Tumor volume quantification of MIA-PaCa-2 tumors as in (A). (E) In vitro phosphatase assay. Phosphorylated Flag-IRE1α protein purified from MEKDD-expressing 293T cells (Left panels) or recombinant IRE1α protein phosphorylated by recombinant ERK2 in vitro (Right panels) were subjected to in vitro phosphatase assay with recombinant SCP3. (F-G) iKras cells expressing Flag-IRE1α were infected with shRNA targeting Scr or Scp3 (F), GFP- or SCP3- expressing lentivirus (G). The whole cell lysates were subjected to denature IP with anti-Flag M2 agarose beads, followed by immunoblot with anti-pS/T*P antibody to detect IRE1α phosphorylation. (H) Immunoblot of IRE1α in whole-cell lysates of parental and KRAS inhibition-resistant cells treated with DMSO, 2μM MK2206 and/or 1 μM SCH772984 for 2 days (MIA-PaCa-2 and H358 cells) or 14 days (iKras cells). (I) Immunoblot of IRE1α in whole-cell lysates of iKrasP cells expressing GFP, MEKDD, or PIK3CAH1047R in the presence or absence of Dox for 2 days. (J) 293T cells expressing IRE1αWT or IRE1α4A in the presence or absence of myr-AKT were subjected to IP with anti-Flag M2 agarose beads followed by immunoblot to detect IRE1α phosphorylation. Ordinary one-way ANOVA with Dunnett’s multiple comparisons test (C), and Two-way ANOVA with Bonferroni’s multiple comparisons test (D) were used to calculate P values. n.s., not significant, **P < 0.01, ***P < 0.001, ****P < 0.0001.
Fig. 6.
Fig. 6.. IRE1α inhibition sensitizes oncogenic KRAS-driven tumors to MEK inhibition.
(A) Tumor volume quantification of established PATC53 PDX tumors in SCID/beige mice treated with vehicle (n=5), IRE1α RNase inhibitor ORIN1001 (n=4), MEK inhibitor trametinib (n=6), or ORIN1001 plus trametinib (n=4). (B) Kaplan-Meier survival curve of PATC53 PDX tumor-bearing mice under treatment as indicated in (A). (C-D) Representative images (C) and quantification (D) of PROTEOSTAT (magenta) and DAPI (blue) staining in endpoint PATC53 xenograft tumors treated as in (A). Data represent average fluorescence intensity of PROTEOSTAT/cell from each image acquired and are presented as mean ± SD from n=10 independent images. Scale bar: 20μm. (E) Tumor volume quantification of established PATC148 PDX tumors in SCID/beige mice treated with vehicle (n=6), ORIN1001 (n=6), trametinib (n=4), or ORIN1001 plus trametinib (n=4). (F) Tumor volume quantification of established PDAC35 PDX tumors in SCID/beige mice treated with vehicle (n=5), ORIN1001 (n=4), trametinib (n=4), or ORIN1001 plus trametinib (n=4). (G) Tumor volume quantification of established SW1990 PDAC xenograft tumors in SCID/beige mice treated with vehicle (n=6), ORIN1001 (n=6), trametinib (n=5), or ORIN1001 plus trametinib (n=4). (H) Kaplan-Meier survival curve of SW1990 PDAC xenograft tumor-bearing mice under treatment as indicated in (G). (I) Tumor volume quantification of established PDAC19 PDX tumors in SCID/beige mice treated with vehicle, ORIN1001, trametinib, or ORIN1001 plus trametinib (n=4). ORIN1001: 150mg/kg. Trametinib: 1mg/kg. Data are presented as mean ± SEM (A, E to G, I) or mean ± SD (D). Two-way ANOVA with Bonferroni’s multiple comparisons test (A, E to G, I), log-rank (Mantel-Cox) test (B and H), or ordinary one-way ANOVA with Dunnett’s multiple comparisons test (D) was used to calculate P values. n.s., not significant, * P<0.05, **P < 0.01, ***P < 0.001, ****P < 0.0001.
Fig. 7.
Fig. 7.. IRE1α inhibition enhances tumor responses to sotorasib.
(A) Tumor volume of MIA-PaCa-2 tumors transduced with dox-inducible shScr or shIRE1α and treated with doxycycline water, vehicle (n=5) or sotorasib (n=6). (B) Tumor volume of MIA-PaCa-2 tumors treated with vehicle (n=5), ORIN1001 (n=4), sotorasib (n=4), or both (n=5). (C) Tumor volume of sotorasib-resistant MIA-PaCa-2R tumors treated with vehicle (n=4) or ORIN1001 (n=7). (D) Docking modeling of ORIN1001 with IRE1α. V918 is critical for the formation of the shallow pocket at mammalian IRE1α RNase-active site for ORIN1001 binding. (E) Biochemical fluorescence assay detecting the binding between ORIN1001 and IRE1α in vitro. (F) Equal amount of Flag-IRE1αWT or Flag-IRE1αV918F protein purified from 293T cells was used to pull down ORIN1001 in vitro. UV transmission was used to detect ORIN1001 that is covalently bound to IRE1α protein in the SDS-PAGE. (G) Xbp1 splicing in Ire1α-knock out MEF cells expressing IRE1αWT or IRE1αV918F and treated with tunicamycin (5 μg/mL) and/or ORIN1001 (5 μM) for 6 hours as indicated. (H) Immunoblot of XBP1s in shRNA-resistant IRE1αWT or IRE1αV918F-transduced, endogenous IRE1α-depleted MIA-PaCa-2R tumors treated as indicated. (I) Tumor volume of established shRNA-resistant IRE1αWT- or IRE1αV918F- expressing, endogenous IRE1α-depleted, sotorasib-resistant MIA-PaCa-2R tumors treated as indicated. n=10. (J-K) Representative images (J) and quantification (K) of PROTEOSTAT and DAPI staining in MIA-PaCa-2R tumors treated as in (I). Data represent average fluorescence intensity of PROTEOSTAT/cell from each image and are presented as mean ± SD from n>10 independent images. Scale bar: 20μm. Sotorasib: 100mg/kg. ORIN1001: 300mg/kg. Data are presented as mean ± SEM (A, B, C, and I). Two-way ANOVA test with Bonferroni’s multiple comparisons test (A, B, C, and I) or ordinary one-way ANOVA with Dunnett’s multiple comparisons test (K) was used to calculate P values. n.s., not significant, * P<0.05, **P < 0.01, ***P < 0.001, ****P < 0.0001.
Fig. 8.
Fig. 8.. IRE1α inhibition enhances the response of KRASG12C-driven tumors to sotorasib.
(A) Tumor volume quantification of established H358 tumors in SCID/beige mice treated with vehicle, ORIN1001 (150mg/kg), sotorasib (30mg/kg), or ORIN1001 plus sotorasib. (n=4). Treatment was stopped at day 71. (B) Kaplan-Meier survival curve of H358 tumor-bearing mice under different treatments as indicated in (A) from treatment start time. (C) Tumor volume quantification of established J000096652 PDX tumors in NSG mice treated with vehicle (n=6), ORIN1001 (300mg/kg, n=4), sotorasib (100mg/kg, n=7), or ORIN1001 plus sotorasib (n=8). Treatment was stopped at day 65. (D) Tumor volume quantification of established TM00186 PDX tumors in NSG mice treated with vehicle (n=6), ORIN1001 (300mg/kg, n=6), sotorasib (100mg/kg, n=7), or ORIN1001 plus sotorasib (n=9). (E) Tumor volume quantification of established TC303AR PDX tumors in NSG mice treated with vehicle (n=5), ORIN1001 (300mg/kg, n=5), sotorasib (100mg/kg, n=9), or ORIN1001 plus sotorasib (n=9). Treatment was stopped at day 53. (F) Tumor volume quantification of established J000093018 PDX tumors in NSG mice treated with vehicle (n=6), ORIN1001 (300mg/kg, n=6), sotorasib (100mg/kg, n=9), or ORIN1001 plus sotorasib (n=9). (G) Tumor volume quantification of established TM00192 PDX tumors in NSG mice treated with vehicle (n=6), ORIN1001 (300mg/kg, n=5), sotorasib (100mg/kg, n=9), or ORIN1001 plus sotorasib (n=9). Data are presented as mean ± SEM (A, C to G). Two-way ANOVA test with Bonferroni’s multiple comparisons test (A, C to G), log-rank (Mantel-Cox) test (B) was used to calculate P values. n.s., not significant, * P<0.05, **P < 0.01, ***P < 0.001, ****P < 0.0001.

Comment in

References

    1. Scheidig AJ, Burmester C, Goody RS, The pre-hydrolysis state of p21(ras) in complex with GTP: new insights into the role of water molecules in the GTP hydrolysis reaction of ras-like proteins. Structure 7, 1311–1324 (1999). - PubMed
    1. Scheffzek K. et al., The Ras-RasGAP complex: structural basis for GTPase activation and its loss in oncogenic Ras mutants. Science 277, 333–338 (1997). - PubMed
    1. Bollag G, McCormick F, Differential regulation of rasGAP and neurofibromatosis gene product activities. Nature 351, 576–579 (1991). - PubMed
    1. Li C. et al., The G protein signaling regulator RGS3 enhances the GTPase activity of KRAS. Science 374, 197–201 (2021). - PMC - PubMed
    1. McGrath JP, Capon DJ, Goeddel DV, Levinson AD, Comparative biochemical properties of normal and activated human ras p21 protein. Nature 310, 644–649 (1984). - PubMed

MeSH terms