. 2023 Oct;6(5):473-485.
doi: 10.1089/crispr.2023.0033. Epub 2023 Sep 7.

Trichostatin A for Efficient CRISPR-Cas9 Gene Editing of Human Pluripotent Stem Cells

Affiliations

Trichostatin A for Efficient CRISPR-Cas9 Gene Editing of Human Pluripotent Stem Cells

Kaivalya Molugu et al. CRISPR J. 2023 Oct.

Abstract

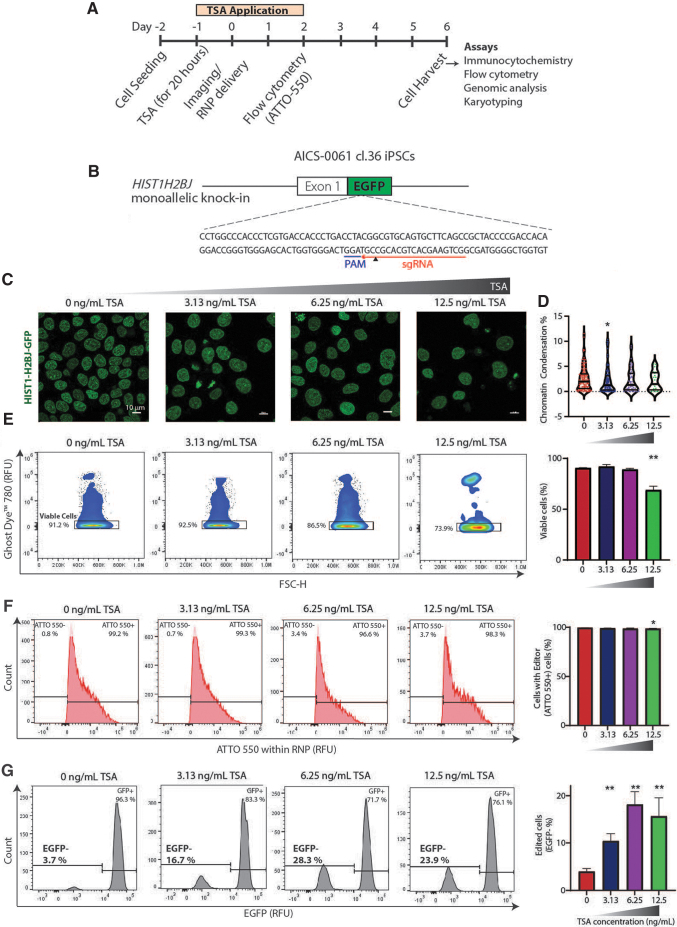
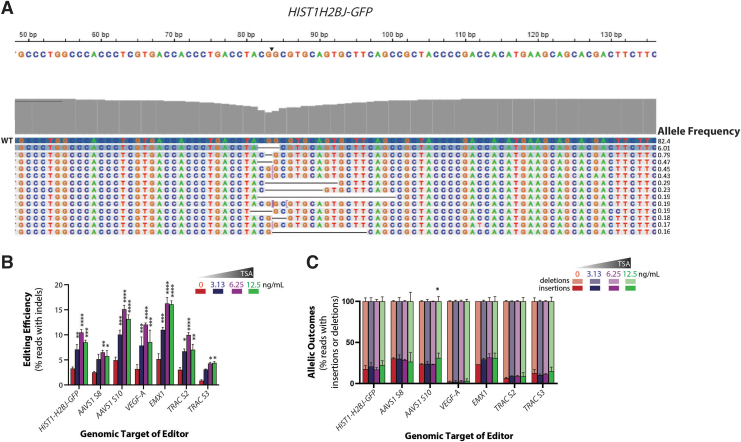
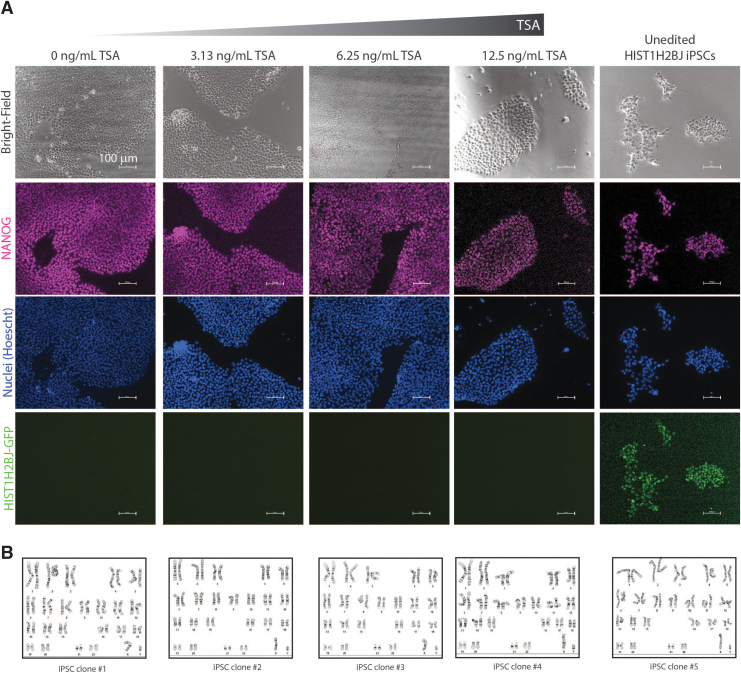
Genome-edited human-induced pluripotent stem cells (iPSCs) have broad applications in disease modeling, drug discovery, and regenerative medicine. Despite the development of clustered regularly interspaced short palindromic repeats (CRISPR)-Cas9 system, the gene editing process is inefficient and can take several weeks to months to generate edited iPSC clones. We developed a strategy to improve the efficiency of the iPSC gene editing process via application of a small-molecule, trichostatin A (TSA), a Class I and II histone deacetylase inhibitor. We observed that TSA decreased global chromatin condensation and further resulted in increased gene-editing efficiency of iPSCs by twofold to fourfold while concurrently ensuring no increased off-target effects. The edited iPSCs could be clonally expanded while maintaining genomic integrity and pluripotency. The rapid generation of therapeutically relevant gene-edited iPSCs could be enabled by these findings.


Conflict of interest statement

K.M. and K.S. have filed a patent application on this work. The remaining authors declare no competing financial interests.

Figures

FIG. 1.
FIG. 1.
TSA increases CRISPR-Cas9-mediated gene editing efficiency of iPSCs at HIST1H2BJ-GFP locus. (A) Schematic showing the TSA-based gene editing strategy and analyses. (B) Schematic of the HIST1H2BJ-GFP locus with gRNA target sequence, PAM sequence, and cut-site (black arrow) labeled. (C) Representative images of HIST1H2BJ-GFP reporter iPSC nuclei after TSA treatment (0, 3.13, 6.25, and 12.5 ng/mL). Bright green spots indicate heterochromatin foci; scale bar: 10 μm. (D) Box plots showing the distribution of chromatin condensation %. Chromatin condensation % decreases with the application of TSA (n = 20 nuclei, 3 technical replicates per condition). (E) Representative density flow cytometry plots showing Ghost Dye™ Red 780 viability dye levels on iPSCs treated with TSA. The quantification bar graph on the right indicates that cell viability (% Ghost Dye – cells/total cells) decreases upon TSA treatment. (F) Histograms showing ATTO 550 expression on day 2 after Cas9 RNP delivery. The quantification bar graph on the right indicates that transfection efficiency (% ATTO 550 + cells/viable cells) does not change significantly upon TSA treatment. (G) Histograms showing GFP expression on day 6 after Cas9 RNP delivery. The quantification bar graph on the right indicates that gene editing efficiency (% GFP – cells/viable cells) increases upon TSA treatment. Data represented in bar graphs are represented as mean ± SEM, n = 6 technical replicates per condition from two independent biological replicates, p-values generated by Mann–Whitney nonparametric t-test for multiple comparisons to 0 ng/mL TSA; ns = p > 0.05, *p < 0.05, **p < 0.01. GFP, Green Fluorescent Protein; gRNA, guide RNA; iPSC, induced pluripotent stem cell; PAM, protospacer adjacent motif; RNP, ribonucleoprotein; SEM, standard error of the mean; TSA, trichostatin A.
FIG. 2.
FIG. 2.
TSA increases on-target gene editing efficiency at several endogenous genes in iPSCs. (A) Representative indel profile for iPSCs edited with mEGFP targeting gRNA, TSA treatment: 6.25 ng/mL. Allele frequencies are indicated on the right. (B) Bar graphs showing increased % editing efficiencies upon TSA treatment at open loci: HIST1H2BJ-GFP, AAVS1 (two sites: S8, S10); and closed loci: EMX1, VEGFA, and TRAC (two sites: S2, S3) loci. (C) Stacked bar graphs showing no significant change in % edited reads with insertions and % edited reads with deletions upon TSA treatment. Data represented in bar graphs are represented as mean ± SEM, n = 3 technical replicates per condition, p-values generated by two-way ANOVA Dunnett's multiple comparison test for multiple comparisons to 0 ng/mL TSA; ns = p > 0.05, *p < 0.05, **p < 0.01, ***p < 0.001, ****p < 0.0001. ANOVA, analysis of variance; mEGFP, monomeric Enhanced Green Fluorescent Protein.
FIG. 3.
FIG. 3.
Off-target analysis of edited iPSCs. (A) Visualization of SpCas9 target and off-target sites detected by CHANGE-seq for the HIST1H2BJ-GFP gRNA. The intended target GFP sequence is shown in the top line. Cleaved sites (off-target) are shown below and are ordered by CHANGE-seq read count, with mismatches to the intended target sequence indicated by colored nucleotides. Insertions are shown in smaller lettering between genomic positions, deletions are shown by (−). Note that output is truncated to the top 12 sites. (B) Manhattan plot of CHANGE-seq-detected off-target sites organized by chromosomal position with bar heights representing CHANGE-seq read count. (C–E) Left: Indel% at (C) HIST1H2BJ-GFP, (D) AAVS1 S10, (E) EMX1 on-target and top off-target sites detected by CHANGE-seq (HIST1H2BJ-GFP and AAVS1) or GUIDE-seq (EMX1), assayed by rhAmpSeq system. While the on-target indel % increases with TSA concentration, the off-target indel % remains the same. Data represented in bar graphs are represented as mean ± SEM, n = 3 technical replicates per condition, p-values generated by two-way ANOVA Dunnett's multiple comparison test for multiple comparisons to 0 ng/mL TSA; ns = p > 0.05, ***p < 0.001, ****p < 0.0001. Right: Normalized on-target edit ratio for each of the top off-target sites at (C) HIST1H2BJ-GFP, (D) AAVS1 S10, (E) EMX1 plotted as a function of TSA concentration. TSA concentration of 6.25 ng/mL yields the highest normalized on-target edit ratio.
FIG. 4.
FIG. 4.
Pluripotency marker and karyotypic analysis of TSA-treated edited iPSC lines. (A) Representative images of edited iPSC clones from various TSA treatments: 0, 3.13, 6.25, and 12.5 ng/mL. Unedited iPSC clones were used as positive control. Cells were stained using Hoechst dye (blue) for nuclei and antibodies against NANOG (Cy5), marker of pluripotency. Scale bar, 100 μm. (B) Karyotypic analysis of edited iPSC lines. Four of the five edited isolated iPSC clones (TSA treatment; 6.25 ng/mL) showed normal karyotype indicating that cell lines with no major chromosome abnormalities can be isolated after TSA-induced gene editing. One clone #5 showed an interstitial duplication in the long (q) arm of chromosome 20 in 5 of the 20 cells examined.

Similar articles

Cited by

References

    1. Ebert AD, Liang P, Wu JC. Induced pluripotent stem cells as a disease modeling and drug screening platform. J Cardiovasc Pharmacol 2012;60(4):4`08–416; doi: 10.1097/FJC.0b013e318247f642. - DOI - PMC - PubMed
    1. Shi Y, Inoue H, Wu JC, et al. . Induced pluripotent stem cell technology: A decade of progress. Nat Rev Drug Discov 2017;16(2):115–130; doi: 10.1038/nrd.2016.245 - DOI - PMC - PubMed
    1. Doudna JA. The promise and challenge of therapeutic genome editing. Nature 2020;578(7794):229–236; doi: 10.1038/s41586-020-1978-5 - DOI - PMC - PubMed
    1. De Masi C, Spitalieri P, Murdocca M, et al. . Application of CRISPR/Cas9 to human-induced pluripotent stem cells: From gene editing to drug discovery. Hum Genomics 2020;14(1):25; doi: 10.1186/s40246-020-00276-2 - DOI - PMC - PubMed
    1. Dashnau JL, Xue Q, Nelson M, et al. . A risk-based approach for cell line development, manufacturing and characterization of genetically engineered, induced pluripotent stem cell–derived allogeneic cell therapies. Cytotherapy 2023;25(1):1–13; doi: 10.1016/j.jcyt.2022.08.001 - DOI - PubMed

Publication types