. 2023 Dec 19;119(16):2623-2637.
doi: 10.1093/cvr/cvad143.

Atrial fibrillation-associated electrical remodelling in human induced pluripotent stem cell-derived atrial cardiomyocytes: a novel pathway for antiarrhythmic therapy development

Affiliations

Atrial fibrillation-associated electrical remodelling in human induced pluripotent stem cell-derived atrial cardiomyocytes: a novel pathway for antiarrhythmic therapy development

Fitzwilliam Seibertz et al. Cardiovasc Res. .

Abstract

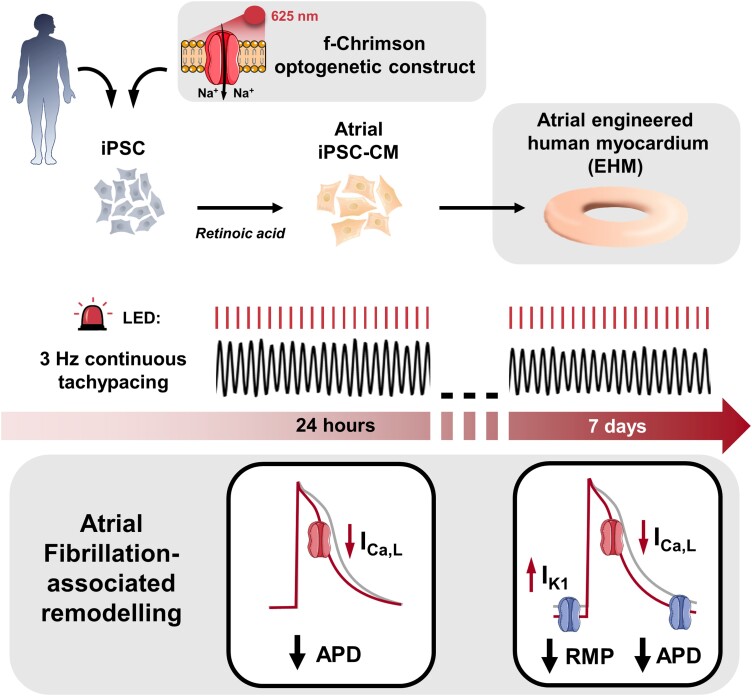
Aims: Atrial fibrillation (AF) is associated with tachycardia-induced cellular electrophysiology alterations which promote AF chronification and treatment resistance. Development of novel antiarrhythmic therapies is hampered by the absence of scalable experimental human models that reflect AF-associated electrical remodelling. Therefore, we aimed to assess if AF-associated remodelling of cellular electrophysiology can be simulated in human atrial-like cardiomyocytes derived from induced pluripotent stem cells in the presence of retinoic acid (iPSC-aCM), and atrial-engineered human myocardium (aEHM) under short term (24 h) and chronic (7 days) tachypacing (TP).

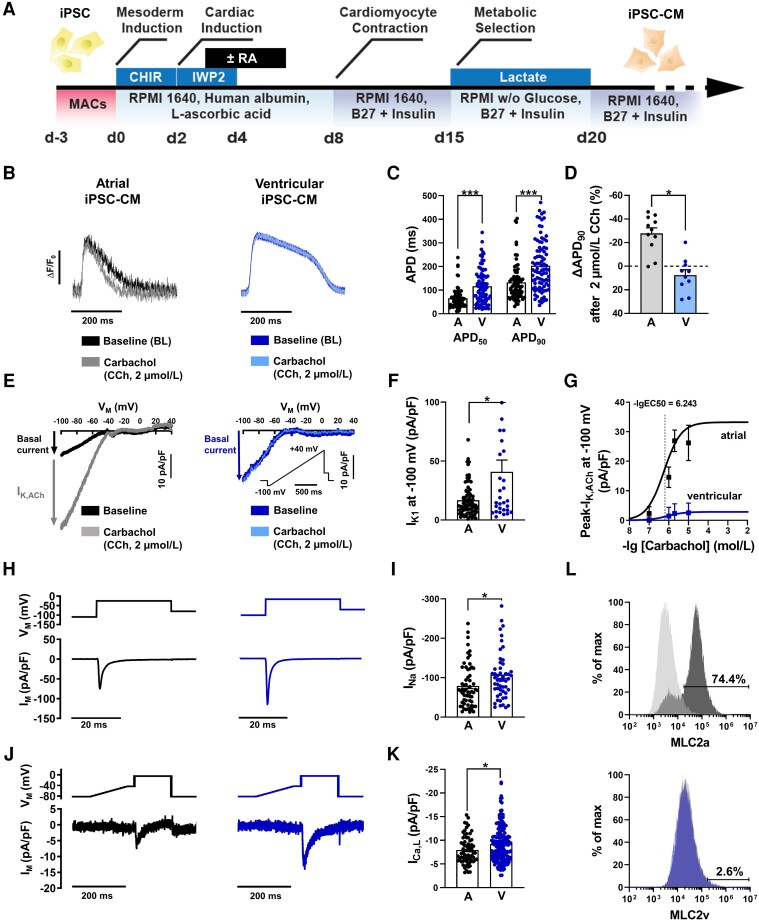
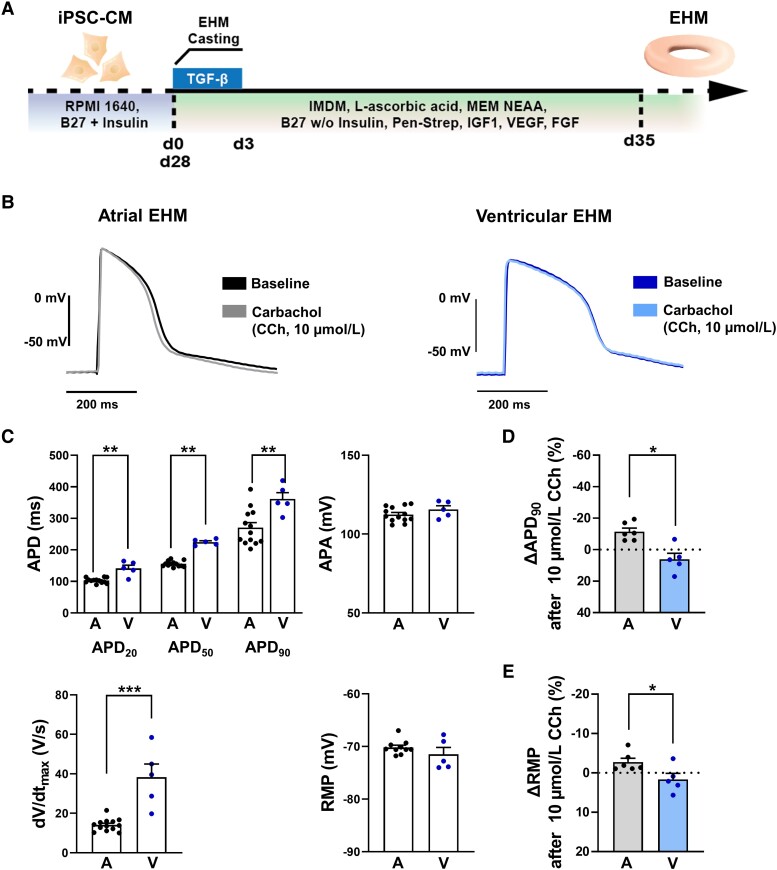
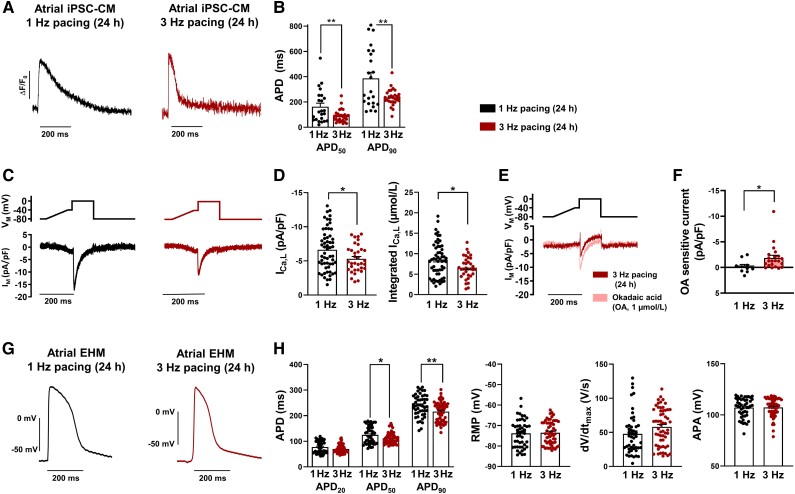
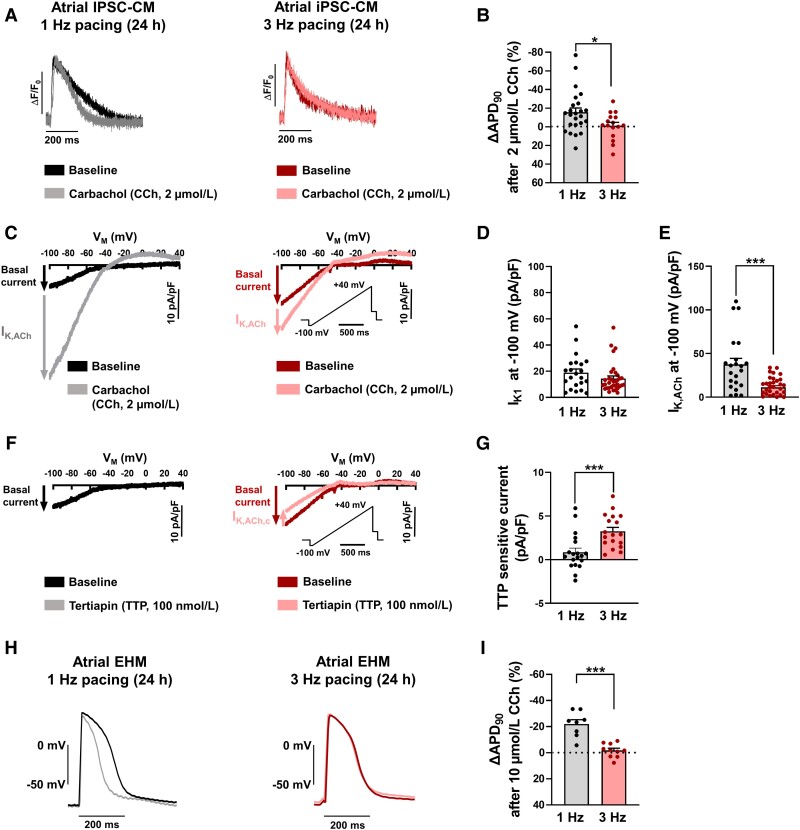
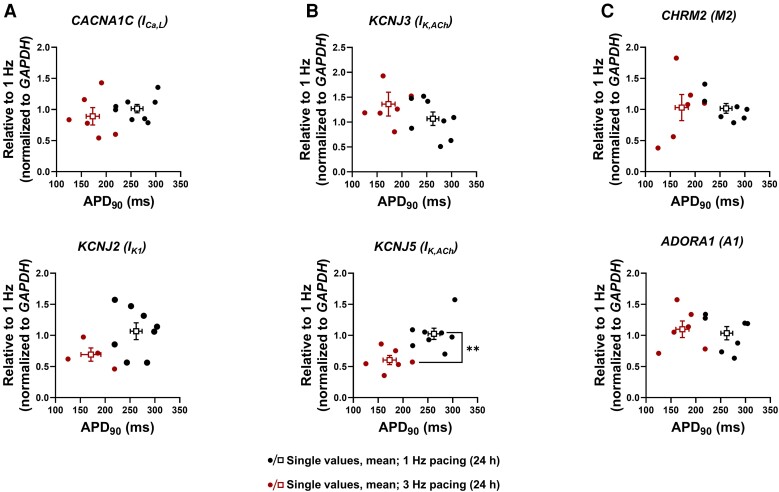
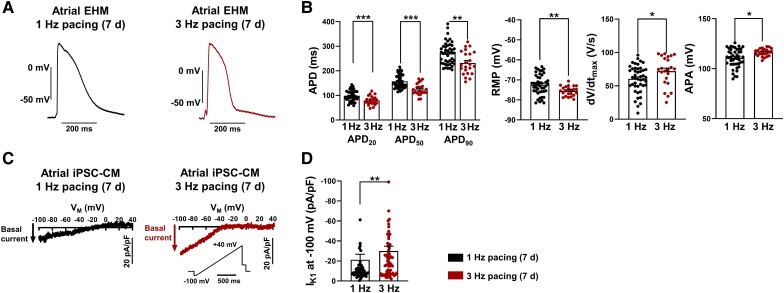
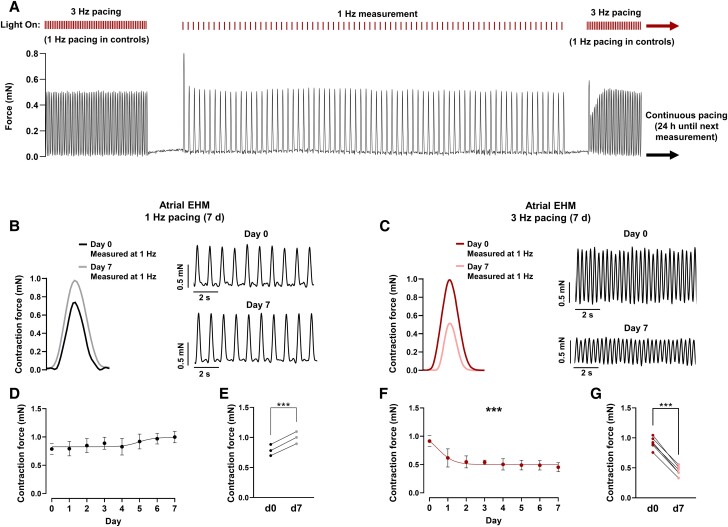
Methods and results: First, 24-h electrical pacing at 3 Hz was used to investigate whether AF-associated remodelling in iPSC-aCM and aEHM would ensue. Compared to controls (24 h, 1 Hz pacing) TP-stimulated iPSC-aCM presented classical hallmarks of AF-associated remodelling: (i) decreased L-type Ca2+ current (ICa,L) and (ii) impaired activation of acetylcholine-activated inward-rectifier K+ current (IK,ACh). This resulted in action potential shortening and an absent response to the M-receptor agonist carbachol in both iPSC-aCM and aEHM subjected to TP. Accordingly, mRNA expression of the channel-subunit Kir3.4 was reduced. Selective IK,ACh blockade with tertiapin reduced basal inward-rectifier K+ current only in iPSC-aCM subjected to TP, thereby unmasking an agonist-independent constitutively active IK,ACh. To allow for long-term TP, we developed iPSC-aCM and aEHM expressing the light-gated ion-channel f-Chrimson. The same hallmarks of AF-associated remodelling were observed after optical-TP. In addition, continuous TP (7 days) led to (i) increased amplitude of inward-rectifier K+ current (IK1), (ii) hyperpolarization of the resting membrane potential, (iii) increased action potential-amplitude and upstroke velocity as well as (iv) reversibly impaired contractile function in aEHM.

Conclusions: Classical hallmarks of AF-associated remodelling were mimicked through TP of iPSC-aCM and aEHM. The use of the ultrafast f-Chrimson depolarizing ion channel allowed us to model the time-dependence of AF-associated remodelling in vitro for the first time. The observation of electrical remodelling with associated reversible contractile dysfunction offers a novel platform for human-centric discovery of antiarrhythmic therapies.

Keywords: Action potential; Atrial fibrillation; Ion channel; Optogenetics; Stem cells.


Conflict of interest statement

Conflict of interest: W.H.Z. is founder and advisor of Repairon GmbH and myriamed GmbH. M.T. is advisor of Repairon GmbH and myriamed GmbH. myriamed GmbH commercializes iPSC-based cell and tissue models for drug discovery. M.Rap. is an employee of Nanion Technologies GmbH. This manuscript was handled by Consulting Editor David Eisner.

Figures

Graphical Abstract
Graphical Abstract
Figure 1
Figure 1
Cellular electrophysiology of atrial (iPSC-aCM) and ventricular (iPSC-vCM) induced pluripotent stem cell-derived cardiomyocytes. (A) Schematic of the iPSC-CM differentiation protocols used in this study. Application of 1 µmol/L retinoic acid (RA) from day 3 (d3) to day 6 induces an atrial specific subtype. (B) Representative optical action potentials (AP) elicited at 1 Hz in intact single iPSC-aCM (A, left) and iPSC-vCM (V, right) before (baseline) and after application of the M-receptor agonist carbachol (CCh, 2 µmol/L). (C) AP duration at 50 and 90% repolarization (APD50, APD90; atrial: n = 74/4, ventricular: n = 89/3). (D) Percentage change of APD90 following CCh application (atrial: n = 11/2, ventricular: n = 10/2). (E) Representative voltage-clamp recordings of inward-rectifier K+ current current in single iPSC-aCM (left) and iPSC-vCM (right) before (baseline, IK1) and after CCh application, revealing the acetylcholine-activated inward-rectifier K+ current (IK,ACh) in iPSC-aCM. (F), IK1 measured at −100 mV (atrial: n = 77/6, ventricular: n = 31/4). (G) Concentration-response curves for CCh-mediated activation of IK,ACh defined as CCh-dependent increase of inward-rectifier-K+-current amplitude at −100 mV in iPSC-aCM (n = 7–77/6) and iPSC-vCM (n = 143/1). (H), Voltage-clamp protocol (0.5 Hz, top) and representative membrane current (IM) trace (bottom) of peak Na+ current (INa) in iPSC-aCM (left) and iPSC-vCM (right). (I) Peak INa (atrial: n = 62/1, ventricular: n = 53/1). (J) Voltage-clamp protocol (0.5 Hz, top) and representative membrane current (IM) trace (bottom) of L-type Ca2+ current (ICa,L) in iPSC-aCM (left) or iPSC-vCM (right). (K) Peak ICa,L (atrial: n = 66/2, ventricular: n = 176/2). (L) Representative flow cytometry analysis of iPSC-aCM staining for the atrial isoform (MLC2a, top) or the ventricular isoform (MLC2v bottom) of myosin light chain. Grey peaks represent the isotype control. Data are mean ± SEM. *P < 0.05, ***P < 0.001 vs. iPSC-aCM using unpaired Student’s t-test. n/N = number of iPSC-CM/differentiation.
Figure 2
Figure 2
Electrophysiology of atrial (aEHM) and ventricular (vEHM) engineered human myocardium. (A) Schematic of the EHM culture procedure used in this study. (B) Representative action potentials (AP) elicited at 1 Hz in aEHM (A, left) and vEHM (V, right) before (baseline) and after application of the M-receptor agonist carbachol (CCh, 10 µmol/L). (C) AP duration at 20, 50, and 90% repolarization (APD20, APD50 and APD90, top left), AP amplitude (APA, top right), upstroke velocity (dV/dtmax, bottom left), and resting membrane potential (RMP, bottom right; atrial: n = 13/3, ventricular: n = 5/2). (D), Percentage change of APD90 following CCh application. (E), Percentage change of RMP following CCh application (atrial: n = 6/2, ventricular: n = 5/2). Data are mean ± SEM. *P < 0.05, **P < 0.01, ***P < 0.001 vs. aEHM using unpaired Student’s t-test or Welch’s t-test (E). n/N = number of recordings/EHM.
Figure 3
Figure 3
Twenty-four hour TP-induced remodelling of cellular electrophysiology in atrial induced pluripotent stem cell-derived cardiomyocytes (iPSC-aCM) and atrial engineered human myocardium (aEHM). (A) Representative optical action potentials (AP) elicited at 1 Hz in intact single iPSC-aCM after 24 h electrical pacing at 1 Hz (left) or 3 Hz (right). (B) AP duration at 50 and 90% repolarization (APD50, APD90, 1 Hz: n = 23/3, 3 Hz: n = 28/3) (C), Voltage-clamp protocol (0.5 Hz, top) and representative membrane current (IM) trace (bottom) of L-type Ca2+ current (ICa,L) in iPSC-aCM after 24 h electrical pacing at 1 Hz (left) or 3 Hz (right). (D), Peak ICa,L (left), integrated ICa,L expressed as estimated cytosolic Ca2+ influx (right; 1 Hz: n = 23/4, 3 Hz: n = 28/4). (E), Voltage-clamp protocol (0.5 Hz, top) and representative membrane current (IM) trace (bottom) of ICa, L in 24 h 3 Hz paced iPSC-aCM before and after application of type 1 and type 2A phosphatase inhibitor okadaic acid (OA, 1 µmol/L). (F), Change in peak ICa,L following OA application (1 Hz: n = 11/1, 3 Hz: n = 22/1). (G) Representative AP were elicited at 1 Hz in aEHM after 24 h optical pacing at 1 Hz (left) or 3 Hz (right). (H) APD at 20, 50, and 90% repolarization (APD20, APD50 and APD90, left), resting membrane potential (RMP,middle left), upstroke velocity (dV/dtmax, middle right), AP amplitude (APA, right; 1 Hz: n = 49/14, 3 Hz: n = 61/15). Data are mean ± SEM. *P < 0.05, **P < 0.01 vs. 1 Hz using unpaired Student’s t-test or Welch’s t-test (F). n/N = number of iPSC-CM/differentiation or number of recordings/EHM.
Figure 4
Figure 4
Twenty-four hour TP-induced remodelling of inward-rectifier K+ currents in atrial induced pluripotent stem cell-derived cardiomyocytes (iPSC-aCM) and atrial engineered human myocardium (aEHM). (A), Representative optical action potentials (AP) elicited at 1 Hz in intact single iPSC-aCM after 24 h electrical pacing at 1 Hz (left) or 3 Hz (right) before (baseline) and after application of the M-receptor agonist carbachol (CCh, 2 µmol/L). (B), Percentage change of AP duration at 90% repolarization (APD90) following CCh application (1 Hz: 26/4, 3 Hz: n = 16/3). (C), Representative voltage-clamp recordings of inward-rectifier K+ current in single iPSC-aCM after 24 h electrical pacing at 1 Hz (left) or 3 Hz (right) before (baseline, IK1) and after CCh application, revealing the acetylcholine-activated inward-rectifier K+ current (IK,ACh). (D), Peak IK1 measured at −100 mV. E, Peak IK,ACh measured at −100 mV (D, E: 1 Hz: n = 22/2, 3 Hz: n = 34/2). (F), Representative voltage-clamp recordings of basal inward-rectifier K+ current in single iPSC-aCM after 24 h electrical pacing at 1 Hz (left) or 3 Hz (right) before (baseline) and after application of selective IK,ACh blocker tertiapin (TTP, 100 nmol/L). (G), Change in basal current at −100 mV following TTP application, defined as agonist independent constitutive IK,ACh (IK,ACh,c; 1 Hz: n = 19/2, 3 Hz n = 18/2). (H), Representative AP elicited at 1 Hz in aEHM after 24 h optical pacing at 1 Hz (left) or 3 Hz (right) before and after CCh application (10 µmol/L). (I), Percentage change of APD90 following CCh application (1 Hz: n = 8/5, 3 Hz: n = 10/5). Data are mean ± SEM. *P < 0.05, ***P < 0.001 vs. 1 Hz using paired Student’s t-test. n/N = number of iPSC-CM/differentiation or number of recordings/EHM.
Figure 5
Figure 5
Gene expression of ionic channels and receptors in atrial engineered human myocardium (aEHM) subjected to 24-h optical TP. (A), mRNA levels of ion channels CACNA1C (ICa,L, top) and KCNJ2 (IK1, bottom). (B), mRNA levels of IK,ACh ion channel subunits KCNJ3 (top) and KCNJ5 (bottom). (C), mRNA levels of receptors CHRM2 (M2 receptor, top) and ADORA1 (A1 receptor, bottom). All values are plotted as single values against the corresponding action potential duration at 90% repolarization (APD90). Data are mean ± SEM. **P < 0.01 vs. 1 Hz using the Mann–Whitney U test.
Figure 6
Figure 6
Prolonged (7-day) TP-induced remodelling of cellular electrophysiology in atrial engineered human myocardium (aEHM) and atrial induced pluripotent stem cell-derived cardiomyocytes (iPSC-aCM). (A), Representative action potentials (AP) elicited at 1 Hz in aEHM after 7 days of optical pacing at 1 Hz (left) or 3 Hz (right). (B), AP duration at 20, 50, and 90% repolarization (APD20, APD50 and APD90, left), resting membrane potential (RMP, middle left), upstroke velocity (dV/dtmax, middle right), AP amplitude (APA, right; 1 Hz: n = 45/8, 3 Hz: n = 23/9). (C) Representative voltage-clamp recordings of basal inward-rectifier K+ current (IK1) current in iPSC-aCM after 7 day of optical pacing at 1 Hz (left) or 3 Hz (right). (D) Peak IK1 measured at −100 mV (1 Hz: n = 49/1, 3 Hz: n = 64/1). Data are mean ± SEM. *P < 0.05, **P < 0.01, ***P < 0.001 vs. 1 Hz using paired Student’s t-test. n/N = number of iPSC-CM/differentiation or number of recordings/EHM.
Figure 7
Figure 7
Prolonged (7-day) TP-induced contractile dysfunction in atrial human engineered myocardium (aEHM). (A) Representative partial trace of aEHM contraction as it is continuously optically stimulated at 3 Hz for 7 days. Contractile measurements were taken every 24 h at a window of 1 Hz pacing, of which a representative example is shown. (B) Representative average contractile signals from aEHM during 7 day 1 Hz optical pacing on day 0 and day 7 (left), representative partial traces of aEHM contraction on day 0 (top right) and day 7 (bottom right) of 1 Hz pacing. (C) Representative average contractile signals from aEHM tissue during 7 day 3 Hz optical pacing on day 0 and day 7 (left), representative partial traces of aEHM contraction on day 0 (top right) and day 7 (bottom right) of 3 Hz pacing. (D) Time course of contractile function of aEHM optically paced for 7 d at 1 Hz (n = 3). (E) Change in contractile force after 7 day of optical pacing at 1 Hz. Single point data extracted from (D). (F) Time course of contractile function of aEHM optically paced for 7 day at 3 Hz (n = 6). (G) Change in contractile force after 7 day of optical pacing at 3 Hz. Single point data extracted from (F). Data are mean ± SEM. ***P < 0.001 vs. 1 Hz using paired Student’s t-test (E, G) or an extra sum of squares F test to compare fitted sigmoidal curves (D, F). n = number of EHM.

Similar articles

Cited by

References

    1. Nattel S, Heijman J, Zhou L, Dobrev D. Molecular basis of atrial fibrillation pathophysiology and therapy: a translational perspective. Circ Res 2020;127:51–72. - PMC - PubMed
    1. Heijman J, Voigt N, Nattel S, Dobrev D. Cellular and molecular electrophysiology of atrial fibrillation initiation, maintenance, and progression. Circ Res 2014;114:1483–1499. - PubMed
    1. Voigt N, Li N, Wang Q, Wang W, Trafford AW, Abu-Taha I, Sun Q, Wieland T, Ravens U, Nattel S, Wehrens XHT, Dobrev D. Enhanced sarcoplasmic reticulum Ca2+ leak and increased Na+-Ca2+ exchanger function underlie delayed afterdepolarizations in patients with chronic atrial fibrillation. Circulation 2012;125:2059–2070. - PMC - PubMed
    1. Van Wagoner DR, Pond AL, Lamorgese M, Rossie SS, McCarthy PM, Nerbonne JM. Atrial L-type Ca2+ currents and human atrial fibrillation. Circ Res 1999;85:428–436. - PubMed
    1. Christ T, Boknik P, Wöhrl S, Wettwer E, Graf EM, Bosch RF, Knaut M, Schmitz W, Ravens U, Dobrev D. L-type ca2+ current downregulation in chronic human atrial fibrillation is associated with increased activity of protein phosphatases. Circulation 2004;110:2651–2657. - PubMed

Publication types