. 2023 Nov 1;34(11):1823-1842.
doi: 10.1681/ASN.0000000000000212. Epub 2023 Sep 6.

Podocyte Injury in Diabetic Kidney Disease in Mouse Models Involves TRPC6-mediated Calpain Activation Impairing Autophagy

Affiliations

Podocyte Injury in Diabetic Kidney Disease in Mouse Models Involves TRPC6-mediated Calpain Activation Impairing Autophagy

Yann Salemkour et al. J Am Soc Nephrol. .

Abstract

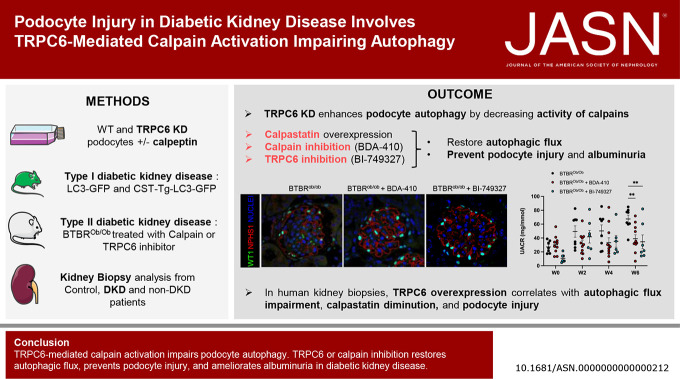
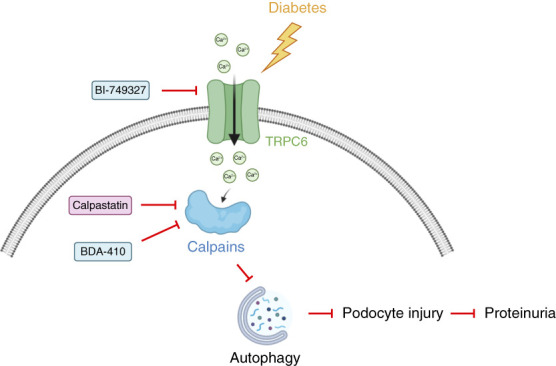
Significance statement: Autophagy protects podocytes from injury in diabetic kidney disease (DKD). Restoring glomerular autophagy is a promising approach to limit DKD. This study demonstrates a novel regulatory mechanism of autophagy that blocks this critical protection of the glomerular filtration barrier. We demonstrated that TRPC6 induced in podocytes in mouse models of diabetes mediates calpain activation, thereby impairing podocyte autophagy, causing injury and accelerating DKD. Furthermore, this study provides proof of principle for druggable targets for DKD because restoration of podocyte autophagy by calpain inhibitors effectively limits glomerular destruction.

Background: Diabetic kidney disease is associated with impaired podocyte autophagy and subsequent podocyte injury. The regulation of podocyte autophagy is unique because it minimally uses the mTOR and AMPK pathways. Thus, the molecular mechanisms underlying the impaired autophagy in podocytes in diabetic kidney disease remain largely elusive.

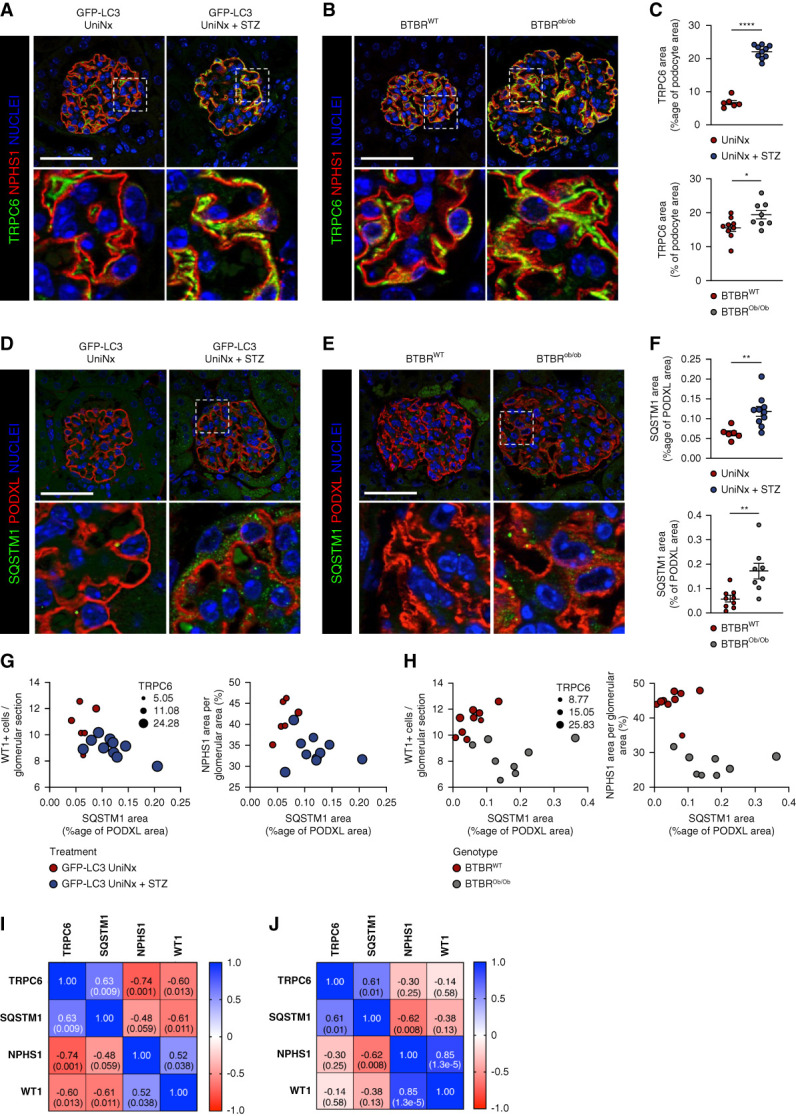
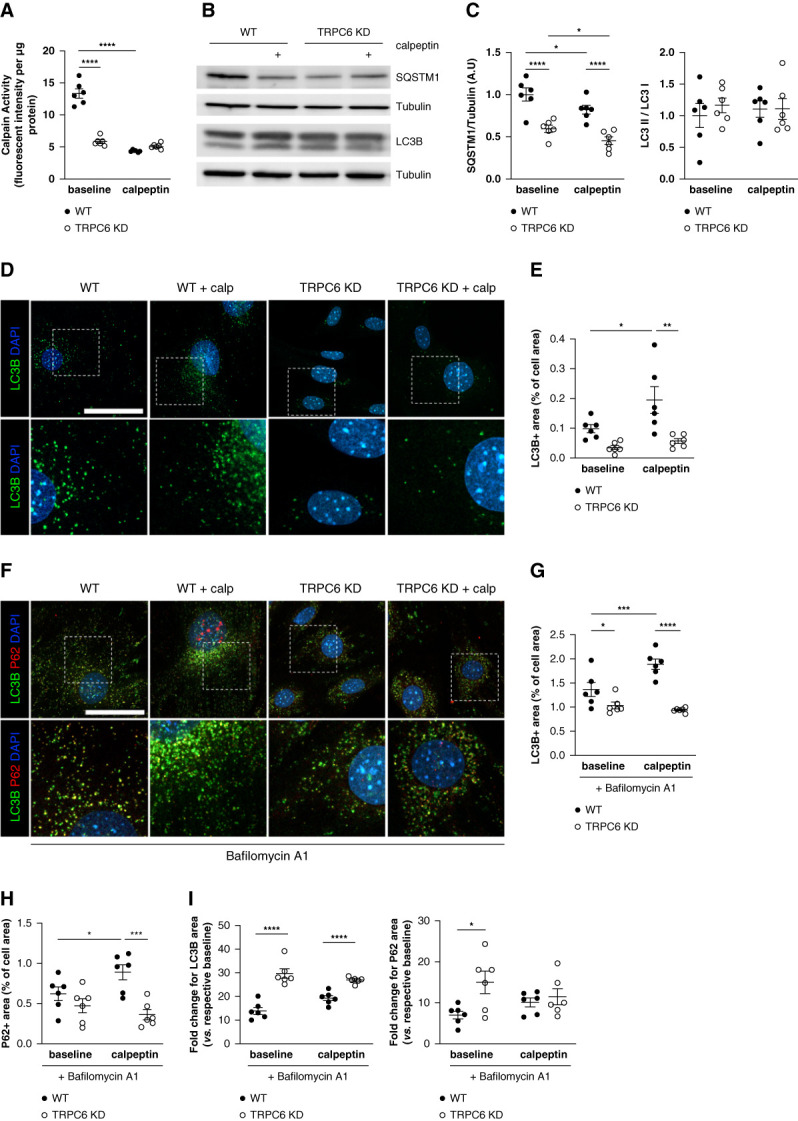
Methods: This study investigated how the calcium channel TRPC6 and the cysteine protease calpains deleteriously affect podocyte autophagy in diabetic kidney disease in mice. We demonstrated that TRPC6 knockdown in podocytes increased the autophagic flux because of decreased cysteine protease calpain activity. Diabetic kidney disease was induced in vivo using streptozotocin with unilateral nephrectomy and the BTBR ob/ob mouse models.

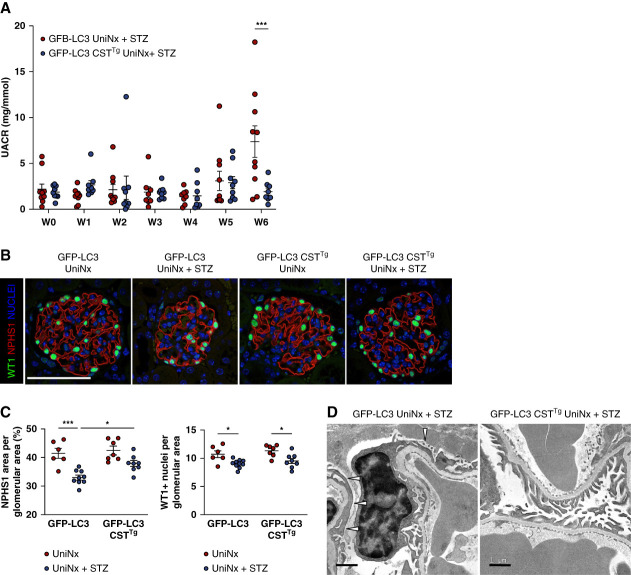
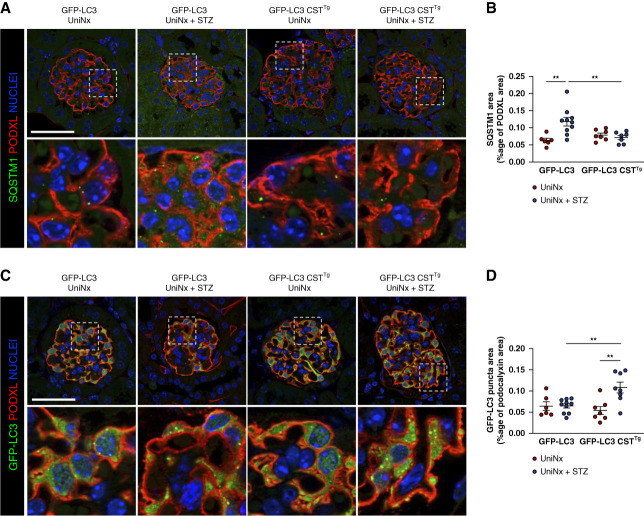
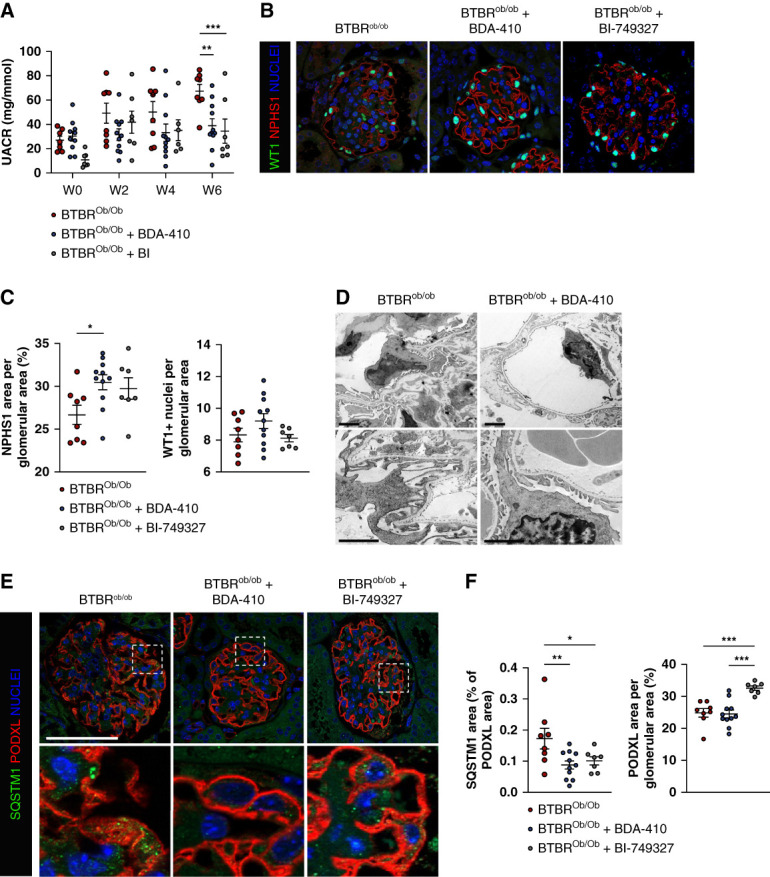
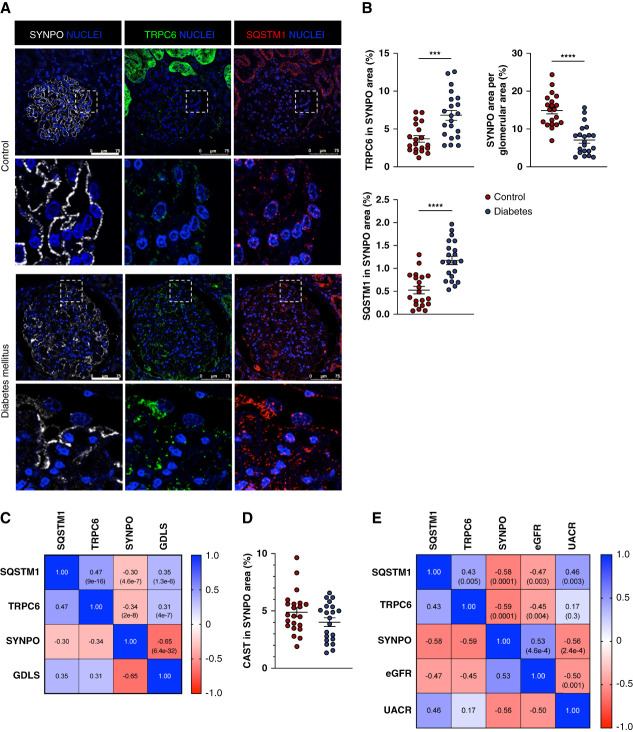
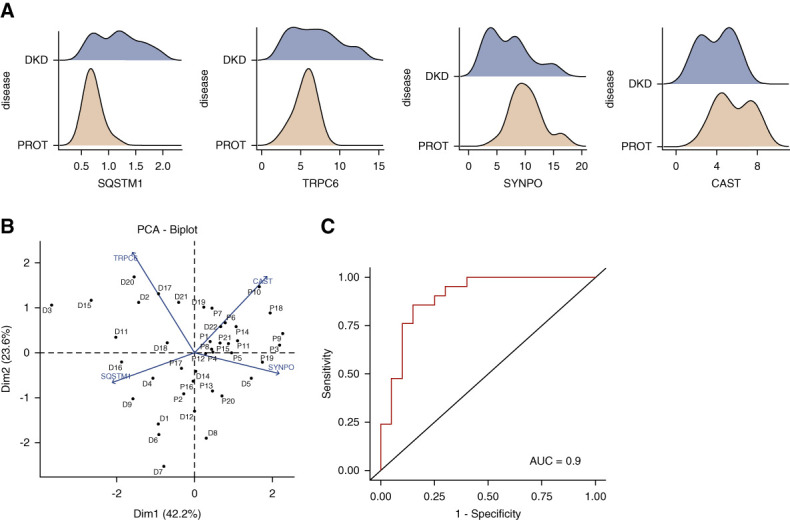
Results: Diabetes increased TRPC6 expression in podocytes in vivo with decreased podocyte autophagic flux. Transgenic overexpression of the endogenous calpain inhibitor calpastatin, as well as pharmacologic inhibition of calpain activity, normalized podocyte autophagic flux, reduced nephrin loss, and prevented the development of albuminuria in diabetic mice. In kidney biopsies from patients with diabetes, we further confirmed that TRPC6 overexpression in podocytes correlates with decreased calpastatin expression, autophagy blockade, and podocyte injury.

Conclusions: Overall, we discovered a new mechanism that connects TRPC6 and calpain activity to impaired podocyte autophagy, increased podocyte injury, and development of proteinuria in the context of diabetic kidney disease. Therefore, targeting TRPC6 and/or calpain to restore podocyte autophagy might be a promising therapeutic strategy for diabetic kidney disease.

Trial registration: ClinicalTrials.gov NCT05213624.


Conflict of interest statement

A. Karras reports Consultancy: Alnylam, GSK, Novartis, Otsuka, Vifor; Honoraria: ASTRAZENECA, Bohringer-Ingelheim, GSK, NOVARTIS, OTSUKA, PFIZER, VIFOR; Advisory or Leadership Role: Novartis, Otsuka, Vifor; and Speakers Bureau: AstraZeneca, Boehringer-Ingelheim, Otsuka, Pfizer, Vifor. E. Letavernier reports Consultancy: Biocodez, IKI, Withings; Research Funding: Advicenne, Coloplast; Honoraria: Biocodex, IKI, Withings; and Patents or Royalties: Insert transfert. T. Nijenhuis reports Research Funding: Dutch Kidney Foundation, Radboudumc; and Advisory or Leadership Role: Scientific board Dutch Society for Nephrology, Scientific advisory board Dutch Kidney Foundation, Speaker and chair Tubulopathies Expert Working Group and Executive Committee member, European Rare Kidney Disorders Network (ERKNet), and Board member ERA Working Group Genes & Kidney. M. Rabant reports Honoraria: Pfizer. R. Saito reports Employer: Mitsubishi Tanabe Pharma Corporation; and Other Interests or Relationships: IQ consortium; Life intelligence consortium (LINC). D.C. 't Hart reports Employer: Genome Diagnostics; Radboud university medical center. P.-L. Tharaux reports Consultancy: Alentis Therapeutics; Research Funding: Alentis Therapeutics; Honoraria: Travere Therapeutics; and Advisory or Leadership Role: French National Institute for Medical Research (INSERM), French Society of Cardiology (SFC), French Society of Hypertension (SFHTA), Associate Editor: Kidney International; Advisory Board Member: Nature Review Nephrology. J. Van der Vlag reports Other Interests or Relationships: Secretary Science committee Dutch federation of Nephrology. D. Yildiz reports Other Interests or Relationships: Nierstichting (The Dtuch Kidney Foundation). All remaining authors have nothing to disclose.

Figures

None
Graphical abstract
Figure 1
Figure 1
Increased TRPC6 expression and podocyte autophagy flux blockade in diabetic kidney disease. (A and B) Representative immunofluorescence images of TRPC6 (green) and NPHS1 (red) expression in the glomerulus from GFP-LC3 UniNx mice and GFP-LC3 UniNx+STZ mice (A) and from BTBRWT and BTBROb/Ob mice at 12 weeks of age (B). Nuclei are stained in blue with Hoechst. Scale bar: 50 μm. (C) Quantification of the TRPC6-positive area within the NPHS1 area in type I and type II diabetes models showing increased TRPC6 expression in DKD. n=6 GFP-LC3 UniNx, n=10 GFP-LC3 UniNx+STZ, n=9 BTBRWT, n=8 BTBROb/Ob mice. Values are presented as individual plots and mean±SEM. Unpaired t test: ****P < 0.0001 for GFP-LC3 UniNx versus GFP-LC3 UniNx+STZ and *P = 0.047 for BTBRWT versus BTBROb/Ob. (D and E) Representative immunofluorescence images of SQSTM1 (green) and podocalyxin/PODXL (red) expression in the glomerulus from GFP-LC3 UniNx mice and GFP-LC3 Unix+STZ mice (D) and from BTBR WT and BTBROb/Ob mice at 12 weeks of age (E). Nuclei are stained in blue with Hoechst. Scale bar: 50 μm. (F) Quantification of the SQSTM1 area within the PODXL area in type I and type II diabetes models showing increased SQSTM1 expression in DKD. n=6 GFP-LC3 UniNx, n=10 GFP-LC3 UniNx+STZ, n=9 BTBRWT, n=8 BTBROb/Ob mice. Values are presented as individual plots and mean±SEM. Unpaired t test: **P = 0.006 for GFP-LC3 UniNx versus GFP-LC3 UniNx+STZ and **P = 0.009 for BTBRWT versus BTBROb/Ob. (G–H) Multivariate representation of glomerular SQSTM1 area, NPHS1 area, WT1+ cells, and TRPC6 area in GFP-LC3 UniNx and GFP-LC3 UniNx+STZ mice (G) and in BTBR WT and BTBROb/Ob mice at 12 weeks of age (H). (I and J) Correlation matrix of the glomerular areas of SQSTM1, TRPC6, and NPHS1 in GFP-LC3 UniNx and GFP-LC3 UniNx+STZ mice (I) and in BTBR WT and BTBROb/Ob mice at 12 weeks of age (J). Numbers in squares represent Pearson r (P value). *P < 0.05, **P < 0.01, and ****P < 0.0001. Podocyte dedifferentiation and loss in mouse models of DKD are closely associated with the raises in podocyte TRPC6 and SQSTM1 expressions. Podocyte accumulation of SQSTM1 also correlates with podocyte TRPC6 raise in DKD models.
Figure 2
Figure 2
Calpain inhibition and TRPC6 KD enhance autophagic flux in vitro through decreased calpain activation. (A) Calpain activity measured in WT and TRPC6 KD MPC-5 podocytes in the absence or presence of the calpain inhibitor calpeptin (48 hours at 1 μM) normalized to protein content per sample. Two-way analysis of variance: treatment, ****P < 0.0001; phenotype, ****P < 0.0001. Tukey multiple comparison test: ****P < 0.0001 for baseline WT versus baseline TRPC6 KD, ****P < 0.0001 for baseline WT versus calpeptin WT. TRPC6 KD podocytes exhibit lower calpain activity than WT podocytes, within a similar range to podocytes treated with a calpain inhibitor. (B–C) Western blot analysis of the expression of SQSTM1/P62 and LC3B in MPC-5 WT and TRPC6 KD podocytes in the absence or presence of calpeptin (1 μM) for 48 hours and associated quantification. TRPC6 KD cells and calpeptin-treated cells have less SQSTM1/P62 abundance than WT podocytes, suggesting increased autophagy flux in these cells. Representative of n=6 replicates per condition. Protein expression was normalized to the tubulin level. Two-way analysis of variance for SQSTM1: treatment, **P = 0.008; phenotype, ****P < 0.0001. Tukey multiple comparison test: ****P < 0.0001 for baseline WT versus baseline TRPC6 KD, ****P < 0.0001 for calpeptin WT versus calpeptin TRPC6 KD, *P = 0.038 for baseline WT versus calpeptin WT, *P = 0.038 for baseline TRPC6 KD versus calpeptin TRPC6 KD. Two-way analysis of variance for LC3 II/LC3 I: treatment, P = 0.89; phenotype, P = 0.59. (D–E) Representative immunofluorescence images of LC3B (green) in WT and TRPC6 KD MPC-5 podocytes treated or not with calpeptin for 48 hours and associated quantification. TRPC6 KD and calpeptin-treated cells have a lower number of LC3+ dots per cell. Nuclei were stained with Hoechst (blue). Scale bar: 50 μm. Images are representative of n=6 replicates per condition. Two-way analysis of variance: treatment, *P = 0.02; phenotype, ***P = 0.0005. Tukey multiple comparison test: P = 0.28 for baseline WT versus baseline TRPC6 KD, **P = 0.003 for calpeptin WT versus calpeptin TRPC6 KD, *P = 0.047 for baseline WT versus calpeptin WT, P = 0.62 for baseline TRPC6 KD versus calpeptin TRPC6 KD. (F–H) LC3B (green) and SQSTM1 (red) immunofluorescences in WT and TRPC6 KD MPC-5 podocytes treated or not with calpeptin for 48 hours and associated quantification. Cells were treated with bafilomycin A1 for 4 hours to block lysosomal acidification and autophagosome–lysosome fusion. Nuclei were stained with Hoechst (blue). Scale bar: 50 μm. Images are representative of n=6 replicates per condition. Two-way analysis of variance for LC3B: treatment: *P = 0.0378; phenotype: ****P < 0.0001. Tukey; interaction: **P = 0.004 multiple comparison test: *P = 0.03 for baseline WT versus baseline TRPC6 KD, ****P < 0.0001 for calpeptin WT versus calpeptin TRPC6 KD, ***P = 0.001 for baseline WT versus calpeptin WT, P = 0.49 for baseline TRPC6 KD versus calpeptin TRPC6 KD. Two-way analysis of variance for SQSTM1: treatment: P = 0.35; phenotype: ***P < 0.0006; interaction: *P = 0.03. Tukey multiple comparison test: P = 0.22 for baseline WT versus baseline TRPC6 KD, ***P = 0.0002 for calpeptin WT versus calpeptin TRPC6 KD, *P = 0.03 for baseline WT versus calpeptin WT, P = 0.36 for baseline TRPC6 KD versus calpeptin TRPC6 KD. Calpeptin treatment induces SQSTM1+ and LC3+ dot accumulation in WT podocytes, showing that calpain activation inhibition increases the autophagy flux in podocytes. (I) Fold change expression for LC3B and SQSTM1 in bafilomycin A1 condition compared with non–bafilomycin A1 condition. Multiple unpaired t test Holm-Sidak method. For LC3B: WT bafilomycin A1 versus TRPC6 KD bafilomycin A1 ****P < 0.0001; WT bafilomycin A1 calpeptin versus TRPC6 KD bafilomycin A1 calpeptin ****P < 0.0001. For SQSTM1: WT bafilomycin A1 versus TRPC6 KD bafilomycin A1 *P = 0.02; WT bafilomycin A1 calpeptin versus TRPC6 KD bafilomycin A1 calpeptin P = 0.55. Whereas TRPC6 KD cells showed less LC3+ dots at baseline, bafilomycin A1 treatment unmask the higher autophagy flux in these cells with a higher fold change in LC3+ dots and SQSTM1+ dots number when compared with WT podocytes.
Figure 3
Figure 3
Glomerular filtration function and glomerular injury in diabetic mice with calpastatin overexpression. (A) Evolution of the urinary albumin-to-creatinine ratio (UACR) in GFP-LC3 UniNx+STZ and GFP-LC3 CSTTg UniNx+STZ mice. Values are presented as individual plots and mean±SEM. Two-way analysis of variance: Weeks, P = 0.003; Genotype, P = 0.13. Tukey multiple comparison test: ***P = 0.0004 for GFP-LC3 UniNx+STZ versus GFP-LC3 CSTTg UniNx+STZ at week 6. Calpastatin overexpression partially prevents diabetes-induced microalbuminuria. (B) Representative immunofluorescence of WT1 (Green) and NPHS1 (Red) expression in glomeruli from GFP-LC3 UniNx and GFP-LC3 CSTTg UniNx mice 6 weeks after being injected or not with STZ. Nuclei are stained in blue with Hoechst. Scale bar: 50 μm (C) Quantification of NPHS1 area and WT1+ nuclei per glomerular area from GFP-LC3 UniNx+STZ and GFP-LC3 CSTTg UniNx+STZ compared with control UniNx mice. n=6 GFP-LC3 UniNx, n=9 GFP-LC3 UniNx+STZ, n=7 GFP-LC3 CSTTg UniNx, n=8 GFP-LC3 UniNx+STZ mice. Values are presented as individual plots and mean±SEM. Two-way analysis of variance for NPHS1: genotype, *P = 0.02; treatment, ****P < 0.0001. Tukey multiple comparison test: ***P = 0.0002 for GFP-LC3 UniNx versus GFP-LC3 UniNx+STZ, *P = 0.03 for GFP-LC3 UniNx+STZ versus GFP-LC3 CSTTg UniNx+STZ. Two-way analysis of variance for WT1+: genotype, P = 0.20; treatment, ***P = 0.0002. Tukey multiple comparisons test: *P = 0.03 for GFP-LC3 UniNx versus GFP-LC3 UniNx+STZ and *P = 0.02 for GFP-LC3 CSTTg UniNx versus GFP-LC3 CSTTg UniNx+STZ. (D) Transmission electron microscopy images of the podocyte ultrastructure in GFP-LC3 UniNx+STZ and GFP-LC3 CSTTg UniNx+STZ mice. Scale bar: 1 μm. Calpastatin overexpression partially protects podocytes from diabetes-induced podocyte dedifferentiation.
Figure 4
Figure 4
Calpastatin overexpression restores glomerular autophagic flux in the type I diabetes model. (A) Representative immunofluorescence of SQSTM1 (green) and PODXL (red) in the glomerulus from GFP-LC3 UniNx and GFP-LC3 CSTTg UniNx mice 6 weeks after being injected or not with STZ. Nuclei are stained in blue with Hoechst. Scale bar: 50 μm (B) Quantification of the SQSTM1 area in the PODXL area from GFP-LC3 UniNx and GFP-LC3 CSTTg UniNx mice 6 weeks after being injected or not with STZ. For ethical reasons, we did not duplicate GFP-LC3 UniNx and GFP-LC3 CSTTg uniNx groups, and quantifications of these groups are already presented in Figure 1H and Supplemental Figure 1B. n=7 GFP-LC3 UniNx, n=10 GFP-LC3 UniNx+STZ, n=7 GFP-LC3 CSTTg uniNx, n=8 GFP-LC3 CSTTg UniNx+STZ mice. Two-way analysis of variance: genotype, P = 0.13; treatment, *P = 0.0223. Tukey multiple comparison test: **P = 0.002 for GFP-LC3 UniNx versus GFP-LC3 UniNx+STZ and **P = 0.007 for GFP-LC3 UniNx versus GFP-LC3 CSTTg UniNx+STZ. SQSTM1 accumulates in WT diabetic mice but not in mice with calpastatin overexpression. (C) Representative immunofluorescence of GFP-LC3 (green) and PODXL (red) in glomeruli from GFP-LC3 UniNx and GFP-LC3 CSTTg UniNx mice 6 weeks after being injected or not with STZ. Nuclei are stained in blue with Hoechst. (D) Quantification of the GFP-LC3 punctum area in the PODXL area from GFP-LC3 UniNx and GFP-LC3 CSTTg UniNx mice 6 weeks after being injected or not with STZ. n=6 GFP-LC3 UniNx, n=10 GFP-LC3 UniNx+STZ, n=7 GFP-LC3 CSTTg uniNx, n=8 GFP-LC3 CSTTg UniNx+STZ mice. Two-way analysis of variance: genotype, P = 0.09; treatment,**P = 0.008. Tukey multiple comparison test: **P = 0.02 GFP-LC3 UniNx+STZ versus GFP-LC3 CSTTg UniNx+STZ and **P = 0.02 for GFP-LC3 CSTTg UniNx versus GFP-LC3 CSTTg UniNx+STZ. We observe an increased number of LC3+ dots in podocytes from diabetic mice with calpastatin overexpression when compared with WT diabetic mice.
Figure 5
Figure 5
Pharmacologic calpain-1 and TRPC6 inhibition restores glomerular autophagic flux and preserve the glomerular structure in the type II diabetes model. (A) Evolution of the albumin-to-creatinine ratio (UACR) in BTBRob/ob mice treated or not with BDA-410 or BI-749327 for 6 weeks. Values are presented as individual plots and mean±SEM. Two-way analysis of variance: weeks, P = 0.001; treatment, P = 0.0007. Fisher LSD multiple comparison test: P = 0.001 for BTBRob/ob and BTBRob/ob+BDA-410 mice at week 6, P = 0.0006 for BTBRob/ob and BTBRob/ob+BI-749327 mice at week 6. Pharmacologic calpain-1 and TRPC6 inhibition with BDA-410 and BI-749327 partially protects mice from diabetes-induced microalbuminuria. (B) Representative immunofluorescence of WT1 (green) and NPHS1 (red) expression in glomeruli from BTBRob/ob mice treated or not with BDA-410 or BI-749327 for 6 weeks. Nuclei are stained in blue with Hoechst. Scale bar: 50 μm. (C) Quantification of the NPHS1 area and the WT1+ nuclei per glomerular area. n=8 BTBRob/ob, n=11 BTBRob/ob+BDA-410, n=7 BTBRob/ob+BI-749327. Values are presented as individual plots and mean±SEM. WT1: one-way analysis of variance, P = 0.17; Fisher LSD test: P = 0.15 for BTBRob/ob versus BTBRob/ob+BDA-410 and P = 0.77 for BTBRob/ob versus BTBRob/ob+BI-749327. NPHS1: one-way analysis of variance, *P = 0.039; Fisher LSD test: *P = 0.013 for BTBRob/ob versus BTBRob/ob+BDA-410 and P = 0.066 for BTBRob/ob versus BTBRob/ob BI-749327. (D) Transmission electron microscopy images of the podocyte ultrastructure in BTBRob/ob and BTBRob/ob+BDA-410 mice. Scale bar: 2 μm. BDA-410 protects podocytes from diabetes-induced dedifferentiation. (E) Representative immunofluorescence of SQSTM1 (green) and PODXL (red) in the glomerulus from BTBRob/ob mice treated or not with BDA-410 or BI-749327 for 6 weeks. Nuclei are stained in blue with Hoechst. Scale bar: 50 μm. (F) Quantification of the PODXL area and SQSTM1 area in the PODXL area from BTBRob/ob mice treated or not with BDA-410 or BI-749327 for 6 weeks. n=8 BTBRob/ob, n=11 BTBRob/ob+BDA-410, n=7 BTBRob/ob+BI-749327. Values are presented as individual plots and mean±SEM. SQSTM1: one-way analysis of variance, P = 0.018; Fisher LSD test: **P = 0.006 for BTBRob/ob versus BTBRob/ob+BDA-410 and *P = 0.03 for BTBRob/ob versus BTBRob/ob+BI-749327. PODXL: one-way analysis of variance, ***P = 0.0001; Fisher's LSD Test: P = 0.83 for BTBRob/ob versus BTBRob/ob+BDA-410 and ***P = 0.0003 ofr BTBRob/ob versus BTBRob/ob+BI-749327. BDA-410 and BI-749327 prevent diabetes-induced SQSTM1 accumulation in podocytes.
Figure 6
Figure 6
TRPC6 expression, autophagic flux assessment, and podocyte injury in patients with diabetic kidney disease. (A) Representative immunofluorescence of SYNPO (white), TRPC6 (green), and SQSTM1 (red) expression in the glomerulus from controls and patients with diabetes. Nuclei are stained in blue with Hoechst. Scale bar: 75 μm. (B) Quantifications of SYNPO, TRPC6, SQSTM1, and CAST expressions. Values are presented as individual plots of each patient and mean±SEM. **P < 0.01, ***P < 0.001, ****P < 0.0001. SYNPO and CAST expressions are low in patients with diabetes while TRPC6 expression increases and SQSTM1 accumulates in podocytes. (C) Correlation matrix of the glomerular areas of SQSTM1, TRPC6, and SYNPO and the glomerular diabetic lesion score (GDLS) in patients by individual glomerulus. Numbers in squares represent Pearson r (P value). (D) Quantifications of CAST expression in glomeruli. Values are presented as individual plots of each patient and mean±SEM. (E) Correlation between the mean glomerular expression of SQSTM1, TRPC6, and SYNPO and biologic parameters of patients (eGFR and UACR). Numbers in squares represent: Pearson r (P value); glomerular diabetic lesion score; UACR, urinary albumin-to-creatinine ratio.
Figure 7
Figure 7
SQSTM1, TRPC6, SYNPO, and CAST glomerular area discriminate patients with DKD from those with proteinuria. (A) Dispersion of SQSTM1, TRPC6, SYNPO, and CAST glomerular area in glomeruli in patients with DKD (blue) or patients with proteinuria (yellow, PROT). (B) Principal component analysis of patients with DKD and PROT using SQSTM1, TRPC6, SYNPO, and CAST glomerular areas as covariables. (C) We generated a binomial logistic regression model with SQSTM1, TRPC6, SYNPO, and CAST glomerular areas as covariables, and a ROC curve illustrating prediction was plotted. AUC=0.9.
Figure 8
Figure 8
Interplay between calpain and TRPC6 results in impaired podocyte autophagy and podocyte injury in diabetic kidney disease (DKD). DKD results in enhanced transient receptor potential channel 6 (TRPC6) expression and subsequently elevated TRPC6-mediated Ca2+ influx in podocytes. Increased TRPC6-mediated Ca2+ influx leads to enhanced calpain activation and autophagy inhibition. Impaired autophagy will lead to podocyte injury and proteinuria formation. Inhibition of calpain (by calpastatin or pharmacologic inhibition) or TRPC6 inhibition restores podocyte autophagy flux and prevents proteinuria development in DKD.

References

    1. Yuan CM, Nee R, Ceckowski KA, Knight KR, Abbott KC. Diabetic nephropathy as the cause of end-stage kidney disease reported on the medical evidence form CMS2728 at a single center. Clin Kidney J. 2017;10(2):257–262. doi:10.1093/ckj/sfw112 - DOI - PMC - PubMed
    1. Onyenwenyi C, Ricardo AC. Impact of lifestyle modification on diabetic kidney disease. Curr Diab Rep. 2015;15(9):60. doi:10.1007/s11892-015-0632-3 - DOI - PMC - PubMed
    1. Ruggenenti P, Cravedi P, Remuzzi G. The RAAS in the pathogenesis and treatment of diabetic nephropathy. Nat Rev Nephrol. 2010;6:319–330. doi:10.1038/nrneph.2010.58 - DOI - PubMed
    1. Neuen BL, Young T, Heerspink HJL, Neal B, Perkovic V, Billot L. SGLT2 inhibitors for the prevention of kidney failure in patients with type 2 diabetes: a systematic review and meta-analysis. Lancet Diabetes Endocrinol. 2019;7(11):845–854. doi:10.1016/S2213-8587(19)30256-6 - DOI - PubMed
    1. Heerspink HJL, Stefansson BV, Correa-Rotter R, Chertow GM, Greene T, Hou FF. Dapagliflozin in patients with chronic kidney disease. N Engl J Med. 2020;383(15):1436–1446. doi:10.1056/NEJMoa2024816 - DOI - PubMed

Publication types

Associated data