. 2023 Nov 1;34(11):1875-1888.
doi: 10.1681/ASN.0000000000000224. Epub 2023 Sep 6.

Electrolyte Disorders in Mitochondrial Cytopathies: A Systematic Review

Affiliations

Electrolyte Disorders in Mitochondrial Cytopathies: A Systematic Review

Daan H H M Viering et al. J Am Soc Nephrol. .

Abstract

Significance statement: Several recent studies identified mitochondrial mutations in patients with Gitelman or Fanconi syndrome. Mitochondrial cytopathies are generally not considered in the diagnostic workup of patients with electrolyte disorders. In this systematic review, we investigated the presence of electrolyte disorders in patients with mitochondrial cytopathies to determine the relevance of mitochondrial mutation screening in this population. Our analysis demonstrates that electrolyte disorders are commonly reported in mitochondrial cytopathies, often as presenting symptoms. Consequently, more clinical attention should be raised for mitochondrial disease as cause for disturbances in electrolyte homeostasis. Further prospective cohort studies are required to determine the exact prevalence of electrolyte disorders in mitochondrial cytopathies.

Background: Electrolyte reabsorption in the kidney has a high energy demand. Proximal and distal tubular epithelial cells have a high mitochondrial density for energy release. Recently, electrolyte disorders have been reported as the primary presentation of some mitochondrial cytopathies. However, the prevalence and the pathophysiology of electrolyte disturbances in mitochondrial disease are unknown. Therefore, we systematically investigated electrolyte disorders in patients with mitochondrial cytopathies.

Methods: We searched PubMed, Embase, and Google Scholar for articles on genetically confirmed mitochondrial disease in patients for whom at least one electrolyte is reported. Patients with a known second genetic anomaly were excluded. We evaluated 214 case series and reports (362 patients) as well as nine observational studies. Joanna Briggs Institute criteria were used to evaluate the quality of included studies.

Results: Of 362 reported patients, 289 had an electrolyte disorder, with it being the presenting or main symptom in 38 patients. The average number of different electrolyte abnormalities per patient ranged from 2.4 to 1.0, depending on genotype. Patients with mitochondrial DNA structural variants seemed most affected. Reported pathophysiologic mechanisms included renal tubulopathies and hormonal, gastrointestinal, and iatrogenic causes.

Conclusions: Mitochondrial diseases should be considered in the evaluation of unexplained electrolyte disorders. Furthermore, clinicians should be aware of electrolyte abnormalities in patients with mitochondrial disease.


Conflict of interest statement

R.J.M. Bindels reports Advisory or Leadership Role: REGMED XB Regenerative Medicine Crossing Borders; and Other Interests or Relationships: Scientific Board of the Dutch Kidney Foundation. J.H.F. de Baaij reports Other Interests or Relationships: Research funding from the Dutch Diabetes Research Foundation, the Dutch Kidney Foundation, the Dutch Organization of Scientific Research, and the European Union. J. Deinum reports Speakers Bureau: Health Investment and Prevents. L. Vermeltfoort reports Employer: House of Smart and Jeroen Bosch Ziekenhuis (boyfriend). The remaining author has nothing to disclose.

Figures

Figure 1
Figure 1
PRISMA flowchart. Number of articles identified, screened, assessed for eligibility, and included reported in a flow diagram as directed by the PRISMA guidelines. PheWAS, phenome-wide association study.
Figure 2
Figure 2
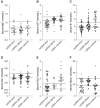
Serum electrolyte values per patient. (A–F) Serum electrolyte values as reported in included patients from case reports and case series. If multiple electrolyte values were reported, the most extreme value was plotted. If only qualitative data were available, or when values were unrealistic, no point was plotted. Dotted lines represent the upper and lower limit of normal adults. Of note, phosphate reference ranges (E) are provided for adults but are strongly age-dependent; therefore, the plotted reference range will not apply to all data points. For instance, the normal range for neonates 0–5 days of age is 1.55–2.65 mmol/L, and all ages have been included in this graph. mtDNA, mitochondrial DNA; nDNA, nuclear DNA; SNVs, single nucleotide variants; SVs, structural variants.
Figure 3
Figure 3
Number of electrolyte abnormalities per patient. (A–C) The number of electrolyte abnormalities in included patients from case reports and case series. For classification of an electrolyte value as abnormal, judgment by the reporting author was followed. mtDNA, mitochondrial DNA; nDNA, nuclear DNA; SNVs, single-nucleotide variants; SVs, structural variants.
Figure 4
Figure 4
Number of electrolyte abnormalities among male and female patients. (A–C) The number of electrolyte abnormalities in included patients from case reports and case series, split by sex. Gray bars represent female patients, and black bars represent male patients. For classification of an electrolyte value as abnormal, judgment by the reporting author was followed. mtDNA, mitochondrial DNA; nDNA, nuclear DNA; SNVs, single-nucleotide variants; SVs, structural variants.
Figure 5
Figure 5
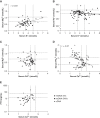
Within-patient correlation between electrolytes. (A–E) Correlation between selected serum electrolytes in the same patient from case reports and case series. If multiple electrolyte values were reported, the most extreme value was plotted. If only qualitative data were available, or when values were unrealistic, no point was plotted. Dotted lines represent the upper and lower limit of normal in adults. Linear correlations were also plotted on the basis of the combined data, and a Pearson correlation coefficient (r) was provided when a statistically significant correlation existed. Phosphate reference ranges (D) are provided for adults but are strongly age-dependent; therefore, the plotted reference range will not apply to all data points. For instance, the normal range for neonates 0–5 days of age is 1.55–2.65 mmol/L, and all ages have been included in this graph. PTH values were often reported as below or above a certain measurement limit. In that case, the measurement limit was plotted instead. mtDNA, mitochondrial DNA; nDNA, nuclear DNA; PTH, parathyroid hormone; SNVs, single-nucleotide variants; SVs, structural variants.

References

    1. Alston CL, Rocha MC, Lax NZ, Turnbull DM, Taylor RW. The genetics and pathology of mitochondrial disease. J Pathol. 2017;241(2):236–250. doi:10.1002/path.4809 - DOI - PMC - PubMed
    1. Gorman GS Chinnery PF DiMauro S, et al. . Mitochondrial diseases. Nat Rev Dis Primers. 2016;2(1):16080. doi:10.1038/nrdp.2016.80 - DOI - PubMed
    1. Pellock J, Behrens M, Lewis L, Holub D, Cartter S, Rowland L. Kearns-Sayre syndrome and hypoparathyroidism. Ann Neurol. 1978;3(5):455–458. doi:10.1002/ana.410030519 - DOI - PubMed
    1. Viering D Schlingmann KP Hureaux M, et al. . Gitelman-like syndrome caused by pathogenic variants in mtDNA. J Am Soc Nephrol. 2022;33(2):305–325. doi:10.1681/ASN.2021050596 - DOI - PMC - PubMed
    1. Choe Y Park E Hyun HS, et al. . A 7-year-old girl presenting with a Bartter-like phenotype: answers. Pediatr Nephrol. 2017;32(6):983–985. doi:10.1007/s00467-016-3480-8 - DOI - PubMed

Publication types

MeSH terms

Substances

Supplementary concepts

LinkOut - more resources