Meta-Analysis
. 2024 Jan 1;48(1):15-26.
doi: 10.1097/NPT.0000000000000456. Epub 2023 Sep 7.

Moderate to Vigorous Intensity Locomotor Training After Stroke: A Systematic Review and Meta-analysis of Mean Effects and Response Variability

Affiliations
Meta-Analysis

Moderate to Vigorous Intensity Locomotor Training After Stroke: A Systematic Review and Meta-analysis of Mean Effects and Response Variability

Pierce Boyne et al. J Neurol Phys Ther. .

Abstract

Background and purpose: This meta-analysis quantified mean effects of moderate to vigorous intensity locomotor training (LT mv ) on walking outcomes in subacute and chronic stroke, and the magnitude of variability in LT mv response.

Methods: Databases were searched for randomized trials comparing LT mv with no intervention, nongait intervention, or low-intensity gait training. Comfortable gait speed (CGS), fastest gait speed (FGS), 6-minute walk test (6MWT), walking activity (steps per day), and adverse effect/event (AE) data were extracted. Pooled estimates were calculated for mean changes, AE relative risks, and the standard deviation of response (SD response ) to LT mv versus control groups, stratified by study chronicity where possible.

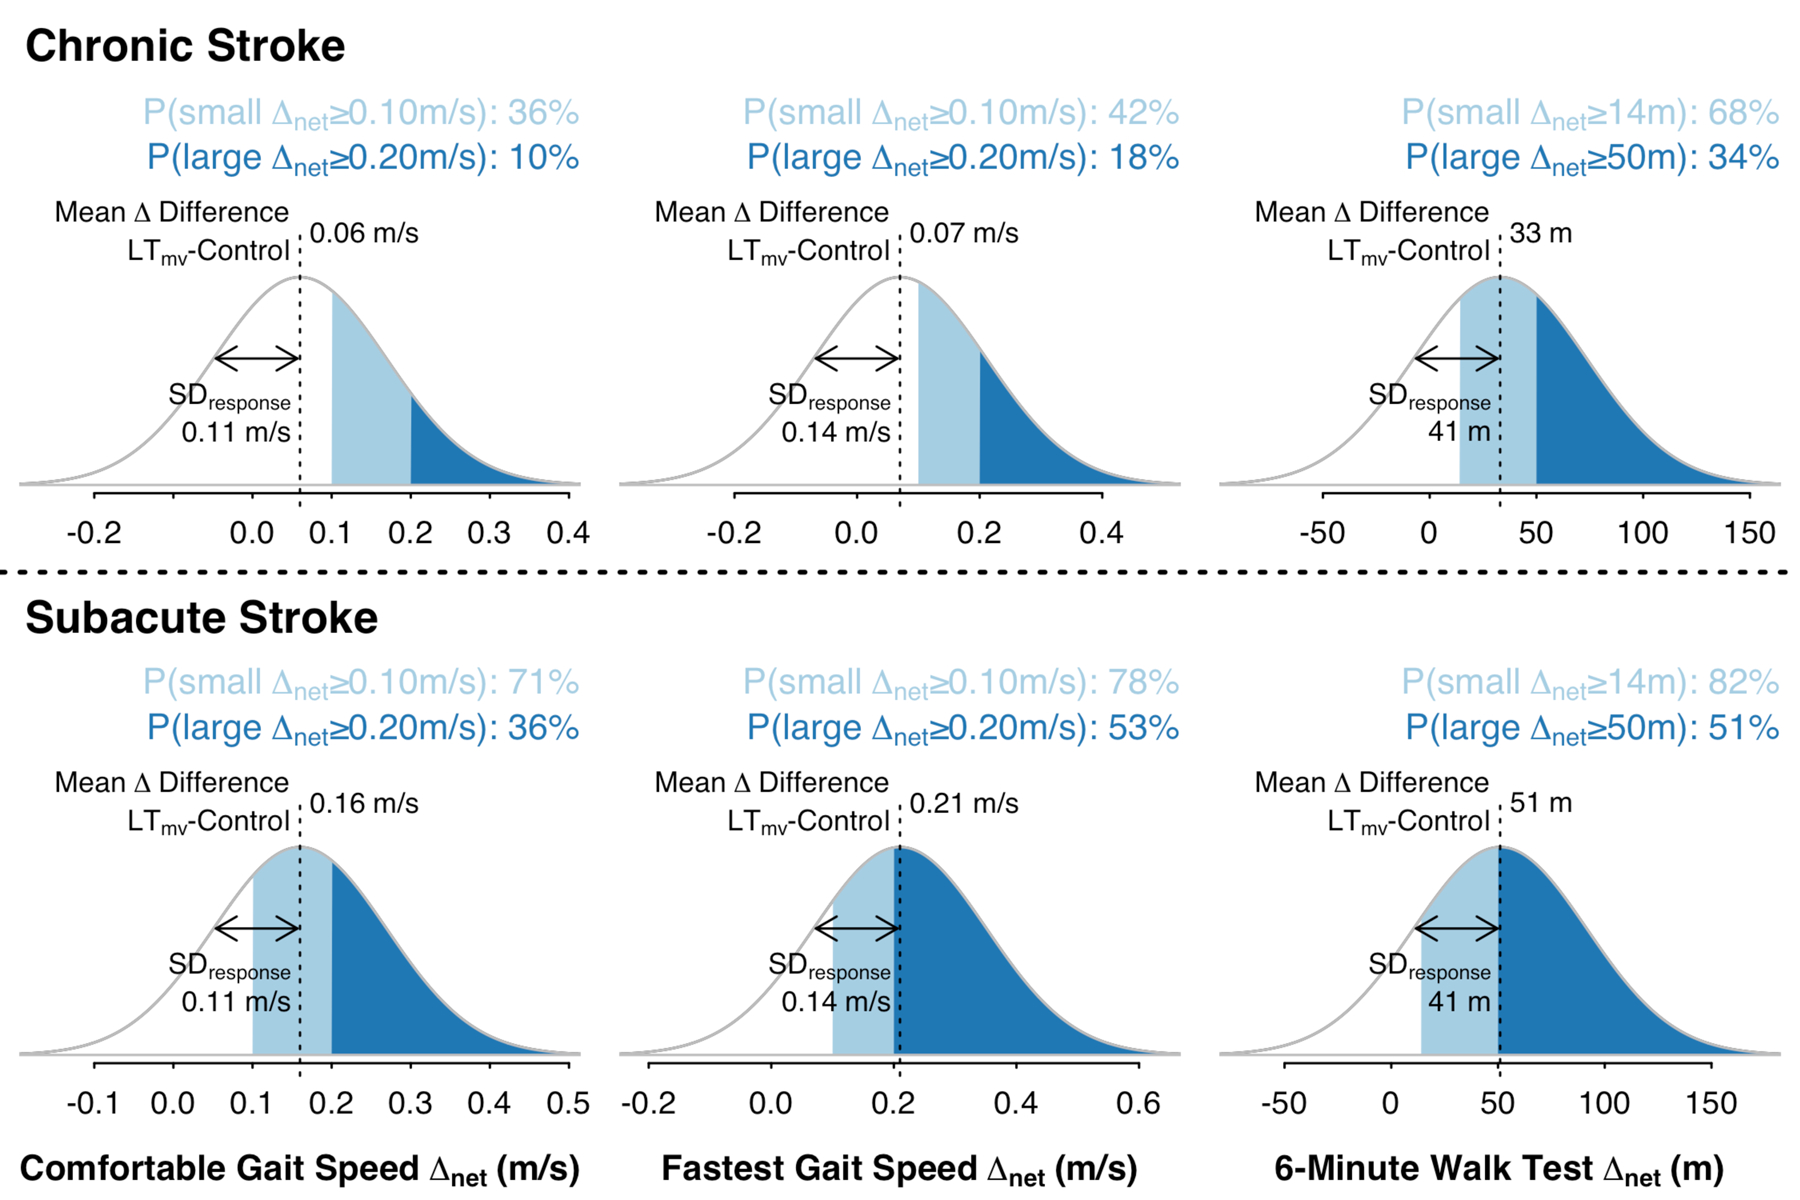
Results: There were 19 eligible studies (total N = 1096): 14 in chronic stroke (N = 839) and 5 in subacute stroke (N = 257). Compared with control interventions, LT mv yielded significantly greater increases in CGS (chronic, +0.06 m/s [95% confidence interval (CI), 0.01-0.10]; subacute, +0.16 [0.12-0.19]; subacute vs chronic, P = 0.03), FGS (chronic, +0.07 m/s [0.02-0.13]; subacute, +0.21 [0.01, 0.41]; P = 0.04), and 6MWT (chronic, +33 m [24-42]; subacute, +51 [26-77]; P = 0.054) but not steps/day (+260 [-1159 to 1679]). There were no treatment-related serious AEs among 398 LT mv participants in 14 AE-reporting studies. SD response estimates indicated substantial response variability: CGS, 0.11 m/s [0.00-0.15]; FGS, 0.14 m/s [-0.00 to 0.20]; and 6MWT, 41 m [27-51].

Discussion and conclusions: LT mv improves mean walking capacity outcomes in subacute and chronic stroke and does not appear to have high risk of serious harm. Response magnitude varies within and between chronicity subgroups, and few studies have tested effects on daily walking activity or non-serious AEs.Video Abstract available for more insights from the authors (see the Video, Supplemental Digital Content 1 available at: http://links.lww.com/JNPT/A452 ).


Conflict of interest statement

The authors declare no conflicts of interest.

Figures

Figure 1.
Figure 1.
Mean change (Δ) differences for LTmv versus control interventions: 6-minute walk test. Results from a random (mixed) effects meta-analysis stratified by stroke chronicity. The gray shaded region in the forest plot shows a range of clinically important difference thresholds in the literature (14–50 m). Risk-of-bias assessment was performed using the RoB-2 tool, yielding an overall (O) judgment based on the following domains: R, Bias arising from the randomization process; D, Bias due to deviations from intended intervention; Mi, Bias due to missing outcome data; Me, Bias in measurement of the outcome; S, Bias in selection of the reported result. Other abbreviations: N, number of participants randomized; Nimp, number of randomized participants not included in the reported analysis whose outcomes were imputed; SDΔ, standard deviation of change; LTmv, moderate-to-vigorous intensity locomotor training; SE, standard error; Weight, % contribution of each study and subgroup to the overall pooled estimate; I, % of variance attributed to between-study heterogeneity;τ, estimated between-study standard deviation. Heterogeneity p-values are from Cochran’s Q test.
Figure 2.
Figure 2.
Variance of response (Varresponse): 6-minute walk test. Results from a random (mixed) effects meta-analysis stratified by stroke chronicity. Varresponse was calculated as the variance in change for the LTmv group minus the variance in change for the control group. SDresponse estimates and 95%CI can be obtained by taking the square root of the absolute values in this figure, while preserving any negative values. The gray shaded region in the forest plot shows a range of clinically important difference thresholds in the literature (14–50 m), converted to variance units by halving and squaring (49–625 m)., Abbreviations: N, number of participants analyzed; SDΔ, standard deviation of change; LTmv, moderate-to-vigorous intensity locomotor training; SE, standard error; Weight, % contribution of each study and subgroup to the overall pooled estimate; I, % of variance attributed to between-study heterogeneity;τ, estimated between-study standard deviation. Heterogeneity p-values are from Cochran’s Q test.
Figure 3.
Figure 3.
Estimated probability of meaningful response attributable to LTmv. Graphs show the estimated distributions of true net response (Δnet) to LTmv versus control (i.e. difference in expected improvement with LTmv relative to control interventions), based on the meta-analysis results. Separate distributions were calculated for each outcome measure (from left to right: comfortable gait speed, fastest gait speed, 6-minute walk test) and for each stroke chronicity subgroup (top panel, chronic; bottom panel, subacute). The mean of each distribution is the meta-analysis estimate of the mean Δ difference (LTmv – control), and the SD of each distribution is the meta-analysis estimate of the SDresponse (the estimate of the true response variability)., Reported probabilities (P) represent the proportion of the distribution that is at or above different clinically important difference thresholds from the literature. These thresholds ranged from 0.10 m/s (small) to 0.20 m/s (large) for gait speed and from 14 m (small) to 50 m (large) for the 6-minute walk test.

References

    1. Hornby TG, Reisman DS, Ward IG, et al. Clinical practice guideline to improve locomotor function following chronic stroke, incomplete spinal cord injury, and brain injury. J Neurol Phys Ther 2020;44(1):49–100. doi: 10.1097/NPT.0000000000000303 [doi]. - DOI - PubMed
    1. Thomas J, Chandler J, Cumpston M, Li T, Page MJ, Welch VA. Cochrane handbook for systematic reviews of interventions version 6.3. Cochrane; 2022:www.training.cochrane.org/handbook.
    1. Mills HL, Higgins JPT, Morris RW, et al. Detecting heterogeneity of intervention effects using analysis and meta-analysis of differences in variance between trial arms. Epidemiology 2021;32(6):846–854. - PMC - PubMed
    1. Swinton PA, Hemingway BS, Saunders B, Gualano B, Dolan E. A statistical framework to interpret individual response to intervention: Paving the way for personalized nutrition and exercise prescription. Frontiers in nutrition (Lausanne) 2018;5:41. - PMC - PubMed
    1. Danks KA, Pohlig R, Reisman DS. Combining fast-walking training and a step activity monitoring program to improve daily walking activity after stroke: A preliminary study. Arch Phys Med Rehabil 2016;97(9 Suppl):185. - PMC - PubMed