. 2023 Sep 7;14(1):5499.
doi: 10.1038/s41467-023-41198-6.

Unexpected worker mating and colony-founding in a superorganism

Affiliations

Unexpected worker mating and colony-founding in a superorganism

Mingsheng Zhuang et al. Nat Commun. .

Abstract

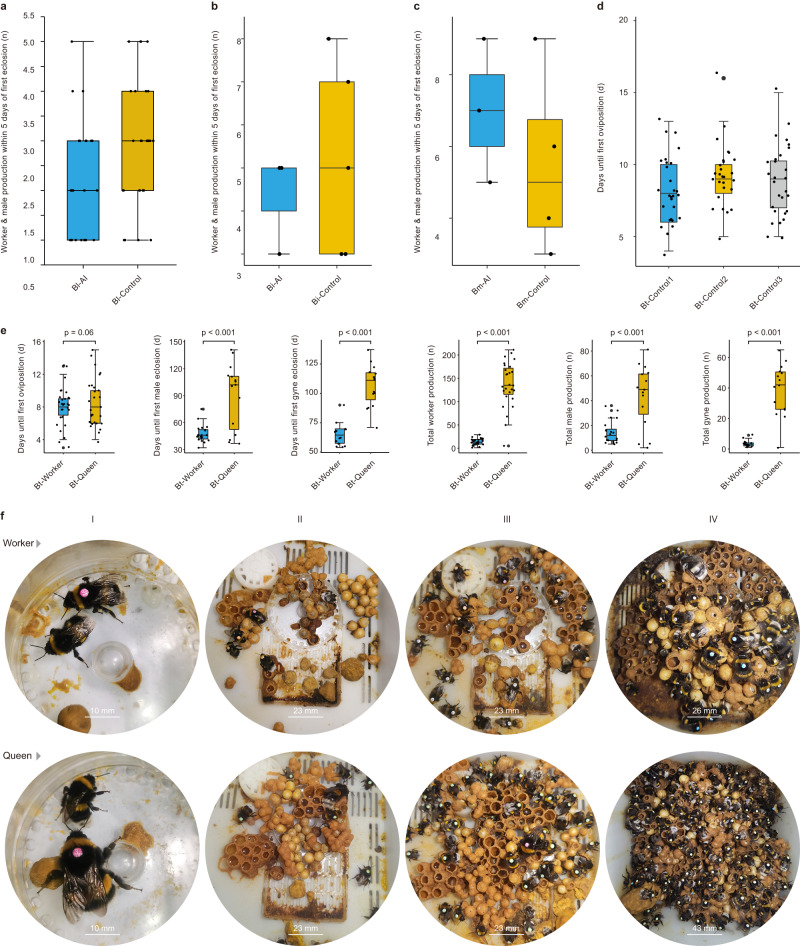
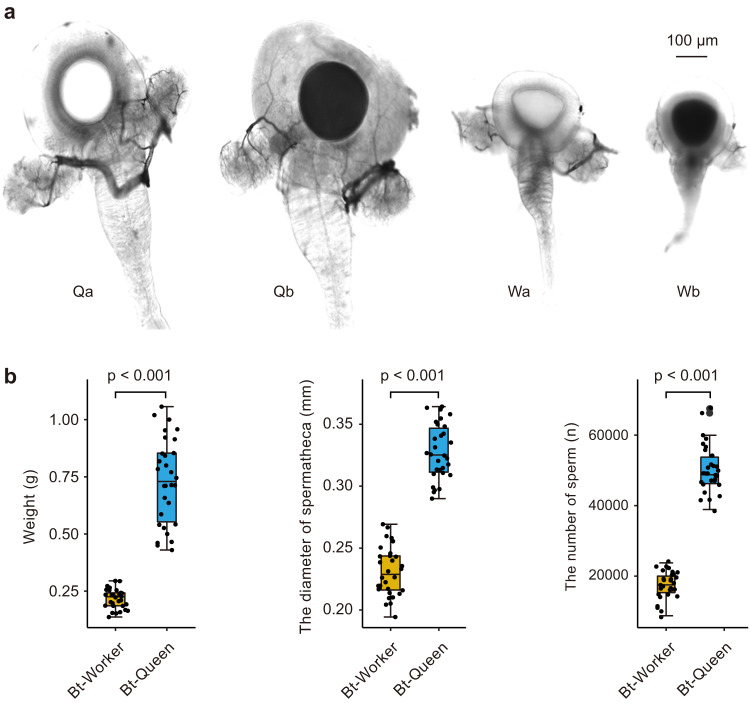
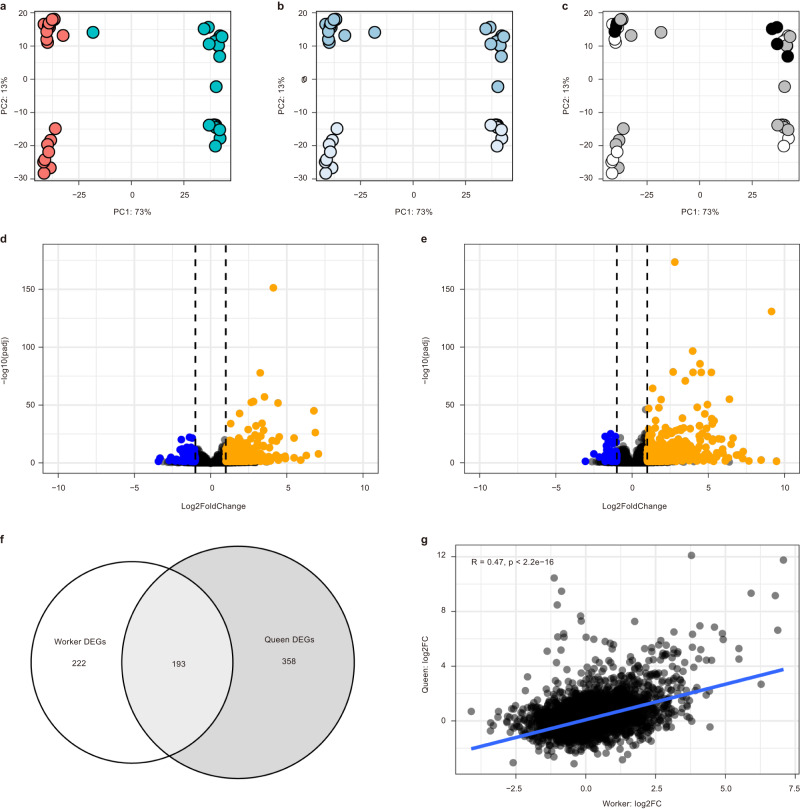
The emergence of caste-differentiated colonies, which have been defined as 'superorganisms', in ants, bees, and wasps represents a major transition in evolution. Lifetime mating commitment by queens, pre-imaginal caste determination and lifetime unmatedness of workers are key features of these animal societies. Workers in superorganismal species like honey bees and many ants have consequently lost, or retain only vestigial spermathecal structures. However, bumble bee workers retain complete spermathecae despite 25-40 million years since their origin of superorganismality, which remains an evolutionary mystery. Here, we show (i) that bumble bee workers retain queen-like reproductive traits, being able to mate and produce colonies, underlain by queen-like gene expression, (ii) the social conditions required for worker mating, and (iii) that these abilities may be selected for by early queen-loss in these annual species. These results challenge the idea of lifetime worker unmatedness in superorganisms, and provide an exciting new tool for the conservation of endangered bumble bee species.


Conflict of interest statement

The authors declare no competing interests.

Figures

Fig. 1
Fig. 1. Egg-laying and colony development for workers and queens in the artificial insemination experiments.
Worker and male production within five days of first eclosion by artificially inseminated (AI)(blue boxes) and control workers (orange boxes)(initial N = 30 in both groups for B. lantschouensis and B. ignitus, N = 20 in both groups for B. montivagus; figures are based on successful egg-layers, sample sizes shown below) of a B. lantschouensis (AI = 23, Control = 26) b B. ignitus (AI = 3, Control = 5), and c B. montivagus (AI = 3, Control = 3). d Date of first oviposition by B. terrestris workers from treatments Control 1 (Bombus terrestris workers without artificial insemination, blue boxes, N = 30), Control 2 (B. terrestris workers with the artificial insemination procedure only, orange box, N = 30), and Control 3 (B. terrestris workers with artificial insemination who received the sperm diluent, grey box, N = 30). e Comparison of colony development between artificially inseminated B. terrestris workers (blue boxes) and queens (orange boxes)(initial N = 30 in both groups, sample sizes for individual figures shown below). P values were determined by two-sided t-tests. The date of first oviposition (Worker = 29, Queen = 29), the eclosion date of the first batch of workers (Worker = 25, Queen = 27), the eclosion date of the first batch of males (Worker = 20, Queen = 15), the eclosion date of the first batch of new queens (Worker = 14, Queen = 15), the number of the first batch of workers (within 5 days of first eclosion)(Worker = 25, Queen = 27), the total number of workers per colony (Worker = 25, Queen = 27), the total number of males per colony (Worker = 20, Queen = 15), the total number of new queens per colony (Worker = 14, Queen = 15). Figures ae show raw data and summary box plots where the box plots consist of the box denoting the interquartile range (IQR), bound by the 25th and 75th percentiles, the median line shown within the box, and the whiskers representing the rest of the data distribution with outliers denoted by points greater than ±1.5 x IQR. f Colonies produced by workers and queens went through the same colony stages: I: 1st brood; II: 2nd brood cells constructed on top of 1st brood pupae; III: Continuous worker brood production; and IV: Eventual switch to haploid egg-laying, including onset of competition phase.
Fig. 2
Fig. 2. The spermathecae, anatomy, and sperm number of artificially inseminated workers and queens in Bombus terrestris.
a Spermathecae of queens (Q) and workers (W) before (a) and after (b) artificial insemination. The spermathecae were photographed using a Leica TCS SP8 laser scanning confocal microscope with 20x magnification. b Queens (blue boxes, N = 29) had longer wings, were heavier, had larger spermathecae, and stored more sperm after insemination, compared to workers (orange boxes, N = 30). Figure b shows raw data and summary box plots. Box plots consist of the box denoting the interquartile range (IQR), bound by the 25th and 75th percentiles, the median line shown within the box, and the whiskers representing the rest of the data distribution with outliers denoted by points greater than ±1.5 x IQR. P values were determined by two-sided t-tests.
Fig. 3
Fig. 3. Conserved transcriptional responses in Bombus terrestris workers and queens to insemination.
ac Scatterplots displaying first and second principal components from a PCA performed on variance-stabilization transformed gene level counts revealing caste-specific gene expression profiles in gene expression profiles of reproductive tissues, including spermatheca, vagina and median oviduct, between: (a) the castes (red = queen; turquoise = worker); and (b) insemination status (blue = unfertilized (control) bees; pale blue = inseminated bees). In comparison, no clear separation of samples was identified based on days post-insemination (c: black dot = two days post-insemination; grey dot = four days post-insemination; and white dot = eight days post-insemination). d, e Differential expression analysis revealed similarities between queens and workers in terms of response to insemination. For both (d) workers and (e) queens, insemination resulted in general patterns of elevated gene expression (Likelihood Ratio Test: Benjamini-Hochberg adjusted P (padj) <0.05) compared to control bees (orange dots = elevated differentially expressed genes (DEGs) compared to control; blue dots = reduced DEGs compared to control; black dashed vertical lines indicate log2 fold change (log2FC) thresholds for elevated (log2FC = 1) and reduced (log2FC = −1) gene expression. f, g Euler plot displaying overlap in DEGs shared by both queens and workers in response to artificial insemination while correlation analysis (Pearson’s correlation coefficient) revealed a significant positive correlation between log2FC values assigned to genes affected by insemination.
Fig. 4
Fig. 4. Mating experiment and size comparison of mated workers and queens.
a A B. terrestris worker (left) and queen (right) mating with males. b Isolation from the colony environment for seven days post-eclosion enabled worker mating: prior to mating trials at day seven, Bt-W = each B. terrestris callow worker was kept in one box (N = 90); Bt-Q = one B. terrestris gyne tagged as a callow was randomly selected from each colony (N = 99); Bt-WC = one B. terrestris worker tagged as a callow and returned to the colony was randomly selected from each colony (N = 90); Bl-W = B. lantschouensis callow workers were kept in a single box (N = 45); Bl-WC = one B. lantschouensis worker tagged as a callow and returned to the colony was randomly selected from each colony (N = 45); Bi-W = B. ignitus callow workers were kept in individual boxes for seven days (N = 45); and Bi-WC = one B. ignitus worker tagged as a callow and returned to the colony was randomly selected from each colony (N = 45). c B. terrestris worker age influences mating success (days 3–10, N = 90, 128, 96, 90, 96, 92, 89, 91, respectively). d Physical contact with queens inhibits B. terrestris worker mating: Queen-contactable workers = each callow kept in a box with an egg-laying queen, enabling physical contact; Queen-separated workers = physical contact prevented by a metal mesh (ϕ 1 mm); Isolated workers = callows kept individually. e Worker presence inhibits mating ability: Bt-W1 = three callows collected on the same day kept in one box; Bt-W2 = one callow kept with two tagged additional callows, repeatedly replaced by new callows every 24 h; Bt-W3 = each callow kept with two tagged egg-laying workers; and Bt-WC = each callow kept alone. f Larval feeding behavior inhibits the mating ability of workers: Larval exposure = each callow kept with three larvae in one box; and Solitary = each callow kept alone. g Time spent in a social environment post–eclosion influences mating success. Data in b and f were analyzed using Fisher’s test. Data in d, e and g were analyzed using G-tests. All mating experiments were repeated three times, and as patterns were consistent, data were combined for analysis.

References

    1. Wheeler WM. The ant-colony as an organism. J. Morphol. 1911;22:307–325.
    1. Boomsma JJ, Gawne R. Superorganismality and caste differentiation as points of no return: how the major evolutionary transitions were lost in translation. Biol. Rev. 2018;93:28–54. - PubMed
    1. Boomsma, J. J. Domains and major transitions of social evolution (Oxford University Press, New York. 2022).
    1. Maynard, S. J. & Szathmáry, E. The major transitions in evolution. Chapter 2: Group formation, relatedness and the evolution of multicellularity (Oxford New York. Press, 1995).
    1. Michener CD, Brothers DJ. Were workers of eusocial Hymenoptera initially altruistic or oppressed? PNAS. 1974;71:671–674. - PMC - PubMed

Publication types