. 2023 Sep 7;14(1):5507.
doi: 10.1038/s41467-023-41246-1.

Heterogeneity in M. tuberculosis β-lactamase inhibition by Sulbactam

Affiliations

Heterogeneity in M. tuberculosis β-lactamase inhibition by Sulbactam

Tek Narsingh Malla et al. Nat Commun. .

Abstract

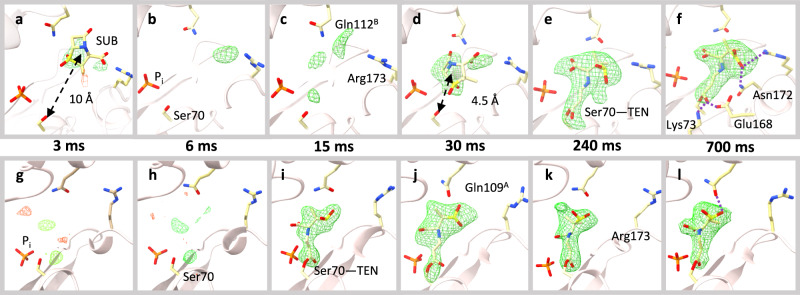
For decades, researchers have elucidated essential enzymatic functions on the atomic length scale by tracing atomic positions in real-time. Our work builds on possibilities unleashed by mix-and-inject serial crystallography (MISC) at X-ray free electron laser facilities. In this approach, enzymatic reactions are triggered by mixing substrate or ligand solutions with enzyme microcrystals. Here, we report in atomic detail (between 2.2 and 2.7 Å resolution) by room-temperature, time-resolved crystallography with millisecond time-resolution (with timepoints between 3 ms and 700 ms) how the Mycobacterium tuberculosis enzyme BlaC is inhibited by sulbactam (SUB). Our results reveal ligand binding heterogeneity, ligand gating, cooperativity, induced fit, and conformational selection all from the same set of MISC data, detailing how SUB approaches the catalytic clefts and binds to the enzyme noncovalently before reacting to a trans-enamine. This was made possible in part by the application of singular value decomposition to the MISC data using a program that remains functional even if unit cell parameters change up to 3 Å during the reaction.


Conflict of interest statement

The authors declare no competing interests.

Figures

Fig. 1
Fig. 1. A simplified two-step mechanism of BlaC inhibition by sulbactam.
a The first step is the formation of a noncovalent enzyme inhibitor complex (E:I) whose rate of formation depends on the concentration of the inhibitor in the unit cell and the rate coefficient (kncov). The reaction proceeds through a covalently bound (short-lived) acyl intermediate (E-I) and results in a product E-I*. be Structural view of the reaction. b The characteristic β-lactam ring is marked and the nucleophilic attack by Ser70 is shown by a green arrow. c The nucleophilic attack by the active serine opens the lactam ring of SUB leading to the formation of acyl-enzyme intermediate (E-I). In this current state, the E-I is very unstable and causes reorganization of bonds shown by dotted arrows. The E-I intermediate does not accumulate to become observable. The next step is the irreversible inhibition of enzyme by the chemically modified inhibitor (E-I*) which depends on the apparent rate coefficient (kcov). The modification is the permanent opening of the 5-member thiazolidine ring and formation of either d cis-enamine (cis E-I*) and then to e trans-enamine (trans E-I*) or directly to trans-enamine following the blue dotted arrow. Cis- and trans-enamines differ in the configuration of the C5 = C6 double bond. A second nucleophilic attack by Ser128 on C5 may lead to cleavage of the fragment shown in the dotted box in e. Further modifications are possible which are not shown here.
Fig. 2
Fig. 2. Structure of BlaC and the gating mechanism.
a Subunits A – D in the asymmetric unit are marked and shown by blue, red, green, and yellow respectively. b Binding pockets of subunit A (left) and subunit B (right). The active site is represented by the white surface. The position of the catalytically active serine is marked in green. The access to the active site in subunit B is wide open. The entrance to the active site of subunit A is partially occluded by two residues (Gln112B and Arg173) called the guardian residues. c Simplified scheme depicting the delayed entry of sulbactam into the active site through the guardian residues in subunits A/C. d Time-dependence of the concentration difference (blue line) and of the rate coefficient kentry (orange line). Inset: The dependence of kentry on the concentration difference.
Fig. 3
Fig. 3. Difference electron density (DED) maps in the active sites of subunit A and subunit B.
Omit maps are shown in all panels except for panels d, f, j, and l which show Polder maps (contour levels ±3σ). Subunit A, top row: a At 3 ms, weak densities can be identified at the entrance of cavity between Gln112B and Arg173 and a SUB placed there. (b) At 6 ms, very weak density is observed. The phosphate molecule (Pi) near the active site is marked. c At 15 ms, difference density features are identified closer to the catalytically active residue Ser70. The guardian residues (Gln112B and Arg173) that are located at the entrance to the binding pocket are marked. d At 30 ms a strong DED feature appears within the active site. An intact SUB molecule is placed there. e At 240 ms, the SUB has reacted with Ser70 to form TEN giving rise to an elongated density. f At 700 ms, the elongated density of the TEN is fully developed. Additional hydrogen bonds between the TEN and other side chains are shown. Subunit B, bottom row: g, h At 3 and 6 ms, no interpretable density was present in the catalytic center. i At 15 ms, the SUB has already reacted with Ser70 to from TEN. jl TEN densities as observed at Δmisc from 30 ms to 700 ms. Gln109A and Arg173 are marked in j and k, respectively.
Fig. 4
Fig. 4. Right singular vectors (rSVs) derived from a singular value decomposition of the time-dependent DED maps in the active sites of the BlaC.
a Right singular vectors plotted as a function of Δtmisc for subunit A. The first and second significant rSV are shown by blue and red squares respectively. Solid colored lines are the result of a global fit of Eq. 2 to the significant rSVs. The colored diamonds represent insignificant rSVs. bd Significant rSVs plotted as a function of Δtmisc for subunits B, C and D respectively. Colors and lines as in a. The vertical dashed black lines in all panels denote the relaxation times τ1 and τ2 that result from the fit. For subunits A and C, τ1 belongs to accumulation of intact SUB in the active site, and τ2 corresponds to the formation of the covalently bound TEN. For subunits B and D, τ1 denotes the time when the reaction to TEN occurs and τ2 indicates a second relaxation phase. Note: The 66 ms data were obtained from a previous (published) experiment at the European XFEL where the experimental conditions were slightly different.
Fig. 5
Fig. 5. Calculated concentration profiles of reactants and products in the active sites of BlaC compared to corresponding observables.
a Subunits B/D. Blue line: free SUB concentrations [I] in the unit cell. Blue squares: SUB concentrations in the central flow of the injector. Red line: time-dependent concentrations of the free BlaC [Efree]. Orange line: concentrations of the noncovalently bound SUB [E:I] intermediate (not observable). Green line: concentrations of the covalent enzyme-inhibitor complex TEN [E-I*]. Green triangles and diamonds: concentrations of E-I*, derived from refined ligand occupancy values in subunits B and D, respectively. Gray triangles and diamonds: SUB cannot be detected near the active sites. b Subunits A/C. Blue dotted line: free SUB concentrations [I] in the unit cell. Blue line: SUB concentrations [Iin] in the active site (note the delay relative to subunits B/D). Line colors as in a. Orange and green triangles and diamonds: concentrations of E:I and E-I* derived from refined ligand occupancy values in subunits A and B, respectively. The 66 ms data point is included from a previous (published) experiment at the European XFEL.
Fig. 6
Fig. 6. Trans-enamine on longer timescales.
a Chemical structure of the TEN after the formation of cross-linked species. The leaving group is shown in pale color. b A 2Fobs-Fcalc map (blue, 1σ contour level) is shown near the active site of subunit B at Δtmisc = 240 ms. Key active site residues and the TEN (purple) are marked. The sulphate (SO4, yellow) and acetate (ACT, green) observed in other β-lactamases (PDB entries 5OYO and 7A71, respectively) are overlayed. Hydrogen bonds established by phosphate (PO4, orange) with TEN and surrounding residues are depicted by blue dotted lines. TEN might not be able to get close to Ser128 without displacing the phosphate.
Fig. 7
Fig. 7. Regions of interest (ROI) with changing unit cell parameters.
a DED map of the entire BlaC unit cell at Δtmisc = 30 ms contoured at ±2.5 σ b The same map as in a is now displayed with the focus on the active site of subunit A. Strong DED is present where the SUB molecule is located. A mask around the SUB atom is represented by a pink surface. The density inside the mask is left unaltered while that outside the mask is set to zero. c The map after the masking operation. d A box which is a part of overall map covers the ROI. e A simple 2D diagram showing how to choose the box. The square gray grid represents the voxels. The box shown by the solid line includes the ROI at Δt1 and it is large enough to cover the evolving DED features at all other time points. The orange cloud represents the DED features at timepoint Δt1. At Δt2, the entire protein chain displaces to a new position (gray arrow) due to unit cell changes. In addition, more extensive DED features appear as shown by the green cloud. The dashed cloud next to the green DED is the relative position of the DED at Δt1. As the protein chain displaces when the unit cell parameters change, the entire box moves accordingly in the same direction (shown by the dotted box). Since the number of grid points is adjusted linearly with the changing unit cell parameters, the number of voxels within the box as well as the voxel size do not change.

Update of

References

    1. Abraham EP, Chain E. An enzyme from bacteria able to destroy Penicillin. Nature. 1940;146:837. - PubMed
    1. Boettcher, H. M. Wonder Drugs: A History of Antibiotics. (Lippincott, 1965).
    1. Ambler RP. The structure of beta-lactamases. Philos. Trans. R. Soc. London. Ser. B, Biol. Sci. 1980;289:321–331. - PubMed
    1. Hugonnet JE, Blanchard JS. Irreversible inhibition of the Mycobacterium tuberculosis beta-lactamase by clavulanate. Biochemistry. 2007;46:11998–12004. - PMC - PubMed
    1. Tremblay LW, Fan F, Blanchard JS. Biochemical and structural characterization of Mycobacterium tuberculosis beta-lactamase with the carbapenems ertapenem and doripenem. Biochemistry. 2010;49:3766–3773. - PMC - PubMed

Publication types