Meta-Analysis
. 2023 Sep;55(9):1448-1461.
doi: 10.1038/s41588-023-01462-3. Epub 2023 Sep 7.

GWAS of random glucose in 476,326 individuals provide insights into diabetes pathophysiology, complications and treatment stratification

Vasiliki Lagou #  1   2   3 Longda Jiang #  4   5 Anna Ulrich #  5   6 Liudmila Zudina  5   6 Karla Sofia Gutiérrez González  7   8 Zhanna Balkhiyarova  5   6   9 Alessia Faggian  5   6   10 Jared G Maina  6   11 Shiqian Chen  12 Petar V Todorov  13 Sodbo Sharapov  14   15 Alessia David  16 Letizia Marullo  17 Reedik Mägi  18 Roxana-Maria Rujan  19 Emma Ahlqvist  20 Gudmar Thorleifsson  21 Ηe Gao  22 Εvangelos Εvangelou  22   23 Beben Benyamin  24   25   26 Robert A Scott  27 Aaron Isaacs  7   28   29 Jing Hua Zhao  30 Sara M Willems  7 Toby Johnson  31 Christian Gieger  32   33   34 Harald Grallert  32   34 Christa Meisinger  35 Martina Müller-Nurasyid  36   37   38   39 Rona J Strawbridge  40   41   42 Anuj Goel  1   43 Denis Rybin  44 Eva Albrecht  36 Anne U Jackson  45 Heather M Stringham  45 Ivan R Corrêa Jr  46 Eric Farber-Eger  47 Valgerdur Steinthorsdottir  21 André G Uitterlinden  7   48 Patricia B Munroe  31   49 Morris J Brown  31 Julian Schmidberger  50 Oddgeir Holmen  51 Barbara Thorand  33   34 Kristian Hveem  52 Tom Wilsgaard  53   54 Karen L Mohlke  55 Zhe Wang  56 GWA-PA ConsortiumAleksey Shmeliov  6 Marcel den Hoed  57 Ruth J F Loos  13   56   58 Wolfgang Kratzer  50 Mark Haenle  50 Wolfgang Koenig  59   60   61 Bernhard O Boehm  62 Tricia M Tan  12 Alejandra Tomas  63 Victoria Salem  64 Inês Barroso  65 Jaakko Tuomilehto  66   67   68 Michael Boehnke  45 Jose C Florez  69   70   71 Anders Hamsten  40   41 Hugh Watkins  1   43 Inger Njølstad  53   54 H-Erich Wichmann  33 Mark J Caulfield  31   49 Kay-Tee Khaw  30 Cornelia M van Duijn  7   72   73 Albert Hofman  7   74 Nicholas J Wareham  27 Claudia Langenberg  27   75   76 John B Whitfield  77 Nicholas G Martin  77 Grant Montgomery  77   78 Chiara Scapoli  79 Ioanna Tzoulaki  22   23 Paul Elliott  22   80   81 Unnur Thorsteinsdottir  21   82 Kari Stefansson  21   82 Evan L Brittain  83 Mark I McCarthy  1   84   85 Philippe Froguel  5   11 Patrick M Sexton  86   87 Denise Wootten  86   87 Leif Groop  20   88 Josée Dupuis  44   89 James B Meigs  70   71   90 Giuseppe Deganutti  19 Ayse Demirkan  6   9   91 Tune H Pers  13 Christopher A Reynolds  19   92 Yurii S Aulchenko  7   14   15 Marika A Kaakinen  93   94   95 Ben Jones  96 Inga Prokopenko  97   98   99 Meta-Analysis of Glucose and Insulin-Related Traits Consortium (MAGIC)
Collaborators, Affiliations
Meta-Analysis

GWAS of random glucose in 476,326 individuals provide insights into diabetes pathophysiology, complications and treatment stratification

Vasiliki Lagou et al. Nat Genet. 2023 Sep.

Abstract

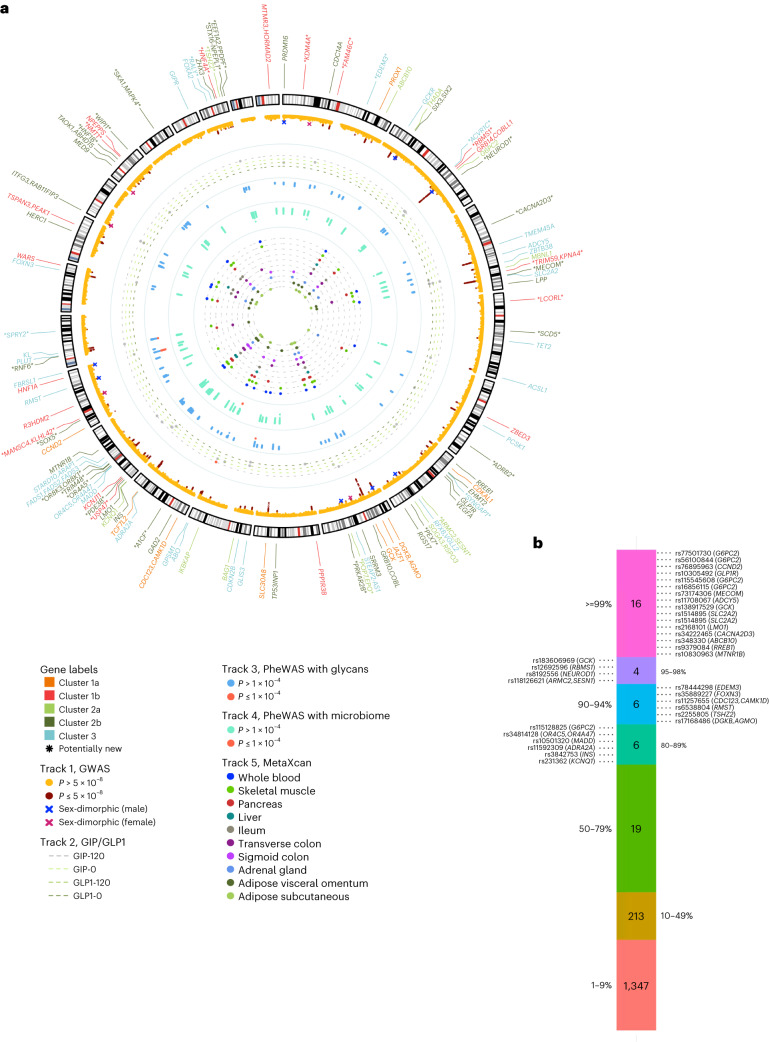
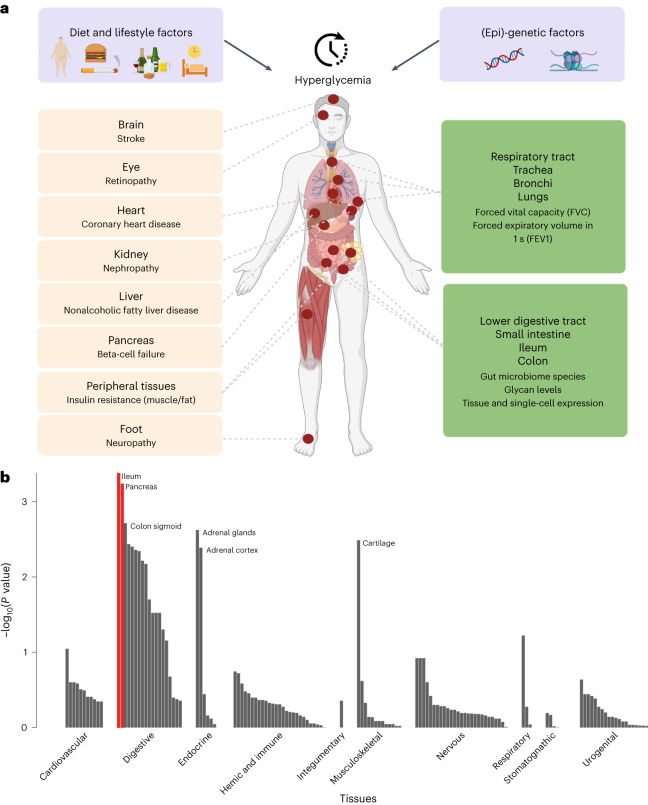
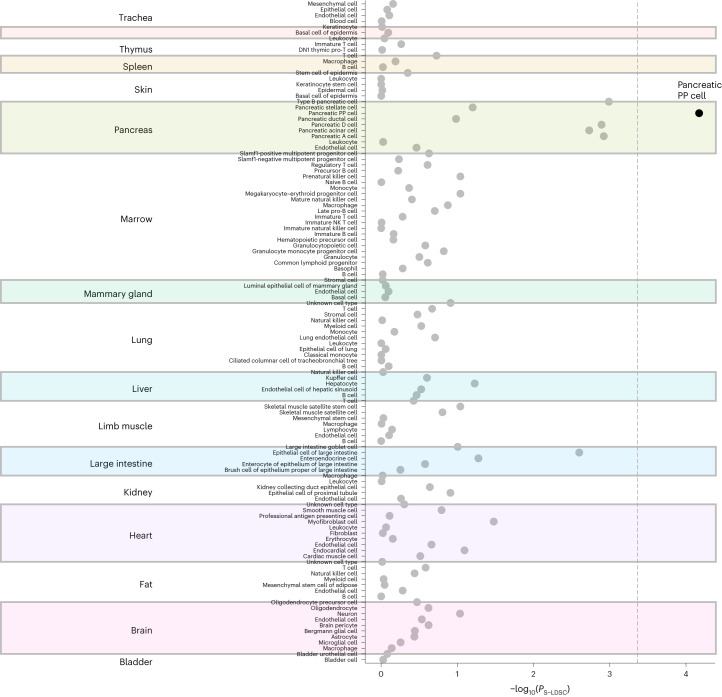
Conventional measurements of fasting and postprandial blood glucose levels investigated in genome-wide association studies (GWAS) cannot capture the effects of DNA variability on 'around the clock' glucoregulatory processes. Here we show that GWAS meta-analysis of glucose measurements under nonstandardized conditions (random glucose (RG)) in 476,326 individuals of diverse ancestries and without diabetes enables locus discovery and innovative pathophysiological observations. We discovered 120 RG loci represented by 150 distinct signals, including 13 with sex-dimorphic effects, two cross-ancestry and seven rare frequency signals. Of these, 44 loci are new for glycemic traits. Regulatory, glycosylation and metagenomic annotations highlight ileum and colon tissues, indicating an underappreciated role of the gastrointestinal tract in controlling blood glucose. Functional follow-up and molecular dynamics simulations of lower frequency coding variants in glucagon-like peptide-1 receptor (GLP1R), a type 2 diabetes treatment target, reveal that optimal selection of GLP-1R agonist therapy will benefit from tailored genetic stratification. We also provide evidence from Mendelian randomization that lung function is modulated by blood glucose and that pulmonary dysfunction is a diabetes complication. Our investigation yields new insights into the biology of glucose regulation, diabetes complications and pathways for treatment stratification.


Conflict of interest statement

A.T. has received grant funding from Sun Pharmaceuticals and Eli Lilly. J.B.M. is an academic associate for Quest Diagnostics. They make an HbA1c assay. I.R.C. is an employee of New England Biolabs, a manufacturer and vendor of reagents for life science research. M.J.C. is Chief Scientist for Genomics England, a UK Government company. The views expressed in this article are those of the author(s) and not necessarily those of the NHS, the NIHR or the Department of Health. M.I.M. has served on advisory panels for Pfizer, Novo Nordisk and Zoe Global, has received honoraria from Merck, Pfizer, Novo Nordisk and Eli Lilly and research funding from Abbvie, AstraZeneca, Boehringer Ingelheim, Eli Lilly, Janssen, Merck, Novo Nordisk, Pfizer, Roche, Sanofi Aventis, Servier and Takeda. As of June 2019, M.I.M. is an employee of Genentech and a holder of Roche stock. P.M.S. received grant funding from Laboratoires Servier. P.M.S. and D.W. receive funding from Astex Pharmaceuticals and Novo Nordisk. They are both shareholders of Septerna, where P.M.S. is also a founder. P.M.S. is the director and D.W. the Monash Node leader of the Australian Research Council of Australia Center for Cryo-Electron Microscopy of Membrane Proteins that includes the following as Partner Organizations who provide cash or in-kind funding: Astex Pharmaceuticals, AstraZeneca, Boehringer Ingelheim, Catalyst Therapeutics, Dimerix Bioscience, Genentech, Novo Nordisk, Pfizer, Sanofi Aventis, Servier and Thermo Fisher Scientific. T.J. is now a GSK employee. W. Koenig reports consulting fees from AstraZeneca, Novartis, Pfizer, The Medicines Company, DalCor, Kowa, Amgen, Corvidia, Daiichi-Sankyo, Genentech, Novo Nordisk, Esperion, OMEICOS, LIB Therapeutics; speaker honoraria from Amgen, Novartis, Berlin-Chemie, Sanofi and Bristol-Myers Squibb; grants and nonfinancial support from Abbott, Roche Diagnostics, Beckmann and Singulex, all outside the submitted work. Y.S.A. is the owner of Maatschap PolyOmica and PolyKnomics BV, private organizations providing services, research and development in the field of computational and statistical, quantitative and computational (gen)omics. G.T., U.T. and K.S. are employees of deCODE genetics/Amgen. The other authors declare no competing interests.

Figures

Fig. 1
Fig. 1. Summary of all RG loci identified in this study.
a, Circular Manhattan plot summarizing findings from this study. In the outermost layer, gene names of the 133 distinct RG signals are labeled with different colors indicating the following three clusters defined in cluster analysis: 1a/1b, metabolic syndrome; 2a/2b, insulin release versus insulin action (with additional effects on inflammatory bowel disease for cluster 2a) and 3, defects of insulin secretion. Asterisks annotate RG signals that are new for glycemic traits. Track 1 shows RG Manhattan plot reporting −log10(P value) for RG GWAS meta-analysis. Signals reaching genome-wide significance (P < 5.0 × 108) are colored in red. Crosses annotate loci that show evidence of sex heterogeneity (Psex-dimorphic < 5.0 × 108 and Psex-heterogeneity < 0.05); blue crosses for larger effects in men, green crosses for larger effects in women. Track 2 shows the effects of the 133 independent RG signals on four GIP/GLP-1-related traits GWAS. The colors of the dotted lines indicate four GIP/GLP-1-related traits: gray dot, signals reaching P < 0.010 for a GIP/GLP-1-related trait; red dot, lead SNP has a significant effect on GIP/GLP-1-related trait (Bonferroni corrected P < 1.0 × 104). Track 3 shows the effects (−log10(P value)) of the 133 independent RG signals on 113 glycan PheWAS. Track 4 shows the effects (−log10(P value)) of the 133 independent RG signals on 210 gut-microbiome PheWAS. Track 5 shows MetaXcan results for ten selected tissues for RG GWAS meta-analysis; signals colocalizing with genes (Bonferroni corrected P < 9.0 × 107) are plotted for each tissue. All P values were calculated from the two-sided z statistics computed by dividing the estimated coefficients by the estimated standard error, without adjustment. b, Credible set analysis of RG associations in the European ancestry meta-analysis. Variants from each of the RG signal credible sets are grouped based on their posterior probability (the percentiles labeled on the sides of the bar). SNP variants with posterior probability >80%, along with their locus names, are provided. All variants from the credible set of lead signals are highlighted in bold.
Fig. 2
Fig. 2. Functional and structural analysis of coding GLP1R variants.
a, Minor allele frequency-weighted linear regression was used to test if mini-Gs response to GLP-1 stimulation substantially predicted point estimates of GLP1R variant effect on RG levels (AST20 βRG as estimated in the UKBB study, nmax = 401,810). Mini-Gs response to GLP-1 stimulation was corrected for variant surface expression (nmax = 22, exact n for each variant is provided in Supplementary Table 11). Error bars extend one standard error above and below the point estimate. Size of the dots is proportional to the weight applied in the regression model. The regression results (coefficient of determination R2 = 0.74, F(1, 15) = 47.5, P = 5.1 × 106) suggest that mini-Gs coupling in response to GLP-1 stimulation predicts the effect of these coding variants on RG levels (AST20 βRG = −0.030; 95% confidence interval (CI) = −0.039 to −0.020; P = 5.1 × 106). The gray shaded area around the regression line corresponds to the 95% CI of predictions from the model. Variants in red showed no detectable surface expression (NDE) and are not included in regression analysis. b, Mean GLP1R variant mini-Gs coupling and receptor endocytosis, with surface expression correction, in response to GLP-1, OXM, glucagon (GCG), exendin-4 (Ex4), semaglutide (Sema) and tirzepatide (TZP), n = 6. Positive deviation indicates variant gain-of-function, with statistical significance inferred when the 95% CIs shown do not cross zero. Responses are also compared between pathways by unpaired t test, with an asterisk indicating statistically significant differences. c, Architecture of the complex formed between the agonist-bound GLP-1R and Gs; the likely effect triggered by residues involved in GLP-1R isoforms A316T, G168S and R421W (in magenta) are reported. d, Distributions of the distance between Y2423.45 side chain and P3125.42 backbone computed during molecular dynamics simulations of GLP-1R WT and A316T; the cut-off distance for hydrogen bond is shown. e, Difference in the hydrogen bond network between GLP-1R WT and A316T. f, Analysis of water molecules within the TMD of GLP-1R WT and A316T suggests minor changes in the local hydration of position 5.46 (unperturbed structural water molecule). Also, a stabilizing role for the water molecules at the binding site of the G protein (water cluster apha5) cannot be ruled out. g, Distributions of the distance between position 1681.63 and Y1782.48 during molecular dynamics simulations of GLP-1R WT and G168S. h, During molecular dynamics simulations, the GLP-1R isoform S168G showed increased flexibility of ICL1 and H8 compared to WT, suggesting a different influence on G-protein intermediate states. i, Contact differences between Gs and GLP-1R WT or W421R; the C terminal of W421R H8 made more interactions with the N terminal segment of the Gs β subunit. j, Mini-Gs and GLP-1R endocytosis responses to 20 nM exendin-4, plotted against surface GLP-1R expression, from 196 missense GLP1R variants transiently transfected in HEK293T cells (n = 5 repeats per assay), with data represented as mean ± s.e.m. after normalization to WT response and log10-transformation. Variants are categorized as ‘LoF1’ when the response 95% CI falls below zero or ‘LoF2’ where the expression-normalized 95% CI falls below zero. k, GLP-1R snake plot created using gpcr.com summarizing the functional impact of missense variants; for residues with >1 variant, classification is applied as LoF2 > LoF1 > tolerated.
Fig. 3
Fig. 3. Deterioration of glucose homeostasis progressing into T2D and leading to complications in multiple organs and tissues.
Established (left, in peach) and new (right, in green). a, A human figure illustrating the main causes of hyperglycemia (a combination of lifestyle and genetic factors), and how hyperglycemia affects many organs and tissues. Complications on the left panel are well-established for T2D. Those on the right panel are emerging ones and are supported by our current analyses. Figure created with BioRender.com. b, DEPICT prioritization of 134 tissues from the GTEx Project highlights the ileum and pancreas (shown in red, one-sided empirical P value with FDR < 0.05 determined against randomized phenotypes in a null GWAS).
Fig. 4
Fig. 4. Cell type prioritization across 17 tissues identified large intestinal tissue ranked second only to pancreatic cell types.
CELLECT prioritization of 115 cell types from Tabula Muris highlights pancreatic polypeptide (PP) cells (shown in black, one-sided Wilcoxon rank-sum test with significance threshold depicted by a dotted line indicating cell types with a nominal PS-LDSC < 4.3 × 104).
Fig. 5
Fig. 5. Genome-wide genetic correlation between RG and a range of traits and diseases.
The x axis provides the estimated rg genetic correlation values for traits or diseases (y axis) reaching at least nominal significance (P < 0.05). Correlations reaching P < 0.010 are labeled with the prime symbol, and those P < 2.1 × 104 are labeled with the asterisk symbol. P values were calculated from the two-sided z statistics computed by dividing the estimated rg by the estimated standard error, without adjustment. Each error bar represents the standard error of the estimate.
Extended Data Fig. 1
Extended Data Fig. 1. RG trait models tested and sensitivity plots showing the correlations between association analyses beta coefficients and Z-scores from RG models in UKBB.
a, The models were labeled according to covariates included and RG cut-offs used. Individuals were included based on two RG cut-offs: <20 mmol/l to account for the effect of extreme RG values (20) and <11.1 mmol/l (11), which is an established threshold for T2D diagnosis. Hence, model 1 – AS20 refers to adjustment for age and sex, using a cut-off of <20 mmol/l, and so forth. b-e, For c, 4,138 individuals were excluded based on HbA1c ≥ 6.5%, in addition to the self-reported or diagnosed T2D cases. Variants with a heterogeneity P-value ≤ 0.05 (beta-coefficient plot) or a Z-score difference between the two models compared >3 (Z-score plots) are annotated. f, An enrichment plot showing the effect of RG signals (AS20 + AST20 model) on T2D. RG and T2D effect sizes are plotted along the y- and x-axes, respectively. Point size is proportional to the statistical significance of the variant for T2D, with red color indicating previously established signals and blue novel signals, respectively. The dashed line represents the line of best fit. Variants with T2D P-value in the lowest decile are labeled. g, An enrichment plot showing the effects of RG signals (AS20 + AST20 model) on HOMA-B and HOMA-IR. The effect sizes on HOMA-B and HOMA-IR are plotted along the y- and x-axes, respectively. Point size is proportional to the significance of the variant either in HOMA-B or HOMA-IR, depending on which trait has the smaller P value. Red color indicates previously established signals and blue indicates novel signals, respectively. Variants with suggestive significance (P < 5.0 × 10⁻⁶) are labeled.
Extended Data Fig. 2
Extended Data Fig. 2. Enrichment plots showing the effect of RG signals (AS20 + AST20 model) on glycemic and respiratory-related phenotypes.
a-i, Look-up of effects was done in previously published genome-wide association studies for HbA1c (a), fasting glucose (b), fasting insulin (c), type 2 diabetes (d), forced expiratory volume in one second (FEV1) (e), forced vital capacity (FVC) (f), FEV1/FVC (g), lung cancer (h) and squamous cell lung cancer (i). RG and other phenotype effect sizes are plotted along the y- and x-axes, respectively. Point size and color are proportional to the significance of the variant in each phenotype, with red indicating higher and blue lower significance, respectively. The dashed line represents the line of best fit. P < 5.0 × 10⁻⁸ was considered statistically significant after adjusting for multiple testing. Two-tailed P-values are reported. Variants with P-values in the lowest decile are labeled.
Extended Data Fig. 3
Extended Data Fig. 3. LocusZoom plots of common variants in UKBB (Europeans) meta-analysis for RG.
a-h, Plots are shown for GCKR (a), TET2 (b), RREB1 (c), NMT1 (d) and WIPI1 (e) loci and low-frequency coding variants at EDEM3 (f), NEUROD1 (g) and GLP1R (h) loci. The x-axis shows the chromosomal position, and the y-axis shows the uncorrected two-sided −log10 P values from the UKBB GWAS conducted using linear mixed-modeling in BOLT-LMM. Horizontal line corresponds to P = 5 × 10−8 and blue peaks show the recombination rate.
Extended Data Fig. 4
Extended Data Fig. 4. Association analysis of GLPR1 receptor function and random glucose effects of coding variants.
Minor allele frequency-weighted linear regression was used to test if mini-Gs response to GLP-1 stimulation significantly predicted point estimates of GLP1R variant effect on RG levels (AST20 βRG as estimated in whole-exome sequencing data from the UKBB study). Mini-Gs response to GLP-1 stimulation was corrected for variant surface expression (nmax = 22, exact n for each variant is provided in Supplementary Table 11). Error bars extend one standard error above and below the point estimate. Size of the dots is proportional to the weight applied in the regression model (Methods). The regression results (coefficient of determination R2 = 0.56, F(1, 14) = 20.1, P = 5.2 × 10⁻⁴) suggest that mini-Gs coupling in response to GLP-1 stimulation predicts the effect of these coding variants on RG levels (AST20 βRG = − 0.028; 95% CI = −0.042 to −0.015; P = 5.2 × 10⁻⁴). The gray shaded area around the regression line corresponds to the 95% confidence interval of predictions from the model. Variants in red showed no detectable surface expression (NDE) and are not included in regression analysis.
Extended Data Fig. 5
Extended Data Fig. 5. Epigenetic annotation of the RG GWAS results using GARFIELD.
The analyses were performed using generalized linear modeling in GARFIELD software. We considered enrichment to be statistically significant if the RG GWAS P-value reached P = 1 × 10⁻⁸ and the enrichment analysis P-value was < 2.5 × 10⁻⁵ (Bonferonni corrected for 2,040 annotations).
Extended Data Fig. 6
Extended Data Fig. 6. Cluster analysis of effects (as Z-scores) of the distinct 143 RG signals on 45 relevant phenotypes.
All variant effects were aligned to the RG risk allele. HapMap2 based summary statistics were imputed using SS-Imp v0.5.565 to minimize missingness. Missing summary statistics values were imputed via mean imputation. The heatmap was produced using the Pheatmap package. For visualization, the Z-scores were truncated to the value corresponding to genome-wide significance (Z = 5.45), and 11 phenotypes with the lowest median absolute Z-scores were excluded.
Extended Data Fig. 7
Extended Data Fig. 7. Scatter plots of the standardized allelic effect estimates for selected trait pairs.
In each scatter plot, loci were assigned to the groups defined from the cluster analysis and highlighted by different colors. a, Corrected insulin response (CIR) vs. type 2 diabetes (T2D) (clusters 1a/b related to metabolic syndrome). b, Glycated hemoglobin (HbA1c) vs. inflammatory bowel disease (IBD) (cluster 2a) highlights the effects of loci with a protective role in IBD. c, Plasminogen activator inhibitor-1 (PAI-1) vs. CIR (cluster 3) highlights loci linked to insulin secretion defects.

References

    1. Santos RL, et al. Heritability of fasting glucose levels in a young genetically isolated population. Diabetologia. 2006;49:667–672. doi: 10.1007/s00125-006-0142-6. - DOI - PubMed
    1. Almgren P, et al. Heritability and familiality of type 2 diabetes and related quantitative traits in the Botnia study. Diabetologia. 2011;54:2811–2819. doi: 10.1007/s00125-011-2267-5. - DOI - PubMed
    1. Scott RA, et al. An expanded genome-wide association study of type 2 diabetes in Europeans. Diabetes. 2017;66:2888–2902. doi: 10.2337/db16-1253. - DOI - PMC - PubMed
    1. Vujkovic M, et al. Discovery of 318 new risk loci for type 2 diabetes and related vascular outcomes among 1.4 million participants in a multi-ancestry meta-analysis. Nat. Genet. 2020;52:680–691. doi: 10.1038/s41588-020-0637-y. - DOI - PMC - PubMed
    1. Chen J, et al. The trans-ancestral genomic architecture of glycemic traits. Nat. Genet. 2021;53:840–860. doi: 10.1038/s41588-021-00852-9. - DOI - PMC - PubMed

Publication types