. 2023 Nov;7(11):1834-1843.
doi: 10.1038/s41559-023-02192-9. Epub 2023 Sep 7.

Host phylogeny shapes viral transmission networks in an island ecosystem

Collaborators, Affiliations

Host phylogeny shapes viral transmission networks in an island ecosystem

Rebecca K French et al. Nat Ecol Evol. 2023 Nov.

Abstract

Virus transmission between host species underpins disease emergence. Both host phylogenetic relatedness and aspects of their ecology, such as species interactions and predator-prey relationships, may govern rates and patterns of cross-species virus transmission and hence zoonotic risk. To address the impact of host phylogeny and ecology on virus diversity and evolution, we characterized the virome structure of a relatively isolated island ecological community in Fiordland, New Zealand, that are linked through a food web. We show that phylogenetic barriers that inhibited cross-species virus transmission occurred at the level of host phyla (between the Chordata, Arthropoda and Streptophyta) as well as at lower taxonomic levels. By contrast, host ecology, manifest as predator-prey interactions and diet, had a smaller influence on virome composition, especially at higher taxonomic levels. The virus-host community comprised a 'small world' network, in which hosts with a high diversity of viruses were more likely to acquire new viruses, and generalist viruses that infect multiple hosts were more likely to infect additional species compared to host specialist viruses. Such a highly connected ecological community increases the likelihood of cross-species virus transmission, particularly among closely related species, and suggests that host generalist viruses present the greatest risk of disease emergence.


Conflict of interest statement

The authors declare no competing interests.

Figures

Fig. 1
Fig. 1. Expected impact of two main drivers of virus diversity on the structure of virus phylogenies.
a, Host phylogenetic relationships drive virus diversity. b, Host feeding ecology drives virus diversity. Circles denote hypothetical clusters of hosts with similar viromes: that is, dots (hosts) within a circle have more viruses in common than to other dots outside the circle.
Fig. 2
Fig. 2. The similarity and dissimilarity of viral communities among host taxa.
The first two dimensions of a three-dimensional non-metric multidimensional scaling (NMDS) plot show that virus communities at the family level cluster according to host phyla. Axes refer to the dimensions of the NMDS; stress = 0.196, n = 49.
Fig. 3
Fig. 3. Host–virome network (bipartite) displayed using the Fruchterman–Reingold layout.
The modules are shown by node colour. Nodes include both host library and virus families. The boxes show the host makeup of each module, with the number of hosts belonging to each host phylum shown in parenthesis.
Fig. 4
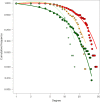
Fig. 4. The degree distribution of the host–virome network (large circles) and the null network (small squares), shown as the cumulative probability of finding a virus family in the network with k or less-associated hosts (Pc(k)).
The colour denotes node type, with red and orange referring to host nodes and the dark and light green the virus family nodes, in the host–virome network and null network, respectively.
Fig. 5
Fig. 5. Host community network (unipartite) displayed using the Fruchterman–Reingold layout.
Nodes are connected to other nodes if they have a dissimilarity value of less than 0.9. The thickness of the line shows the level of dissimilarity. The Bray–Curtis dissimilarity statistic ranges from 0 to 1, with 0 meaning two hosts have identical viromes at the viral family level, and 1 meaning two hosts have no viral families in common. The letters refer to species of interest: D, moss; G, grey warbler; K, kākāpō; M, mohua; S, Te Kakahu skink.
Fig. 6
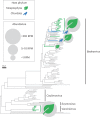
Fig. 6. Virus diversity at the species level.
Phylogeny of the Caulimoviridae (module 2). The colours and symbols correspond to host phyla: green leaf, Streptophyta; blue bird, Chordata. All unmarked viruses have plant hosts. The abundance of viruses in each phylum is shown in the key inset, expressed as RPM. Branches are scaled according to the number of amino acid substitutions per site, shown in the scale bar. The tree is midpoint rooted for display purposes only. Detailed individual phylogenies, sequence alignments and information including the genes used, alignment length, percentage identity and number of sequences can be found in Extended Data Figs. 2–5 and Supplementary Tables 6–7.
Extended Data Fig. 1
Extended Data Fig. 1. Map showing the location of Anchor Island, New Zealand.
Left panel. Map of New Zealand showing the location of the Fiordland National Park. Adapted from SVG > countries navigation earth international (https://svgsilh.com/image/1504059.html) and SVG > south map New Zealand (https://svgsilh.com/image/309892.html?fbclid=IwAR1-73KzelpNXlyG92T6BaUtX5SHSsFcfEWynGhXTswBw1uE79UHYQFSgFI). Top right panel. Google Earth picture of the Fiordland National Park, New Zealand showing the position of Anchor Island. Google Earth citation provided in the picture. Photograph of Anchor Island taken by Dr. Rebecca French.
Extended Data Fig. 2
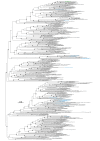
Extended Data Fig. 2. Phylogenetic tree of the Parvoviridae based on the non-structural protein 1 gene (alignment length 584 amino acids) (related to Fig. 6).
The colours correspond to host phyla, blue = Chordata, red = Arthropoda, pink = Annelida. Viruses from this study are labelled with their phylum and host common name (see Supplementary Table 1 for details on each host). Branches are scaled according to the number of amino acid substitutions per site, shown in the scale bar. Black circles on nodes show bootstrap support values of more than 90%. The tree is midpoint rooted for display purposes only.
Extended Data Fig. 3
Extended Data Fig. 3. Phylogenetic tree of the Caulimoviridae based on the polyprotein gene (alignment length 938 amino acids) (related to Fig. 6).
The colours correspond to host phyla, green = Streptophyta, blue = Chordata. Viruses from this study are labelled with their phylum and host common name (see Supplementary Table 1 for details on each host). Branches are scaled according to the number of amino acid substitutions per site, shown in the scale bar. Black circles on nodes show bootstrap support values of more than 90%. The tree is midpoint rooted for display purposes only.
Extended Data Fig. 4
Extended Data Fig. 4. Phylogenetic tree of the Fiersviridae based on the RNA-dependent RNA polymerase gene (alignment length 453 amino acids) (related to Fig. 6).
The colours correspond to host phyla, green = Streptophyta, blue = Chordata. Viruses from this study are labelled with their phylum and host common name (see Supplementary Table 1 for details on each host). Branches are scaled according to the number of amino acid substitutions per site, shown in the scale bar. Black circles on nodes show bootstrap support values of more than 90%. The tree is midpoint rooted for display purposes only.
Extended Data Fig. 5
Extended Data Fig. 5. Phylogenetic tree of the Caliciviridae based on the polyprotein gene (alignment length 1313 amino acids) (related to Fig. 6).
The colours correspond to host phyla, red = Arthropoda, blue = Chordata. Viruses from this study are labelled with their phylum and host common name (see Supplementary Table 1 for details on each host). Branches are scaled according to the number of amino acid substitutions per site, shown in the scale bar. Black circles on nodes show bootstrap support values of more than 90%. The tree is midpoint rooted for display purposes only.

References

    1. Geoghegan JL, Duchêne S, Holmes EC. Comparative analysis estimates the relative frequencies of co-divergence and cross-species transmission within viral families. PLoS Pathog. 2017;13:e1006215. doi: 10.1371/journal.ppat.1006215. - DOI - PMC - PubMed
    1. Zhang Y-Z, Chen Y-M, Wang W, Qin X-C, Holmes EC. Expanding the RNA virosphere by unbiased metagenomics. Annu. Rev. Virol. 2019;6:119–139. doi: 10.1146/annurev-virology-092818-015851. - DOI - PubMed
    1. Holmes EC. The ecology of viral emergence. Annu. Rev. Virol. 2022;9:173–192. doi: 10.1146/annurev-virology-100120-015057. - DOI - PubMed
    1. French RK, Holmes EC. An ecosystems perspective on virus evolution and emergence. Trends Microbiol. 2020;28:165–175. doi: 10.1016/j.tim.2019.10.010. - DOI - PubMed
    1. Streicker DG, et al. Host phylogeny constrains cross-species emergence and establishment of rabies virus in bats. Science. 2010;329:676–679. doi: 10.1126/science.1188836. - DOI - PubMed