. 2024 Jan;20(1):93-102.
doi: 10.1038/s41589-023-01409-z. Epub 2023 Sep 7.

Design principles for cyclin K molecular glue degraders

Affiliations

Design principles for cyclin K molecular glue degraders

Zuzanna Kozicka et al. Nat Chem Biol. 2024 Jan.

Abstract

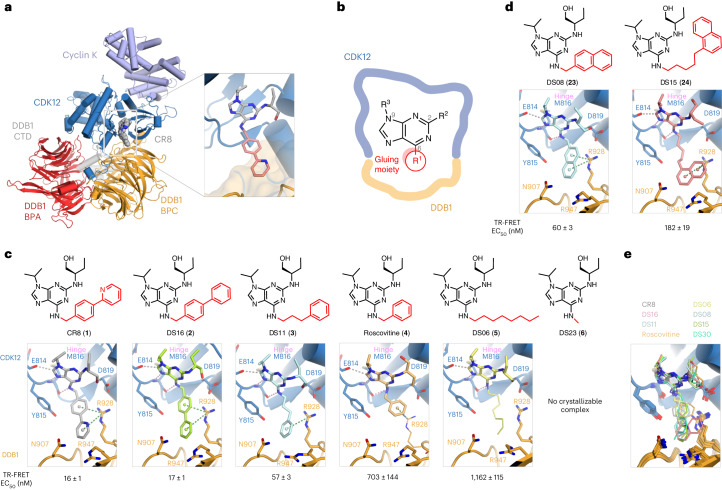
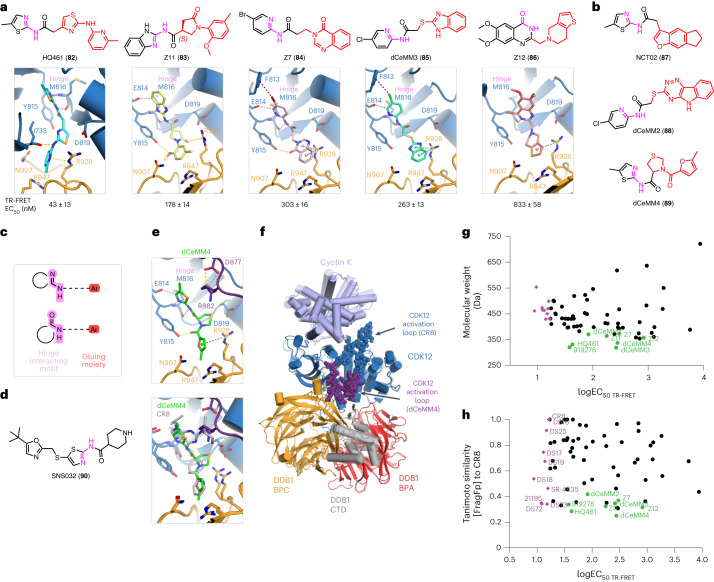
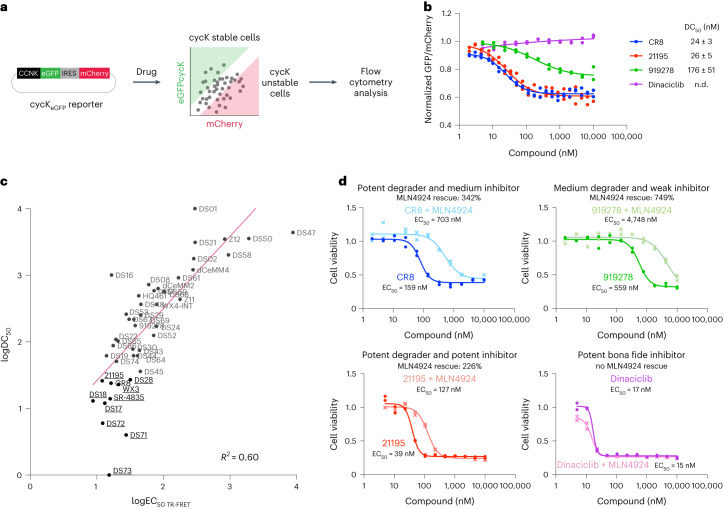
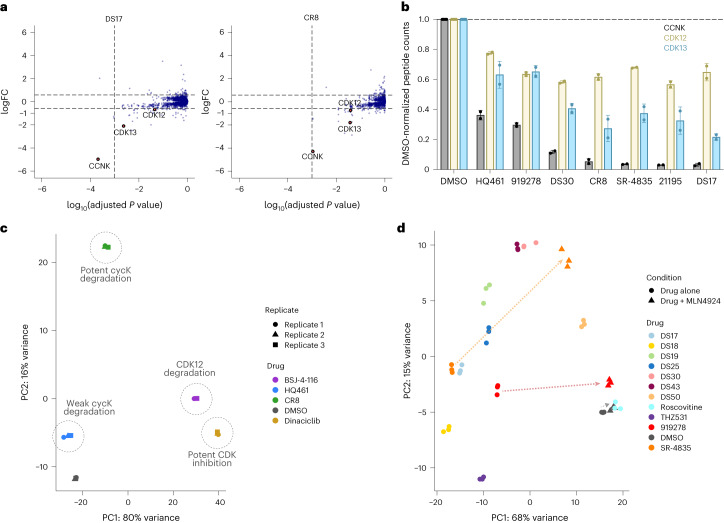
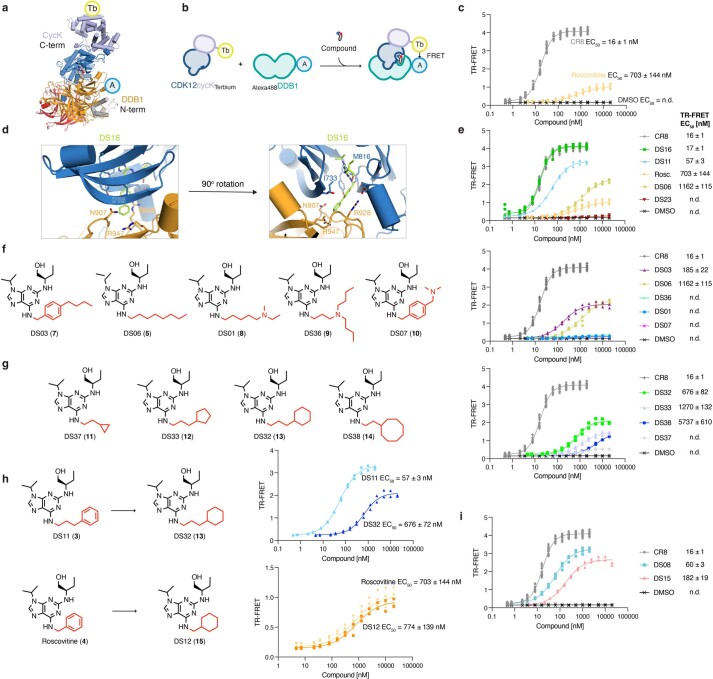
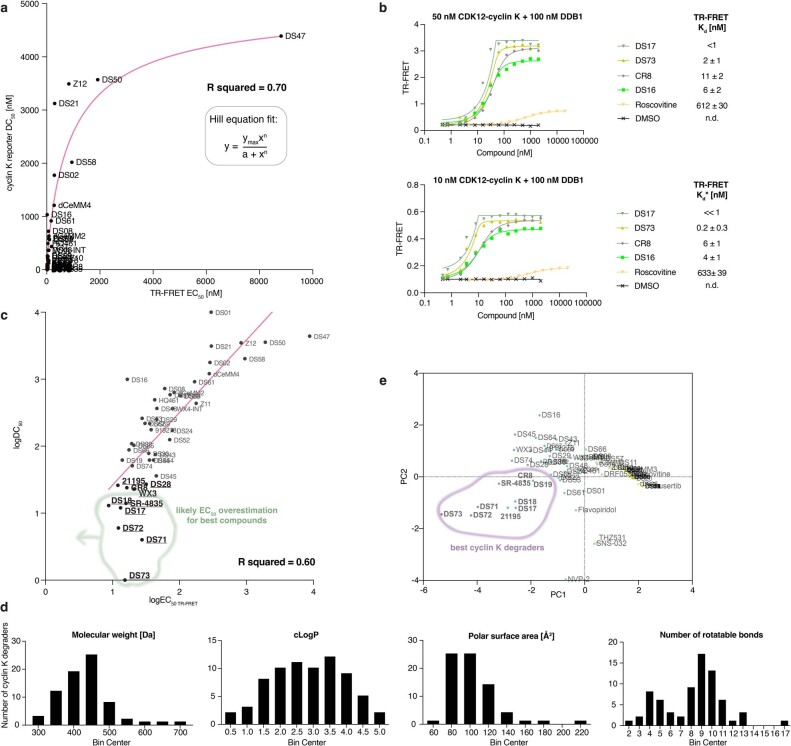
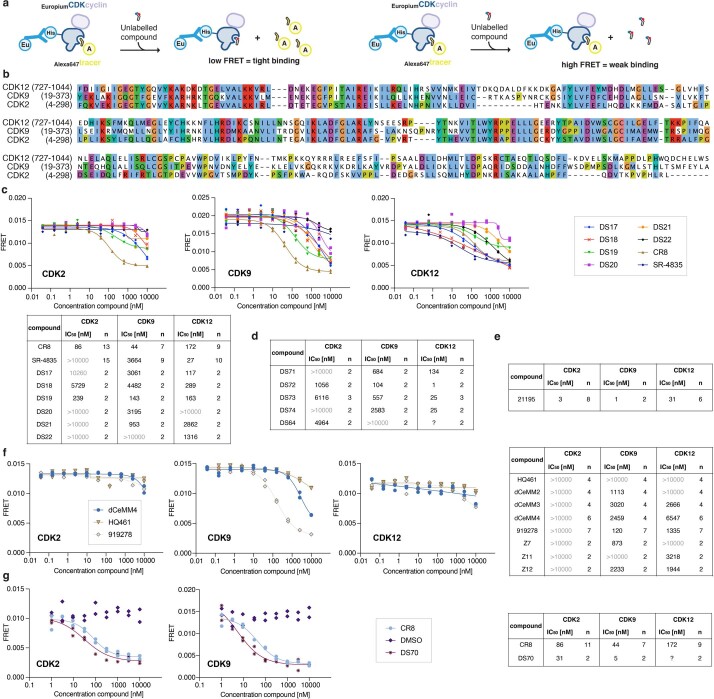
Molecular glue degraders are an effective therapeutic modality, but their design principles are not well understood. Recently, several unexpectedly diverse compounds were reported to deplete cyclin K by linking CDK12-cyclin K to the DDB1-CUL4-RBX1 E3 ligase. Here, to investigate how chemically dissimilar small molecules trigger cyclin K degradation, we evaluated 91 candidate degraders in structural, biophysical and cellular studies and reveal all compounds acquire glue activity via simultaneous CDK12 binding and engagement of DDB1 interfacial residues, in particular Arg928. While we identify multiple published kinase inhibitors as cryptic degraders, we also show that these glues do not require pronounced inhibitory properties for activity and that the relative degree of CDK12 inhibition versus cyclin K degradation is tuneable. We further demonstrate cyclin K degraders have transcriptional signatures distinct from CDK12 inhibitors, thereby offering unique therapeutic opportunities. The systematic structure-activity relationship analysis presented herein provides a conceptual framework for rational molecular glue design.


Conflict of interest statement

N.H.T. receives funding from the Novartis Research Foundation and is a scientific advisory board (SAB) member of Monte Rosa Therapeutics and an advisor to Zenith Therapeutics and Ridgeline. B.L.E. has received research funding from Celgene, Deerfield, Novartis and Calico. He has received consulting fees from GRAIL, and he serves on the SABs for and holds equity in Neomorph, TenSixteen Bio, Skyhawk Therapeutics and Exo Therapeutics. E.S.F. is a founder, SAB member and equity holder of Civetta Therapeutics, Lighthorse Therapeutics, Proximity Therapeutics and Neomorph, Inc. (board member). E.S.F. is an equity holder and SAB member for Avilar Therapeutics, Ajax Therapeutics and Photys Therapeutics and a consultant to Novartis, Sanofi, EcoR1 Capital, Odyssey, Astellas and Deerfield. The Fischer lab receives or has received research funding from Novartis, Ajax, Voronoi, Interline, Deerfield and Astellas. D.G. is an SAB member of FoRx therapeutics. The C.M.-R. lab receives research funding from Almirall and Aelin Tx, and C.M.-R. is an SAB member of Nostrum Biodiscovery. G.E.W. is scientific founder and shareholder of Proxygen and Solgate, the Winter laboratory receives research funding from Pfizer. M.S. has received research funding from Calico Life Sciences LLC. G.P. is now an employee of Monte Rosa Therapeutics. C.D.G. is now an employee of VantAI. The remaining authors declare no competing interests.

Figures

Fig. 1
Fig. 1. Modifications of the CR8 scaffold preserve its molecular glue activity.
a, Crystal structure of the DDB1–CR8–CDK12–cyclin K complex (PDB: 6TD3) (ref. ). The zoomed panel depicts the binding mode of CR8, with the phenylpyridine moiety (gluing moiety; pale red) engaging DDB1 (surface representation). b, Chemical structure of the 2,6,9-trisubstituted purine core. The R1 group is referred to as the gluing moiety and shown in red throughout. c, Chemical structures of CR8, DS16, DS11, roscovitine, DS06, DS23 and ternary complex crystal structures of the DDB1–CDK12 interfaces induced by those compounds, listed from best to worst binder, and their associated TR-FRET EC50 values. Corresponding TR-FRET curves can be found in Extended Data Fig. 1e. d, Chemical structures of DS08 and DS15 and ternary complex crystal structures of interfaces induced by those compounds. Corresponding TR-FRET curves can be found in Extended Data Fig. 1i. e, Overlay of ternary complex structures from c and d. In c and d, interactions are represented by dashed lines. Hydrogen bonds to the hinge region are shown in pink, other hydrogen bonds in yellow, aromatic H-bonds in gray, and π–cation interactions in green. Regions with no unambiguous FoFc density at 1σ are displayed with a smaller stick radius. Density maps, omit maps and interaction distances can be found in Supplementary Figs. 1–3.
Fig. 2
Fig. 2. Published CDK inhibitors have cryptic molecular glue activity.
a, Chemical structure of SR-4835 and ternary complex crystal structure of the DDB1–CDK12 interface induced by the compound. b, Chemical structures of CR8/SR-4835 hybrid compounds and ternary complex crystal structures of the DDB1–CDK12 interfaces induced by DS17, DS18, DS19 and DS22. c, Chemical structure of 21195 and ternary complex crystal structure of the DDB1–CDK12 interface induced by the compound. d, Chemical structure of 919278 and ternary complex crystal structure of the DDB1–CDK12 interface induced by the compound. In ad, interactions are represented by dashed lines. Hinge hydrogen bonds are shown in pink, other hydrogen bonds in yellow, aromatic H-bonds in gray, π–cation interactions in green, π–π interactions in cyan and halogen bonds in purple. Density maps, omit maps and interaction distances can be found in Supplementary Figs. 1–3.
Fig. 3
Fig. 3. Low-molecular-weight cyclin K glues.
a, Chemical structures of HQ461, Z11, Z7, dCeMM3 and Z12 and ternary complex crystal structures of the DDB1–CDK12 interfaces induced by each compound. HQ461 could in theory bind at the interface in two directions (see fingerprint in c), yet the density, while somewhat ambiguous, suggests the methylpyridine moiety points towards DDB1. b, Chemical structures of NCT02, dCeMM2 and dCeMM4, which are cyclin K degraders. c, The fingerprint of a cyclin K degrader. d, Chemical structure of SNS032, which is not a cyclin K degrader despite binding CDK12. e, Ternary complex crystal structure with dCeMM4 (top) and overlay of dCeMM4 and CR8 (bottom). f, DDB1–CDK12–cyclin K complex architecture, with a conformational change in a CDK12 activation loop (spheres) induced by dCeMM4. While a closed-loop kinase conformation is often associated with an inactive kinase state whereby the Asp–Phe–Gly (DFG) motif flips, here no DFG flip was observed. g, Diversity of cyclin K degraders illustrated through a plot of the compounds’ molecular weight and their ternary complex formation affinity. The ten compounds most active in vitro are shown in purple and the low-molecular-weight cyclin K degraders described above are colored green. h, As in g but showing the compounds’ Tanimoto similarity to CR8 and their ternary complex formation affinity. a,e, Interactions are represented by dashed lines. Hinge hydrogen bonds are shown in pink, other hydrogen bonds in yellow, aromatic H-bonds in gray, π–cation interactions in green and halogen bonds in purple. Regions with no unambiguous FoFc density at 1σ are displayed with a smaller stick radius. Density maps, omit maps and interaction distances can be found in Supplementary Figs. 1–3. Source data
Fig. 4
Fig. 4. Cellular evaluation of cyclin K molecular glue degraders.
a, Schematic of the cyclin K dual-color reporter assay. b, HEK293T cycKeGFP reporter assay results for four example compounds. Individual replicates are shown (n = 2); n.d., not determined. Data for all compounds can be found in Supplementary Fig. 4. c, Correlation of in vitro complex formation affinity (logEC50 TR-FRET) and cycKeGFP reporter results (logDC50) modeled with a linear regression (R2 = 0.60). The in vitro TR-FRET EC50 values for the best compounds (bold) are overestimated, which negatively impacts the correlation. The equivalent plot in linear scale is shown in Extended Data Fig. 6a. d, Viability assay in HEK293T cells for four example compounds, with curves corresponding to treatment with the individual drug or additional pretreatment with 100 nM of the neddylation inhibitor MLN4924. Individual replicates are shown (n = 2). Data for all compounds can be found in Supplementary Fig. 5. Source data
Fig. 5
Fig. 5. Diverse cyclin K molecular glue degraders give rise to unique cellular responses.
a, MDA-MB-231 cells were exposed to 1 µM DS17, CR8 or DMSO for 5 h followed by whole proteome quantification using label-free mass spectrometry (mean log2 fold change, P value calculated by a moderated t-test, n = 4 (DMSO), n = 2 (DS17 and CR8)). b, Representation of the average peptide counts of cyclin K (dark gray), CDK12 (yellow) and CDK13 (blue). Data represent the mean ± standard deviation (n = 4 for DMSO and n = 2 for each compound treatment). The corresponding volcano plots can be found in Extended Data Fig. 7a. c, PCA of the RNA-seq data for CR8, BSJ-4-116, dinaciclib, HQ461 and DMSO (n = 3). d, PCA analysis of the RNA-seq data for a larger selection of compounds (n = 3). For 919278 and SR-4835, two conditions were assessed: compound alone (circle) or compound + MLN4924 (triangle). Co-treatment with the neddylation inhibitor resulted in large shifts of the resulting points (dashed arrows). In c and d, the corresponding volcano plots can be found in Extended Data Fig. 9. Source data
Extended Data Fig. 1
Extended Data Fig. 1. Mapping of interfacial pocket dimensions and key interactions with CR8 derivative series.
a, Fluorescent label positions chosen for the optimized TR-FRET assay. b, Schematic of the compound titration used for ternary complex formation assessment. c, Optimized in vitro TR-FRET complex formation assay for CR8 and roscovitine reveals a large difference in activity (much larger than previously reported) between the two compounds in accordance with the lack of cyclin K degradation activity of roscovitine in cells. The assay is therefore an appropriately sensitive readout for the evaluation of closely related compounds. d, CDK12 loop (a.a. 731-743) that encloses the active site, with the Ile733 sidechain oriented towards the compound. This loop is omitted from most figure panels for clarity. e, In vitro TR-FRET complex formation assay for compound shown in Fig. 1c. f, Chemical structures of a series of derivatives bearing aliphatic chains at the R1 position listed from best to worst binder (left). In vitro TR-FRET complex formation assay for these compounds (right). g, Chemical structures of a series of derivatives bearing saturated rings at the R1 position listed from best to worst binder (left). In vitro TR-FRET complex formation assay for these compounds (right). h, The impact of aromaticity on ternary complex formation. Chemical structures of two aromatic-aliphatic pairs and the associated in vitro TR-FRET compound titration results. i, In vitro TR-FRET complex formation assay for compounds shown in Fig. 1d. Crystal structures with compounds DS08 and DS15 are displayed in Fig. 1e. (c, e-i) Individual replicates are shown (n = 17 for CR8; n = 4 for DS06, DS08, roscovitine; n = 2 for others). Source data
Extended Data Fig. 2
Extended Data Fig. 2. Miscellaneous modifications of CR8-like scaffolds.
a, Chemical structures of a series of derivatives bearing an alkyl phenyl R1 group with the alkyl linker varying in length listed from best to worst binder (left). In vitro TR-FRET complex formation assay for the compounds shown (right). b, Chemical structures of several derivatives containing fused or multiple rings listed from best to worst binder (left). In vitro TR-FRET complex formation assay for the compounds shown (right). c, Chemical structures of various CR8 derivatives listed from best to worst binder (left). In vitro TR-FRET complex formation assay for these compounds (right). d, Ternary complex crystal structure with DS43. e, Chemical structures of derivatives bearing heterocyclic gluing moieties listed from best to worst binder. f, In vitro TR-FRET complex formation assay for compounds shown in (e). g, Chemical structures of several compounds derived from simple modifications of the simplified CR8-like scaffold DS11 listed from best to worst binder. h, In vitro TR-FRET complex formation assay for compounds shown in (g). i, Crystal structure of the ternary complex formed with DS30 (chemical structure in (g)) (left) and overlay of the binding mode of DS11 and DS30 (right). (a-c, f, h) Individual replicates are shown (n = 17 for CR8; n = 4 for DS08, DS30, DS66, roscovitine; n = 2 for others). (d, i) Interactions are represented by dashed lines. Hinge hydrogen bonds are shown in pink, aromatic H-bonds in grey, other hydrogen bonds in yellow, and π-cation interactions in green. Source data
Extended Data Fig. 3
Extended Data Fig. 3. Other modifications of R1 and R2 groups.
a, Chemical structures of CR8 derivatives where the location of the phenylpyridine nitrogen is varied, listed from best to worst binder. b, In vitro TR-FRET complex formation assay for compounds shown in (a), DMSO, and CR8. c, Chemical structures of CR8 derivatives. TR-FRET curves can be found in Extended Data Fig. 2c. d, Structures of interfaces induced by WX3 and DS24. e, Chemical structures of derivatives with various R2 substituents, for example inspired by SR-4835 (DS19), dinaciclib (DS70) or 21195 (DS48). f, In vitro TR-FRET complex formation assay for compounds shown in (e). g, Chemical structures of compounds obtained through R-group docking at the R2 position, displayed from best to worst binder. h, In vitro TR-FRET complex formation assay for compounds shown in (g). i, Crystal structure of the ternary complex formed with DS59. Interactions are represented by dashed lines. Hinge hydrogen bonds are shown in pink, aromatic H-bonds in grey, and π-cation interactions in green. Possible π-cation interactions between the diazole and proximal CDK12 lysine residues (K756, K861) were omitted for clarity. j, Crystal structure of the ternary complex formed with DS50. The R1 and R2 substituents could not be unambiguously fit into the density and were set to zero occupancy and are displayed with a smaller stick radius. Two probable conformations are shown. (b, f, h) Individual replicates are shown (n = 17 for CR8; n = 4 for DS28, DS44, DS53, DS59; n = 2 for others). Source data
Extended Data Fig. 4
Extended Data Fig. 4. Evaluation of known compounds and their derivatives for cryptic molecular glue activity.
a, In vitro TR-FRET complex formation assay for various CDK12 inhibitors. b, Crystal structure of the ternary complex formed with DRF053 and the chemical structure of DRF053. c, In vitro TR-FRET complex formation assay with other CDK inhibitors. d, In vitro TR-FRET complex formation assay for SR-4835 (structure in Fig. 2a). e, SR-4835 induces conformational changes in the N-lobe of CDK12 as compared to CR8. The CR8-bound structure is shown with 50% transparency. f, Multiple sequence alignment of human CDKs highlighting a unique tyrosine residue in CDK12/13 (CDK12 Tyr815). g, Chemical structures of SR-4835 derivatives, displayed from best to worst binder (left). In vitro TR-FRET complex formation assay for these compounds (right). h, Crystal structure of the ternary complex formed with DS55. i, In vitro TR-FRET complex formation assay for DS17-22 (structures in Fig. 2d). j, Chemical structures of compounds disclosed in patent WO2021116178 and derivative DS64 bearing a related gluing moiety, listed from best to worst binder. Purine scaffold hopping is emphasized with a green highlight. k, In vitro TR-FRET complex formation assay for compounds shown in (j). (a, c, d, g, i, k) Individual replicates are shown (n = 17 for CR8; n = 4 for SR-4835, DS17, DS18, DS72, DS74; n = 2 for others). (b, h) Regions with no unambiguous Fo-Fc density at 1σ are displayed with a smaller stick radius. Source data
Extended Data Fig. 5
Extended Data Fig. 5. Hydrophilic and small compounds highlight cyclin K degrader diversity.
a, In vitro TR-FRET complex formation assay for 21195 (structure in Fig. 2c). (b-f) Examples of the impact of increasing the hydrophilicity of the gluing moiety on multiple scaffolds including the relevant chemical structures and the associated in vitro TR-FRET compound titration results. b, DS06 and DS13. c, DS11 and DS68. d, DS08 and DS14. e, DS09 and DS40. f, DS55 and DS54. g, Chemical structures of 21195 and compounds resulting from hybridization of CR8 and SR-4835 with this inhibitor, listed from best to worst binder. h, In vitro TR-FRET complex formation assay for compounds shown in (f). i, Crystal structure of the ternary complex formed with DS61 (left) and the overlay of complexes induced by DS61, 21195, and CR8 (right). Interactions are represented by dashed lines. Hinge hydrogen bonds are shown in pink, other hydrogen bonds in yellow, aromatic H-bonds in grey, and π-cation interactions in green. j, In vitro TR-FRET complex formation assay for compounds shown in Fig. 2d and Fig. 3a-e. (a-f, h, j) Individual replicates are shown (n = 17 for CR8; n = 4 for DS06, DS08, 21195, SR-4835, dCeMM2, dCeMM4, Z7, Z11, HQ461; n = 2 for other compounds). Source data
Extended Data Fig. 6
Extended Data Fig. 6. Further characterisation of molecular glue degrader compounds.
a, Correlation of in vitro assay data (TR-FRET EC50 [nM]) with cellular cyclin KeGFP reporter assay results (DC50 [nM]), based only on compounds with unambiguous activity in the reporter assay (n = 42). The relationship can be described with a Hill equation (R squared = 0.70), with the equation used solely to describe the mathematical relationship between the two experimental datasets and not for its biological meaning. b, In vitro TR-FRET complex formation assay performed as a compound titration with 50 nM CDK12-cyclin K (left) or 10 nM CDK12-cyclin K (right) for several compounds (n = 1). Data were fitted with a quadratic equation appropriate for a case where the expected Kd value is lower than the protein concentration used. Lowering the protein concentration resulted in a much smaller assay window but yielded Kd* values in the sub-nanomolar range for the top compounds (DS17, DS73), while showing no difference for the weak recruiter roscovitine, indicating that the tightest glues lie below the limit of detection of the TR-FRET assay (this is also highlighted by the spurious fit observed for DS17). c, Correlation of in vitro complex formation affinity (logEC50 TR-FRET) and cycKeGFP reporter results (logDC50) modelled with a linear regression (R squared = 0.60). The in vitro TR-FRET values for the best compounds (bold) are overestimated and the green cloud indicates how the data points would be predicted to shift upon accurate affinity quantification, further improving the observed correlation (c.f. panel b). d, Histograms displaying the molecular weight, clogP, polar surface area, and the number or rotatable bonds distributions across the cyclin K degrader compound set. e, PCA of the combined multi-assay data for cyclin K degraders. Source data
Extended Data Fig. 7
Extended Data Fig. 7. Proteomics reveal large differences in the extent of cyclin K depletion.
a, Label-free proteomics. Mean log2 fold change, p value calculated by a moderated t-test; n = 4 (DMSO), n = 2 (21195, SR-4835, DS30, 919278, and HQ461). MDA-MB-231 cells were treated with 1 µM drug for 5 h. b, Correlation of the average cyclin K peptide count with the TR-FRET EC50 (left) or with the cyclin KeGFP reporter DC50 (right). Source data
Extended Data Fig. 8
Extended Data Fig. 8. Cyclin K degraders do not require traditional kinase inhibitory properties for activity.
a, Commercial in vitro Lanthascreen assay. The binding of an Alexa647-conjugated tracer to a kinase is detected by addition of an Eu-labelled anti-tag antibody. Binding of the tracer and antibody to a kinase yields a high TR-FRET signal, while tracer displacement with a kinase inhibitor results in signal loss. b, Multiple sequence alignment of CDK12, CDK9, and CDK2, omitting the C-terminal extension of CDK12. c, Selectivity profiling of CR8/SR-4835 hybrid compounds across CDK2/9/12 using Lanthascreen. Representative TR-FRET curves (n = 2) (top) and a table listing average IC50 values and total number (n) of measurements (bottom). d, Selectivity profiling results for compounds derived from a recent patent and related derivatives. e, Selectivity profiling of compound 21195. f, Representative TR-FRET curves (n = 2) (left) and a table listing average IC50 values and total number (n) of measurements (right) for low molecular weight cyclin K degraders. g, Representative TR-FRET curves (n = 2) (left) and a table listing average IC50 values and total number (n) of measurements (right) for CR8 and DS70, a hybrid of CR8 and dinaciclib bearing the hydroxyethyl piperidine functionality present in this potent CDK inhibitor. DS70 shows more pronounced pan-CDK engagement than CR8. (c-g) Additional replicates and further data can be found in Supplementary Fig. 6. Source data
Extended Data Fig. 9
Extended Data Fig. 9. RNA sequencing reveals distinct transcriptional signatures for CDK12 inhibition, CDK12 degradation, and cyclin K degradation.
a, Cyclin K reporter degradation assay (n = 2) (top). In vitro TR-FRET complex formation assay (bottom) showing no cyclin K molecular glue degrader activity for the CDK12 PROTAC BSJ-4-116 (n = 2 for BSJ-4-116, n = 17 for CR8). b, Volcano plots depicting the RNAseq results for CR8 (cyclin K degrader), BSJ-4-116 (CDK12 degrader), and dinaciclib (CDK inhibitor) (n = 3). c, Volcano plots showing the RNAseq results for 919278 and SR-4835, either alone or in combination with the neddylation inhibitor MLN4924 (n = 3). Source data

Similar articles

Cited by

References

    1. Giordanetto F, Schäfer A, Ottmann C. Stabilization of protein–protein interactions by small molecules. Drug Discov. Today. 2014;19:1812–1821. doi: 10.1016/j.drudis.2014.08.005. - DOI - PubMed
    1. Scott DE, Bayly AR, Abell C, Skidmore J. Small molecules, big targets: drug discovery faces the protein-protein interaction challenge. Nat. Rev. Drug Discov. 2016;15:533–550. doi: 10.1038/nrd.2016.29. - DOI - PubMed
    1. Békés M, Langley DR, Crews CM. PROTAC targeted protein degraders: the past is prologue. Nat. Rev. Drug Discov. 2022;21:181–200. doi: 10.1038/s41573-021-00371-6. - DOI - PMC - PubMed
    1. Cowan, A. D. & Ciulli, A. Driving E3 ligase substrate specificity for targeted protein degradation: lessons from nature and the laboratory. Annu. Rev. Biochem. 10.1146/annurev-biochem-032620-104421 (2022). - PubMed
    1. Mullard A. Targeted protein degraders crowd into the clinic. Nat. Rev. Drug Discov. 2021;20:247–250. doi: 10.1038/d41573-021-00052-4. - DOI - PubMed

Publication types

MeSH terms