. 2024 Jul;42(7):1133-1149.
doi: 10.1038/s41587-023-01934-1. Epub 2023 Sep 7.

Multi-omics data integration using ratio-based quantitative profiling with Quartet reference materials

Affiliations

Multi-omics data integration using ratio-based quantitative profiling with Quartet reference materials

Yuanting Zheng et al. Nat Biotechnol. 2024 Jul.

Abstract

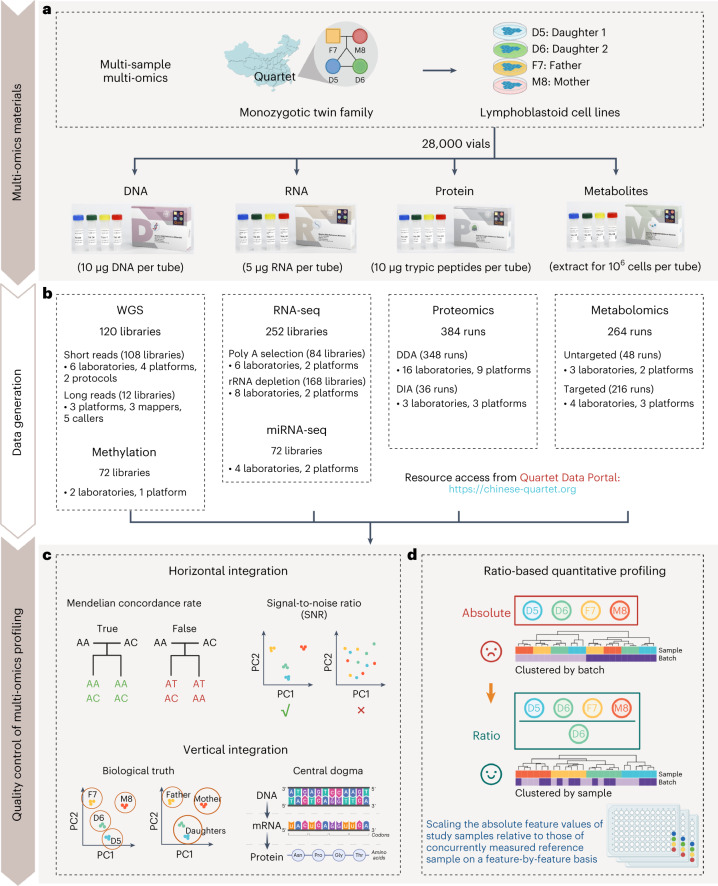
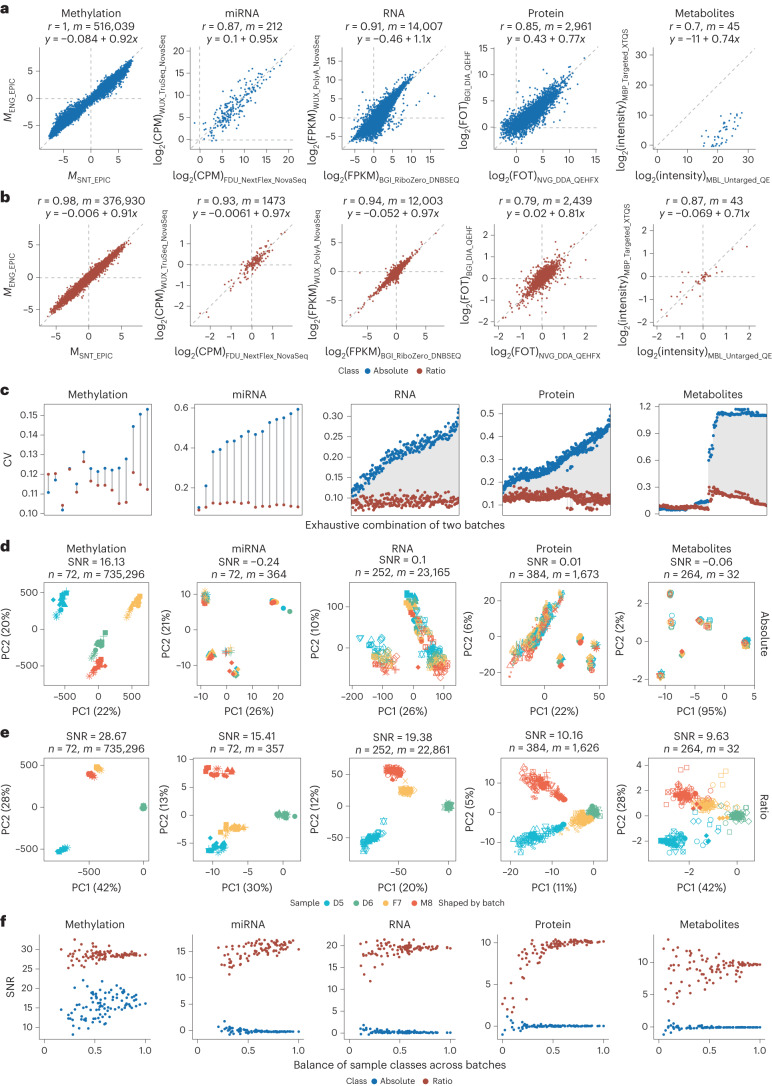
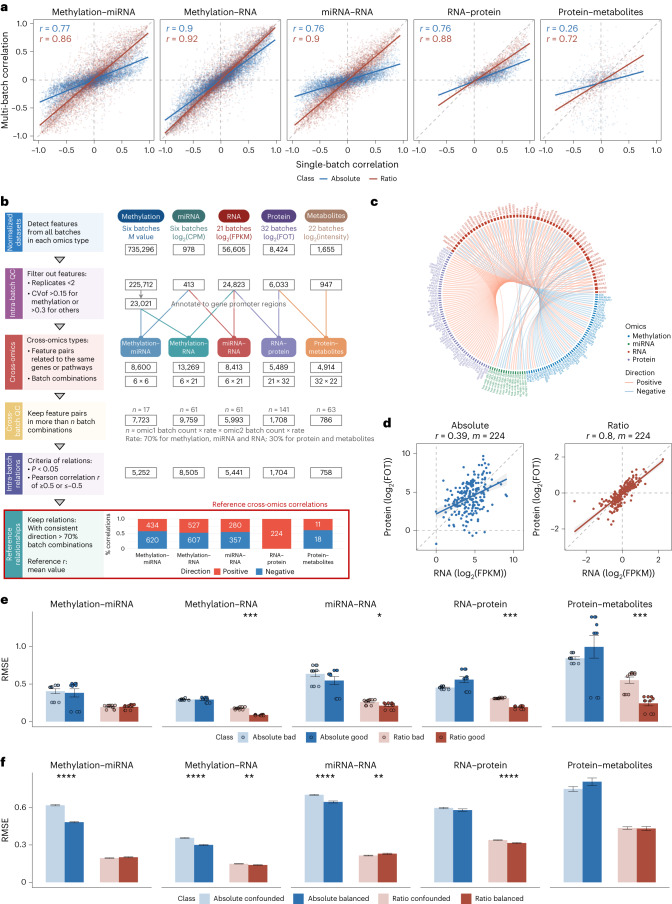
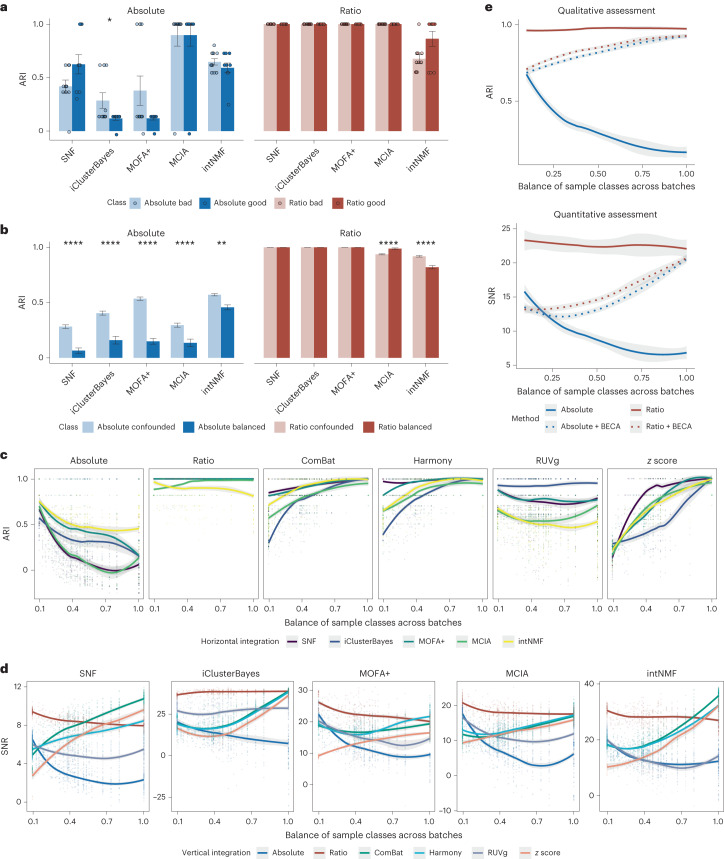
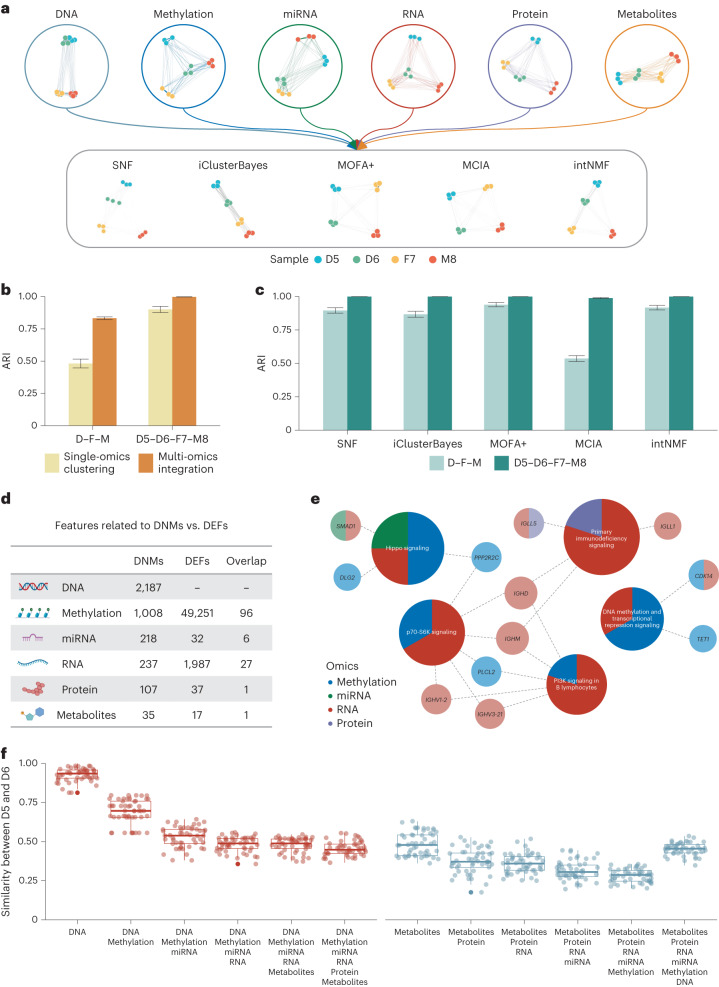
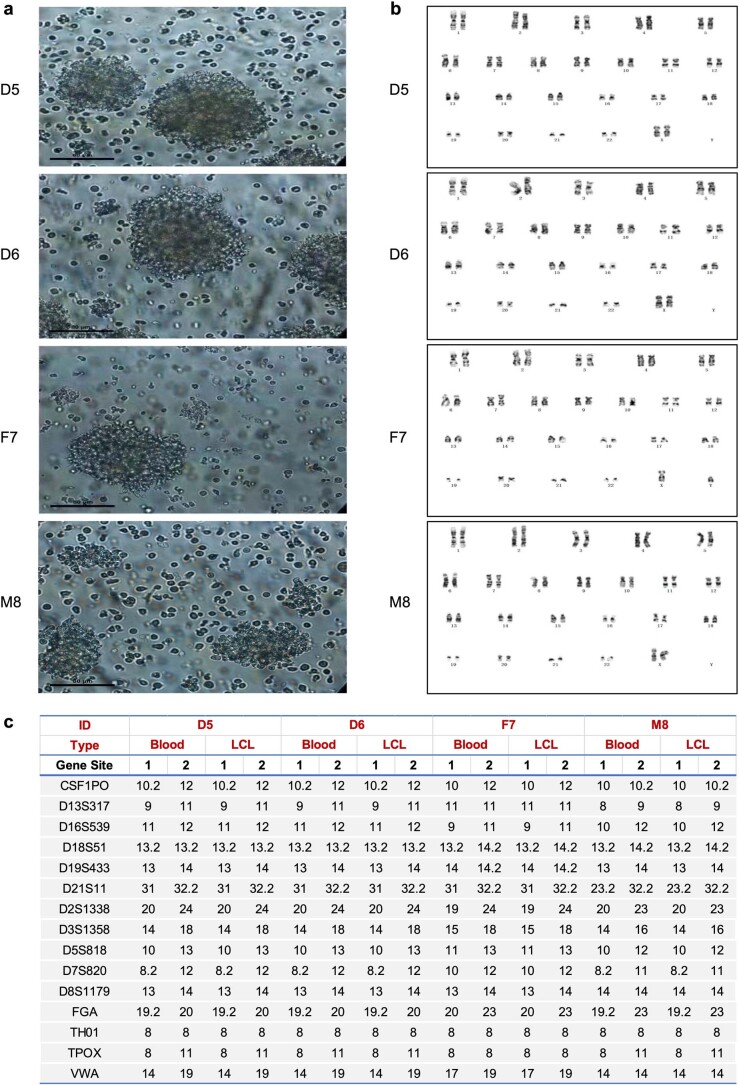
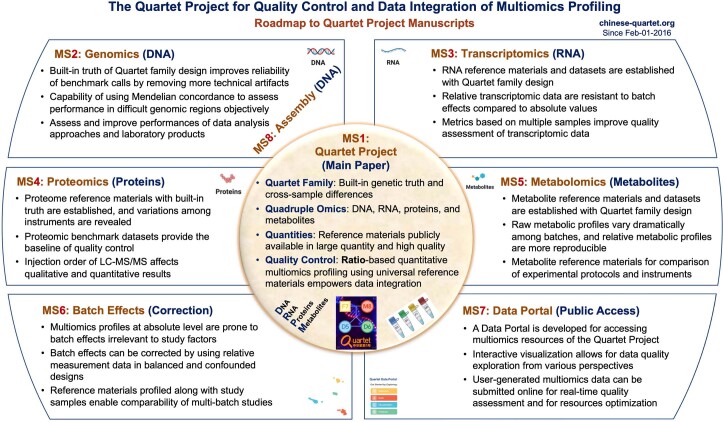
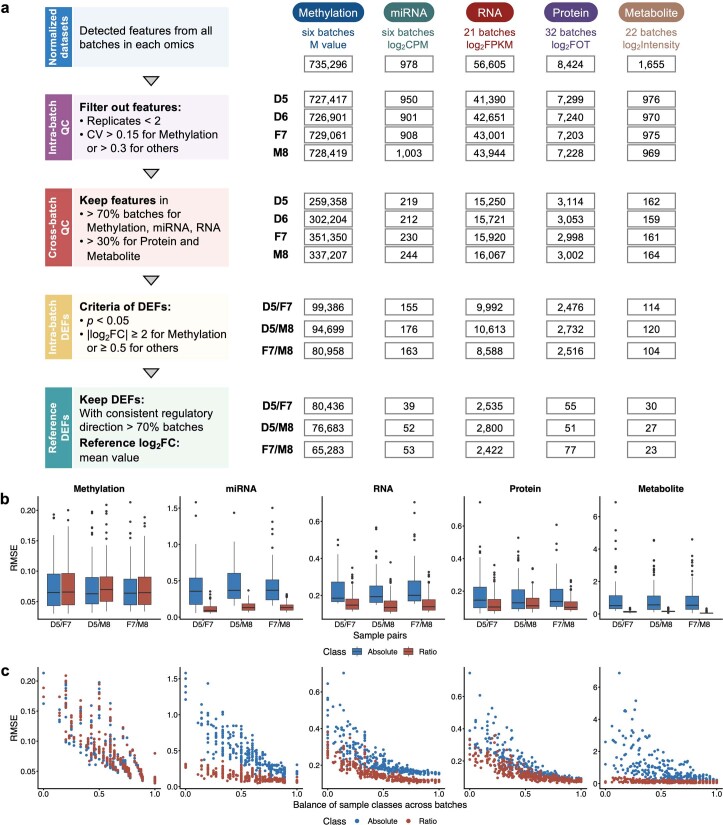
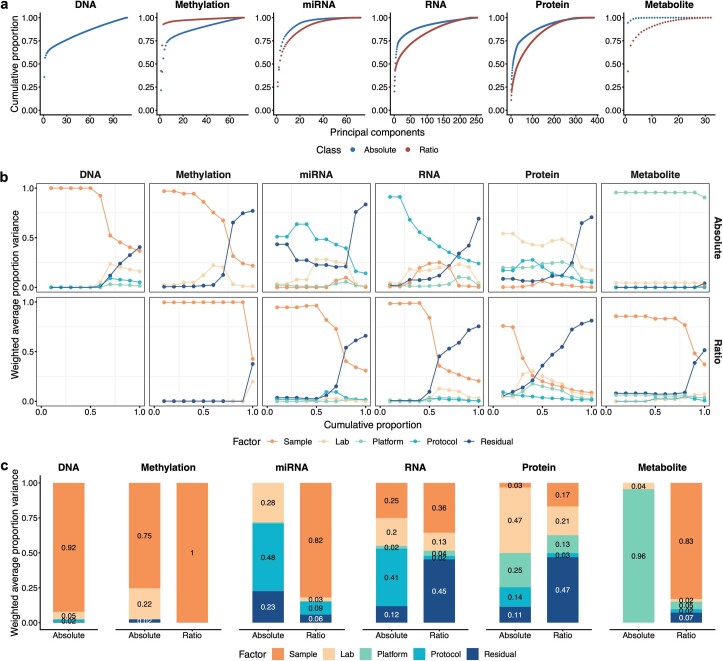
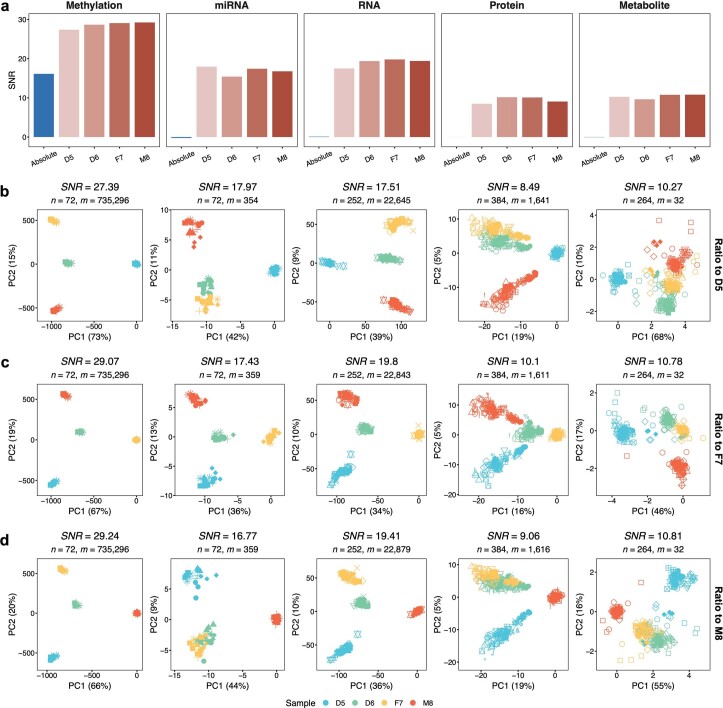
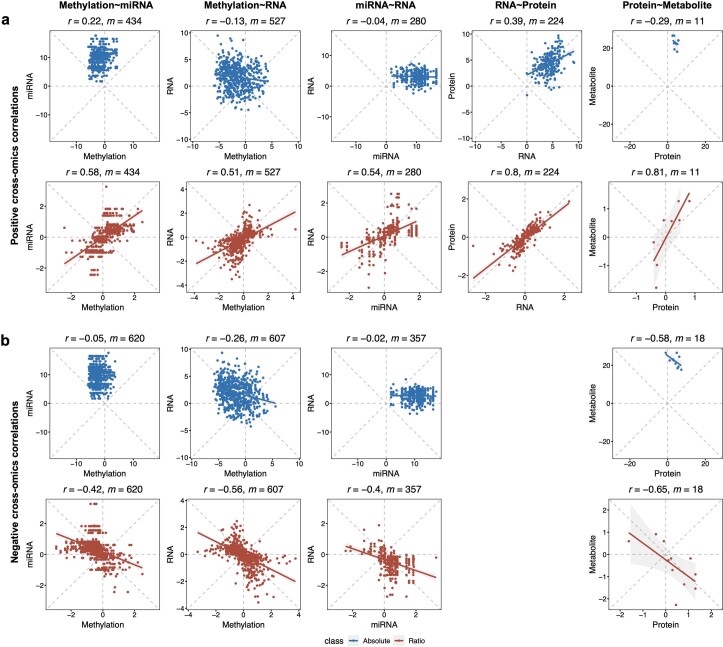
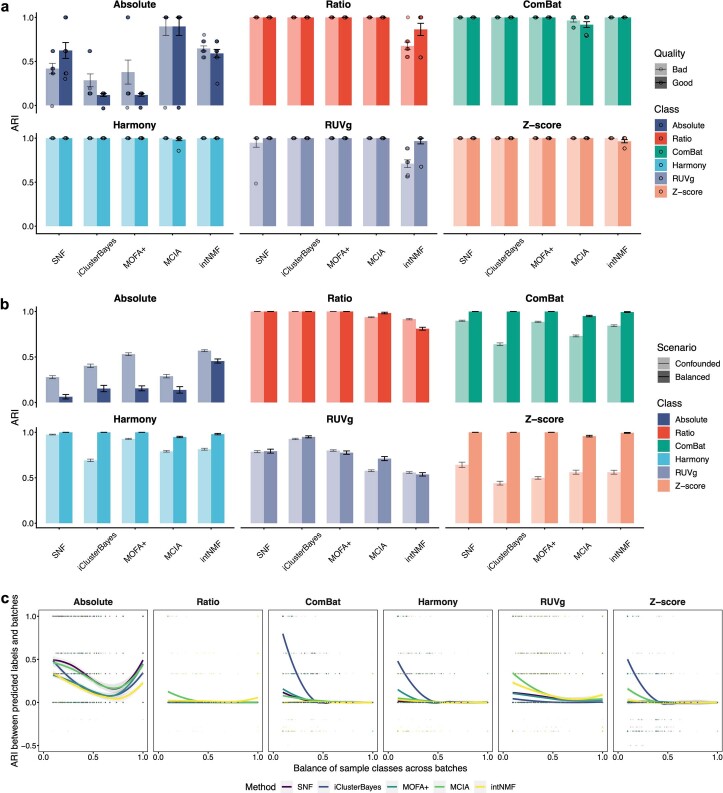
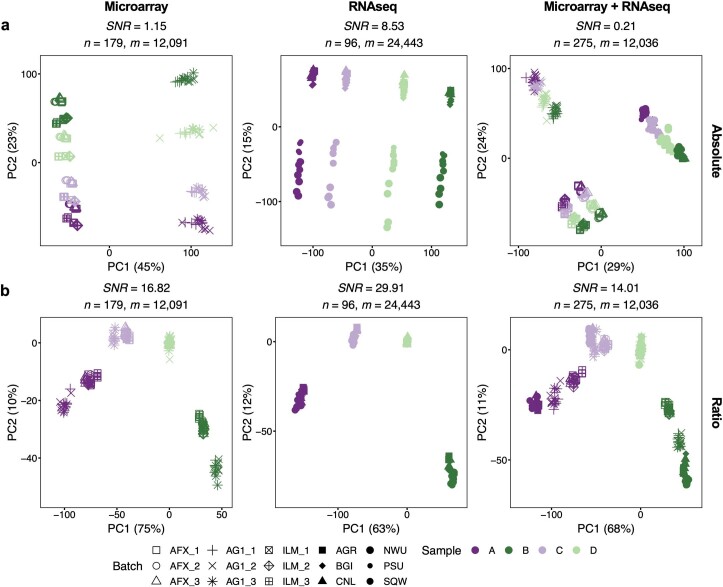
Characterization and integration of the genome, epigenome, transcriptome, proteome and metabolome of different datasets is difficult owing to a lack of ground truth. Here we develop and characterize suites of publicly available multi-omics reference materials of matched DNA, RNA, protein and metabolites derived from immortalized cell lines from a family quartet of parents and monozygotic twin daughters. These references provide built-in truth defined by relationships among the family members and the information flow from DNA to RNA to protein. We demonstrate how using a ratio-based profiling approach that scales the absolute feature values of a study sample relative to those of a concurrently measured common reference sample produces reproducible and comparable data suitable for integration across batches, labs, platforms and omics types. Our study identifies reference-free 'absolute' feature quantification as the root cause of irreproducibility in multi-omics measurement and data integration and establishes the advantages of ratio-based multi-omics profiling with common reference materials.


Conflict of interest statement

J.H. is an employee of Vazyme Biotech Co. Ltd. L.Z. is the cofounder of Vazyme Biotech Co. Ltd. Hui Jiang is an employee of MGI, BGI-Shenzhen. All other authors declare no competing interests.

Figures

Fig. 1
Fig. 1. Overview of the Quartet Project.
a, Design and production of Quartet family-based multi-omics reference material suites. b, Data generation across multiple platforms, labs, batches and omics types. DDA, data-dependent acquisition; DIA, data-independent acquisition; WGS, whole-genome sequencing. c, QC metrics for horizontal (within-omics) integration include the Mendelian concordance rate and SNR, which are also applicable to wet-lab proficiency testing. Two types of QC metrics for vertical (cross-omics) integration were developed that assess the ability to detect cross-omics feature relationships that follow the central dogma and the ability to classify samples into either four phenotypically different groups (D5–D6–F7–M8) or three genetically driven clusters (daughters–father–mother). d, Ratio-based scaling using common reference materials empowers horizontal and vertical integration.
Fig. 2
Fig. 2. Wet-lab proficiency in omics data generation varies.
a, The number of features detected from each dataset generated in different labs using different platforms. b, Distribution of the number of experiments supporting genomic variant calling or CV in quantitative omics profiling from technical replicates (analytical repeats in SV calling and library repeats for the others) within a batch. c, Technical reproducibility from three replicates within a batch, calculated as the Jaccard index for small variant calling and Pearson correlation coefficient (r) for quantitative omics profiling (n = 12). For SV call sets, technical reproducibility was defined as the Jaccard index between different analytical repeats (Oxford Nanopore, n = 28; PacBio Sequal, n = 55; PacBio Sequal2, n = 55). The box plots display the distribution of data, with the median represented by the line inside the box and the interquartile range represented by the box. Whiskers extend to 1.5× the interquartile range. d, SNR based on the Quartet multi-sample design (4 samples × 3 replicates per batch). e, RMSE of high-confidence DEFs. Dots represent RMSE values for the D5–F7, D5–M8 and F7–M8 pairs in each batch (n = 3), while the bar plots present the corresponding mean values.
Fig. 3
Fig. 3. Ratio-based scaling enables horizontal integration.
a,b, Scatterplots of the feature abundance of inter-batch D5 samples in methylation, miRNA-seq, RNA-seq, proteomics and metabolomics datasets at the absolute level (raw data; a) and ratio level (ratio scaling to the D6 sample; b). The x and y axes show the average expression of the three D5 technical replicates from the two best quality batches from different labs (ranked by SNR). At the absolute level, features with a CV less than 0.2 for the technical replicates of D5 in both batches were retained; at the ratio level, features with a CV less than 0.2 for the technical replicates of D5 and D6 in both batches were retained. r denotes the Pearson correlation coefficient, and m denotes the number of features. Linear fits were performed on the basis of the feature abundance. c, Lollipop plots of CV in feature abundance for six D5 samples across two batches. The x axis represents the exhaustive two-by-two combination of all batches for each omics type. d,e, PCA plots of horizontal integration of all batches of methylation, miRNA-seq, RNA-seq, proteomics and metabolomics datasets at the absolute level (d) and ratio level (e). n denotes the number of samples, and m denotes the number of features. f, Scatterplots between SNR and degree of sample class-batch balance. Blue, absolute level; red, ratio level.
Fig. 4
Fig. 4. Improved reliability of cross-omics feature correlations.
a, Scatterplots of the cross-omics feature relationships of intra- and inter-batch (horizontally integrated) data at the absolute level (blue) and ratio level (red). The solid lines represent fitted curves from linear regression along with the Pearson correlation coefficient (r). b, Workflow for the construction of reference datasets of cross-omics feature relationships according to the following steps: (1) identification of detectable multi-omics features and per-sample normalization; (2) intra-batch QC by filtering out features that are not detectable or have low technical reproducibility; (3) identification of cross-omics feature pairs associated with the same genes or pathways; (4) cross-batch QC by retaining reliable feature pairs identified in a sufficient number of batches; (5) calculating Pearson correlation coefficients for each feature pair in each batch combination and classifying the relationships into positive (r ≥ 0.5, P < 0.05) and negative (r ≤ –0.5, P < 0.05) categories; and (6) voting based on the direction of the correlations (negative or positive) to screen the high-confidence cross-omics feature relationships. c, Chord plot of the reference dataset of cross-omics feature relationships. Each chord represents a positive (red) or negative (blue) correlation of any two cross-omics features. d, Scatterplots of the expression abundance of 224 positively correlated RNA–protein pairs at the absolute level (blue) and ratio level (red). Data were selected from the best quality batch in the RNA-seq and proteomics datasets. r denotes the Pearson correlation coefficient, and m denotes the number of features. e,f, Bar plots of RMSE of cross-omics feature relationships identified from different quality datasets (e; bad versus good) and different scenarios (f; confounded versus balanced) at the absolute level (blue) and ratio level (red) based on the reference datasets. The number of data sampling instances (n) used to derive statistics was as follows: bad, n = 10; good, n = 10; confounded, n = 200; balanced, n = 100. Data are presented as mean values ± s.d. The P values were calculated using unpaired two-tailed Wilcoxon rank-sum tests with false discovery rate (FDR) correction. ****P < 0.0001, ***P < 0.001, **P < 0.01, *P < 0.05; not significant, P ≥ 0.05. Specific P values are listed in Supplementary Data 1 and 2.
Fig. 5
Fig. 5. Facilitating vertical integration for sample classification.
a,b, Bar plots of the ARI of vertically integrated multi-omics datasets of different quality (a; bad versus good) and different scenarios (b; confounded versus balanced) at the absolute level (blue) and ratio level (red) using SNF, iClusterBayes, MOFA+, MCIA and intNMF. The number of data sampling and integration instances (n) used to derive statistics was as follows: bad, n = 10; good, n = 10; confounded, n = 200; balanced, n = 100. Data are presented as mean values ± s.d. The P values were calculated using unpaired two-tailed Wilcoxon rank-sum tests with FDR correction. ****P < 0.0001, **P < 0.01, *P < 0.05; not significant, P ≥ 0.05. Specific P values are listed in Supplementary Data 3 and 4. c, Scatterplots of the degree of sample class-batch balance versus ARI with different data preprocessing methods. d, Scatterplots of the degree of sample class-batch balance versus SNR with different data preprocessing methods. SNR was calculated on the basis of a sample-to-sample similarity matrix. e, Curves of ARI and SNR with the degree of balance between sample classes and batches at the absolute level (blue, solid line), ratio level (red, solid line), absolute level combined with BECAs (blue, dotted line) and ratio level combined with BECAs (red, dotted line). Each point represents an instance of data sampling and integration. The solid lines correspond to fitted curves obtained from local regression, and the shading indicates the 95% confidence interval around the smoothing.
Fig. 6
Fig. 6. Quartet design for genetics-driven ground truth.
a, Networks of six types of omics profiling based on the similarity between 12 samples within one batch (top) and sample similarity networks obtained with SNF, iClusterBayes, MOFA+, MCIA and intNMF (bottom), which integrated the six types of multi-omics data. b, Bar plots of the ARI when clustering samples into three (D–F–M) or four (D5–D6–F7–M8) groups by single-omics clustering (yellow) versus multi-omics integration (orange). c, Bar plots of the ARI for multi-omics data integration using SNF, iClusterBayes, MOFA+, MCIA and intNMF. Light green represents data when the true labels of the samples were set to three clusters (D–F–M), while dark green represents four clusters (D5–D6–F7–M8). In b,c, data are presented as mean values ± s.d. A total of 60 batches of multi-omics datasets were used for single-omics PAM clustering, on the basis of which 100 cross-omics combinations were used for multi-omics integration with five algorithms. d, The number of multi-omics features associated with DNMs, DEFs identified from profiles and their intersections. e, Enrichment pathway maps for differential multi-omics features between D5 and D6, that is, the intersection of DNMs and DEFs. Darker colors indicate pathways and lighter colors indicate genes. The percentage of each circle of a specific color corresponds to the proportion of features associated with each omics type. f, Box plots of the similarity between D5 and D6 for integration of different types of omics data with 50 iterations. The multi-omics data were integrated starting with DNA (red) and ending with metabolites (gray) by using SNF. The box plots display the distribution of data with the median represented by the line inside the box and the interquartile range represented by the box. Whiskers extend to 1.5× the interquartile range.
Extended Data Fig. 1
Extended Data Fig. 1. Characterization of the Quartet B-lymphoblastoid cell lines (LCLs).
a, Quartet LCLs were cultured in suspension with typical cell clusters. At least six images were captured under phase-contrast microscopy (X20), and representative images were shown (scaled bar 80 µm). b, Normal karyotypes of the LCLs were shown. c, 15 STR loci were used for identification of Quartet monozygotic twins’ family. Importantly, there were no differences between results from DNAs isolated from LCLs and primary blood.
Extended Data Fig. 2
Extended Data Fig. 2. Roadmap to the Quartet Project manuscripts.
MS1: Quartet project overview and main findings; MS2/3/4/5: Genomics / Transcriptomics / Proteomics / Metabolomics reference materials and reference datasets; MS6: Batch effects and correction; MS7: Data portal for public access of Quartet Project resources; MS8: Haplotype-resolved assemblies.
Extended Data Fig. 3
Extended Data Fig. 3. Ratio-based scaling promotes accurate identification of differentially expressed features.
a, Workflow for the construction of reference datasets of differentially expressed features. Reference datasets were constructed according to the following steps: (1) Identifying detectable multi-omics features and per-sample normalization. (2) Intra-batch quality control. Features that were not detectable or had low technical reproducibility were filtered out. (3) Cross-batch quality control. Features detectable in a sufficient number of batches were retained. (4) Calculating intra-batch differentially expressed features (DEFs) using t-test analysis. DEFs were classified as up- or down-regulated based on the positive or negative sign of the log2 fold change. (5) Voting based on the regulatory directionality (up or down) to screen the high confidence DEFs. b, Box plots of RMSE of the DEFs of horizontal integration data at absolute level (Blue) and ratio level (Red) based on the reference datasets. Data were sampled 100 times per pair of samples. The box plots display the distribution of data with the median represented by the line inside the box and the interquartile range (IQR) represented by the box. Whiskers extend to 1.5× the interquartile range. c, Scatter plots between RMSE when integrating at absolute (Blue) and ratio (Red) levels and the degrees of sample class-batch balance.
Extended Data Fig. 4
Extended Data Fig. 4. Sources of variability in the Quartet multi-omics datasets at the absolute and ratio levels.
a, Scatter plots between cumulative proportion and principal components at absolute (Blue) and ratio (Red) levels. b, The principal variance component analysis plots measuring the contribution of impact factors to the Quartet multi-omics profiles at absolute (Top) and ratio (Bottom) levels. The impact factors included sample (Orange), lab (Light yellow), platform (Green), protocol (Blue), and residual (Dark blue). The x-axis indicates the cumulative proportion of variance explained from 0.1 to 1 in increments of 0.1, and the y-axis indicates the weighted average proportion variances. c, Bar plots of PVCA when the cumulative contribution of variance explained was 60%. The annotated scores were weighted average proportion variances.
Extended Data Fig. 5
Extended Data Fig. 5. Ratio-based integration enhanced horizontal data integration no matter which sample was chosen as the reference.
a, Bar plots of Signal-to-Noise Ratio (SNR) of horizontal integration of all batches of methylation, miRNAseq, RNAseq, proteomics, and metabolomics datasets at absolute level (Blue) and ratio level (Red) with the choice of different Quartet samples as the reference sample. b-d, PCA plots of horizontal integration of omics datasets at ratio level by scaling to D5 (b), F7 (c), and M8 (d).
Extended Data Fig. 6
Extended Data Fig. 6. Ratio-based scaling improved the identification of cross-omics feature associations in reference datasets.
Scatter plots of the abundance of positively correlated (a) and negatively correlated (b) cross-omics features in the reference dataset at the absolute (Blue) and ratio (Red) levels. The Pearson correlation coefficients were denoted by r and the number of features were denoted by m. Data points represent one feature and solid lines indicate fitted lines obtained from linear regression. The shading indicates the 95% confidence intervals.
Extended Data Fig. 7
Extended Data Fig. 7. Vertical integration with different data preprocessing methods.
a,b, Bar plots of the Adjusted Rand Index (ARI) of vertically integrated multi-omics datasets of different quality datasets (a, Bad vs. Good) and different scenarios (b, Confounded vs. Balanced) at absolute level (Blue) and ratio level (Red) using SNF, iClusterBayes, MOFA + , MCIA, and intNMF. Data of each omics type were preprocessed by Absolute (no further processing on the normalized datasets), Ratio, ComBat, Harmony, RUVg, or Z-score for horizontal integration. The number of data sampling and integration instances (n) used to derive statistics were as follows: Bad, n = 10; Good, n = 10; Confounded, n = 200; Balanced, n = 100. Data are presented as mean values ± SD. c, Scatter plots between ARI between predicted labels and batches as well as the degree of sample class-batch balance with different data preprocessing methods. Each point represents an instance of data sampling and integration. The solid lines depict local regression fit of the data and shaded regions depict 95% confidence intervals.
Extended Data Fig. 8
Extended Data Fig. 8. Integration of the microarray and RNAseq datasets of reference RNA samples A, B, C, and D from the MAQC and SEQC1 consortia.
PCA plots integrating microarray datasets from MAQC-I (12 batches), RNAseq datasets from SEQC1 (six batches, solid points), and both datasets (18 batches, hollow points) at the absolute (a) and relative (b) levels by ratio to sample D.

References

    1. Hasin, Y., Seldin, M. & Lusis, A. Multi-omics approaches to disease. Genome Biol.18, 83 (2017). - PMC - PubMed
    1. Karczewski, K. J. & Snyder, M. P. Integrative omics for health and disease. Nat. Rev. Genet.19, 299–310 (2018). - PMC - PubMed
    1. Shilo, S., Rossman, H. & Segal, E. Axes of a revolution: challenges and promises of big data in healthcare. Nat. Med.26, 29–38 (2020). - PubMed
    1. Ideker, T., Galitski, T. & Hood, L. A new approach to decoding life: systems biology. Annu. Rev. Genom. Hum. Genet.2, 343–372 (2001). - PubMed
    1. Wang, B. et al. Similarity network fusion for aggregating data types on a genomic scale. Nat. Methods11, 333–337 (2014). - PubMed

LinkOut - more resources