. 2023 Sep;4(9):1362-1381.
doi: 10.1038/s43018-023-00628-6. Epub 2023 Sep 7.

Persister cell phenotypes contribute to poor patient outcomes after neoadjuvant chemotherapy in PDAC

Affiliations

Persister cell phenotypes contribute to poor patient outcomes after neoadjuvant chemotherapy in PDAC

Xu Zhou et al. Nat Cancer. 2023 Sep.

Abstract

Neoadjuvant chemotherapy can improve the survival of individuals with borderline and unresectable pancreatic ductal adenocarcinoma; however, heterogeneous responses to chemotherapy remain a significant clinical challenge. Here, we performed RNA sequencing (n = 97) and multiplexed immunofluorescence (n = 122) on chemo-naive and postchemotherapy (post-CTX) resected patient samples (chemoradiotherapy excluded) to define the impact of neoadjuvant chemotherapy. Transcriptome analysis combined with high-resolution mapping of whole-tissue sections identified GATA6 (classical), KRT17 (basal-like) and cytochrome P450 3A (CYP3A) coexpressing cells that were preferentially enriched in post-CTX resected samples. The persistence of GATA6hi and KRT17hi cells post-CTX was significantly associated with poor survival after mFOLFIRINOX (mFFX), but not gemcitabine (GEM), treatment. Analysis of organoid models derived from chemo-naive and post-CTX samples demonstrated that CYP3A expression is a predictor of chemotherapy response and that CYP3A-expressing drug detoxification pathways can metabolize the prodrug irinotecan, a constituent of mFFX. These findings identify CYP3A-expressing drug-tolerant cell phenotypes in residual disease that may ultimately inform adjuvant treatment selection.


Conflict of interest statement

The authors declare no competing interests.

Figures

Fig. 1
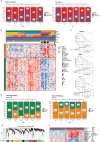
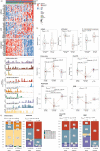
Fig. 1. Transcriptomic profiling of chemo-naive and post-CTX PDAC-HD samples.
a, The PDAC-HD cohort included 171 unique samples representing 115 chemo-naive and 56 post-CTX resections. Post-CTX samples received either GEM (n = 23) or mFFX (n = 33). These samples were analyzed by RNA-seq or multiplexed IF. The RNA-seq set was composed of a total of n = 97 samples, including n = 64 chemo-naive and n = 33 post-CTX samples. LCM was performed on chemo-naive samples (n = 32). Chemo-naive individuals received adjuvant GEM (n = 54) and mFFX (n = 5). Post-CTX individuals received neoadjuvant GEM (n = 10) and mFFX (n = 23). b, WGCNA of RNA-seq data showing significantly enriched GPs between chemo-naive and post-CTX PDAC-HD samples. Significance was determined by two-sided Wilcoxon rank-sum test adjusted for multiple testing (P ≤ 0.05). The heat map shows relative module eigengene expression between chemo-naive and post-CTX samples, with red (positive) values associated with increased GP expression and blue (negative) values associated with decreased GP expression. Molecular function and biological processes associated with GPs and enriched in chemo-naive or post-CTX samples are shown; Y, yes; N, no; TNF, tumor necrosis factor; MHC, major histocompatibility complex. c, t-distributed stochastic neighbor embedding (t-SNE) plots showing samples clustered according to the 2,000 top variably expressed genes. Sample clustering is identical between plots, with Moffitt classification and PurIST scores indicated for each sample. d, Heat map showing the classification of chemo-naive and post-CTX PDAC-HD samples by Moffitt subtype. e, Kaplan–Meier survival analysis of chemo-naive and post-CTX PDAC-HD samples. The log-rank P values are annotated on the plots. P values were not adjusted for multiple testing. Source data
Fig. 2
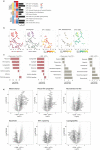
Fig. 2. Neoadjuvant chemotherapy impacts the TME.
a, Top, significantly enriched immune cell types. Middle, significantly expressed immunosuppressive genes. Bottom, significantly expressed immunostimulatory genes. Significance was determined by two-sided Wilcoxon rank-sum test adjusted for multiple testing (P ≤ 0.05); TH1, type 1 helper T cell. b, Immune cell types that exhibit significant enrichment in chemo-naive (n = 32) and post-CTX (n = 33) samples. The heat map represents median immune cell enrichment, and the bar chart represents significance of enrichment as –log10 (Wilcoxon rank-sum test two-sided P value adjusted for multiple testing (Padj)); HSC, hematopoeitc stem cell; aDC, activated dendritic cell; TCM, central memory T cell; GMP, granulocyte–monocyte progenitor; Treg, regulatory T cell; CMP, common myeloid progenitor. c, Bar charts showing significant enrichment of specific stromal signatures in post-CTX samples; myCAFs, myofibroblast-like CAFs; iCAFs, inflammatory CAFs. The significance is provided as –log10 (Wilcoxon rank-sum test two-sided P value adjusted for multiple testing). The dotted line represents –log10 (Padj ≤ 0.05). d, Volcano plots showing the enrichment of immunomodulatory and myofibroblastic cell signature genes in samples treated preoperatively with GEM or mFFX. Genes significantly enriched (log2 (fold change) of >1 and –log10 (Padj) of >2) in post-CTX mFFX samples are shown. Padj represent the significance of a two-sided Wald test adjusted for multiple testing; FC, fold change. e, Kaplan–Meier survival analysis for high (greater than median) and low (less than median) macrophage M2 enrichment values in post-CTX (GEM and mFFX) and mFFX PDAC-HD samples. Participant numbers for each group are provided under ‘Numbers at risk’. A log-rank (two-sided) P value of ≤0.05 is considered significant. f, Immune cell types that exhibit significant enrichment in mFFX post-CTX samples (n = 23) relative to GEM post-treated samples (n = 10). The heat map represents median immune cell enrichment, and the bar chart represents the significance of enrichment as –log10 (Wilcoxon rank-sum test two-sided P value adjusted for multiple testing). g, Immunostimulatory genes that are significantly and differentially expressed between post-CTX GEM (n = 10) and mFFX (n = 23) samples. The bar chart provides the significance of enrichment as –log10 (Wilcoxon rank-sum test two-sided P value adjusted for multiple testing). Correlation heat map showing correlations between immunomodulatory factors in post-CTX samples. Pearson’s correlations are shown in the plot. Significance was determined by two-sided Pearson’s correlation test. P values were not adjusted for multiple testing. All correlations shown are significant. Source data
Fig. 3
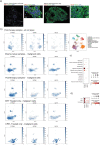
Fig. 3. Classical and basal biomarker analysis of chemo-naive and post-CTX samples using multiplexed IF.
a, Multiplexed IF images of representative normal (n = 9), chemo-naive (n = 77) and post-CTX (n = 45) samples stained with GATA6 (red), HNF1A (red), KRT5 (red), KRT17 (red), KRT81 (red), S100A2 (red) and KRT19 (green) antibodies. b, Box plots showing relative whole-section protein expression of the indicated biomarkers in chemo-naive (n = 77) and post-CTX (n = 45) samples. Biomarker protein expression is considered alone or in the context of KRT19 coexpression. Kruskal–Wallis rank-sum test (two-sided) P values are provided at the top of each plot. c, Box plot showing relative whole-section protein expression of nuclear GATA6 in KRT19+ cells between GEM (n = 19) and mFFX (n = 25) post-CTX samples. The Kruskal–Wallis rank-sum test (two-sided) P value is provided at the top. d, Multiplexed IF images of representative classical and basal post-CTX samples stained with GATA6 (red), KRT17 (red) and KRT19 (green) antibodies. Representative images are presented in rows, with the leftmost image showing the entirety of the imaged region. The top right image and bottom right image show selected regions (i and ii) at increased magnification. e,f, Kaplan–Meier survival analysis for high, medium and low GATA6 and KRT17 protein expression tertiles in post-CTX PDAC-HD samples. Kaplan–Meier survival analyses for post-CTX samples representing combined (GEM and mFFX) treatment, GEM alone or mFFX alone are shown. Participant numbers for each group are provided under ‘Numbers at risk’. A log-rank P value of ≤0.05 is considered significant. All box plots show the median (line), the interquartile range (IQR) between the 25th and 75th percentiles (box) and 1.5× the IQR ± the upper and lower quartiles. P values were not adjusted for multiple testing. Source data
Fig. 4
Fig. 4. Multiplexed GATA6 and KRT17 IF identifies complex intratumor heterogeneity in post-CTX samples.
a, Multiplexed IF images of post-CTX samples stained with GATA6 (red), KRT17 (green) and DAPI (blue). Left, whole-section images; scale bar, 200 μm. Arrows demarcate foci representing dominant GATA6 staining (GD), dominant KRT17 staining (KD) and ‘hybrid’ GATA6+KRT17+ (H) staining. Regions of interest (ROIs) demarcated by white boxes and labeled by i, ii or iii are shown at higher magnification on the right; scale bar, 20 μm. b, Kaplan–Meier survival analysis for high, medium and low ‘hybrid’ GATA6+KRT17+ protein expression tertiles in post-CTX PDAC-HD. Participant numbers for each group are provided under ‘Numbers at risk’. A log-rank P value of ≤0.05 is considered significant. c, Ternary plot showing the percent tumor content of GATA6 and KRT17 cell populations in chemo-naive (n = 69) and post-CTX (n = 42) patients. d, Pie stat plots and bar chart showing enrichment of GATA6hiKRT17hi ‘hybrid’ persister phenotypes in chemo-naive (n = 69) and post-CTX (n = 42) samples. Pearson chi-squared test of independence (two sided) is highly significant (P = 0) given a large sample size (nobs = 7,545,622 cells). e, Box plots showing the relative protein expression of GATA6/KRT17 cell phenotypes post-CTX GEM (n = 18) or after mFFX (n = 24). Kruskal–Wallis rank-sum test (two-sided) P values are provided in the plot. Box plots show the median (line), the IQR between the 25th and 75th percentiles (box) and 1.5× the IQR ± the upper and lower quartiles. f, Bar stat plot showing the percentage of GATA6/KRT17 cell phenotypes in post-CTX samples (n = 42). g, Bar stat plots showing the percentage of GATA6/KRT17 cell phenotypes enriched in samples treated preoperatively with either GEM (n = 18) or mFFX (n = 24) and associated with long and short survival. With respect to bar stat plots, Pearson chi-squared test of independence (two sided) is highly significant (P = 0) given the large sample sizes (nobs = 385,581 cells for GEM/mFFX in f, and nobs = 226,400 cells for GEM and nobs = 91,049 cells for mFFX in g). The P values from a one-sample proportions test (two sided) are displayed on the top of each bar. P values were not adjusted for multiple testing. Source data
Fig. 5
Fig. 5. CYP3A protein expression in mFFX post-CTX samples is associated with patient outcome.
a, Heat map showing mRNA expression of coexpressed genes associated with drug metabolism and phase I functionalization of compounds. b, Network of coexpressed genes that are enriched in classical-like samples. Gene nodes (circles) are colored according to their annotated molecular functions. K denotes annotated KEGG pathways, and R denotes annotated REACTOME pathways. Transcription factors that regulate the network of genes are shown in the adjacent box. c, RNA-seq reanalysis of GATA6 and HNF4A siRNA knockdown experiments performed in a classical human-derived cell line (n = 3 control; n = 3 siRNA) as described in Brunton et al.. Heat map values represent –log10 (P values) × sign (coefficient). Blue color indicates downregulation in siRNA-treated cells. P values represent the significance of a two-sided Wald test and were adjusted for multiple testing. d, Left, multiplexed IF images of representative normal, chemo-naive and post-CTX PDAC-HD samples showing spatial expression of CYP3A relative to KRT19-expressing cells. Right, multiplexed IF images of a representative post-CTX sample analyzed with antibodies to GATA6 (red), KRT17 (green) and CYP3A (yellow); scale bar, 200 μm (whole-section image). ROIs demarcated by white boxes and labeled by i, ii or iii are shown at higher magnifications; scale bar, 20 μm. ROIs represent dominant GATA6 staining (i), dominant KRT17 staining (ii) and ‘hybrid’ GATA6+KRT17+CYP3A+ (iii) staining. e, Box plots showing protein expression by IF of CYP3A according to treatment. Kruskal–Wallis rank-sum test (two-sided) P values are shown on the plots. Box plots show the median (line), the IQR between the 25th and 75th percentiles (box) and 1.5× the IQR ± the upper and lower quartiles. P values were not adjusted for multiple testing. f, Kaplan–Meier survival analysis for high (highest 25% of IF values) and low CYP3A protein expression (remainder of IF values) in post-CTX PDAC-HD samples combined (GEM and mFFX) or in mFFX samples alone. Participant numbers for each group are provided under ‘Numbers at risk’. A log-rank P value of ≤0.05 is considered significant. P values were not adjusted for multiple testing. Source data
Fig. 6
Fig. 6. Multiplexed GATA6, KRT17 and CYP3A IF identifies CYP3A ‘hybrid’ persister phenotypes enriched in post-CTX samples.
a, Top, heat map showing the relative mRNA expression of coexpressed genes associated with drug metabolism and phase I functionalization of compounds. Bottom, bar charts showing the percent tumor enrichment of GATA6/CYP3A/KRT17 cell populations as determined by multiplexed IF. Samples used to generate the data in the top and bottom are identical (n = 47) and are similarly ordered. A LOESS regression line has been added to each bar plot. b, Ternary plot showing the percent tumor content of GATA6, CYP3A and KRT17 cell populations in chemo-naive (n = 69) and post-CTX (n = 42) samples. Post-CTX samples show an enrichment for CYP3A+ ‘hybrid’ persister phenotypes. c, Pie stat plots and bar chart showing significant enrichment of GATA6/CYP3A/KRT17 ‘hybrid’ persister phenotypes in chemo-naive (n = 69) and post-CTX (n = 42) samples. Pearson chi-squared test of independence (two sided) is highly significant (P = 0) given a large sample size (nobs = 10,620,430 cells). d, Bar stat plot showing the percentage of GATA6/CYP3A/KRT17 ‘hybrid’ cell phenotypes in post-CTX samples treated with either GEM (n = 18) or mFFX (n = 24). e, Bar stat plots showing the percentage of GATA6/CYP3A/KRT17 ‘hybrid’ cell phenotypes enriched in samples treated preoperatively with either GEM (n = 18) or mFFX (n = 24) and associated with long and short survival. For bar stat plots, Pearson chi-squared test of independence (two sided) is highly significant (P = 0) given the large sample sizes (nobs = 651,762 cells for GEM/mFFX in d, and nobs = 389,758 cells for GEM and nobs = 137,009 cells for mFFX in e). The P values from a one-sample proportions test (two sided) are displayed on the top of each bar. P values were not adjusted for multiple testing. Source data
Fig. 7
Fig. 7. CYP3A protein expression is positively associated with irinotecan drug tolerance.
a, Multiplexed IF of representative PDOs showing high relative CYP3A protein expression in resistant (h20) versus sensitive (h3) PDOs. b, Multiplexed IF of an irinotecan-resistant PDO (h19) showing mosaic GATA6/CYP3A/KRT17 protein expression. The ROI demarcated by a white box and labeled with i is shown at higher magnification. c, Western blot showing protein expression of CYP3A between PDOs exhibiting resistance or susceptibility to irinotecan. GAPDH is used as a loading control. d, Drug response curves showing half-maximal inhibitory concentration (IC50) values for both irinotecan and SN-38 in selected PDOs that are either relatively resistant or relatively susceptible. The results represent n = 3 independent biological experiments. Data are presented as mean values ± s.e.m. e, Relative enrichment of CYP3A+ ‘hybrid’ cell phenotypes in PDOs. Top, heat map showing mRNA expression of coexpressed genes associated with drug metabolism and phase I functionalization of compounds. Bottom, bar charts showing the percent tumor enrichment of GATA6/CYP3A/KRT17 cell populations as determined by multiplexed IF. PDOs in the top and bottom are identical and are ordered according to increasing irinotecan IC50 values. A LOESS regression line has been added to each bar plot. Source data
Fig. 8
Fig. 8. CYP3A activity mediates irinotecan tolerance in CYP3A+ PDOs.
a, Irinotecan is converted to the active metabolite SN-38 in liver and small intestinal epithelial cells and also pancreatic cancer cells. CYP3A proteins may metabolize irinotecan into inactive metabolites APC and NPC, leading to drug tolerance. SN-38 may also undergo glucuronidation and be exported from cancer cells. CYP3A inhibitors, such as ketoconazole and cobicistat, may overcome irinotecan drug tolerance by increasing the accumulation of SN-38. b, Compound analysis by UPLC–MS/MS of irinotecan metabolites in relative resistant (n = 3) and relative susceptible (n = 3) PDOs showing intracellular irinotecan-to-SN-38 conversion (left) and SN-38 accumulation in the supernatant (right). Biological replicates (n = 3) for the representative PDOs are shown in the plots. Wilcoxon rank-sum test two-sided P values are shown on the plots. P values were not adjusted for multiple testing. c, Compound analysis by UPLC–MS/MS of relative resistant and relative susceptible PDOs showing the accumulation of SN-38 or inactive metabolite APC in the supernatant following irinotecan treatment. The results represent n = 3 independent biological experiments. Data are presented as mean ± s.d. One-way analysis of variance (two-tailed) P values are shown on the plots. P values were not adjusted for multiple testing. d, Treatment of an irinotecan-resistant PDO (h20) with irinotecan, paclitaxel and SN-38 in combination with either ketoconazole or cobicistat as indicated. Combination treatment with ketoconazole increases drug sensitivity to irinotecan and paclitaxel but not SN-38. The results represent n = 3 independent biological experiments. Data are presented as mean ± s.e.m. IC50 values are provided for the indicated treatments. e, Alternative models to explain drug tolerance and persistence in post-CTX samples. Intrinsic resistance: treatment-mediated selection of preexisting drug-tolerant phenotypes may shape residual disease. This process may involve non-genetic mechanisms, including intrinsic and/or drug-induced expression of drug-detoxifying genes and/or a transition toward basal-like or ‘hybrid’ states from predominant classical states due to intrinsic neoplastic plasticity. Acquired resistance: rare subclones acquire a drug-resistant driver alteration before or during therapy. These resistant clones expand and eventually drive relapse due the clonal acquisition of the preexisting drug-resistant mechanism. Source data
Extended Data Fig. 1
Extended Data Fig. 1. Subtype and transcriptomic analysis of PDAC-HD samples.
a) Bar stat plots showing the number of chemo-naïve and post-CTX samples belonging to a defined AJCC (8th Edition) Stage in either the PDAC-HD RNAseq or PDAC-HD IF sample cohorts. Stage (I-IV) and corresponding sample number (n) are shown at the bottom of each plot. A Pearson χ2-test of independence (two-sided) is provided at the top of each plot and P-values from a one sample proportions test are displayed on the top of each bar (two-sided). P-values are not adjusted for multiple testing. b) Heatmap showing Moffitt classification of chemo-naïve PDAC-HD samples using established subtyping schemes. The heatmap is annotated with Bailey, Collisson and Notta subtyping designations and PurIST scores. c) Kaplan Meier survival analysis of chemo-naive PDAC-HD samples stratified by the Bailey, Collisson and Notta subtyping schemes. The number of patients falling into one of the designated subtypes is shown in the ‘Number at risk’ table. Log-rank test (two-sided) P-values are provided for each comparison. Log-rank P-values are not adjusted for multiple correction. d) Bar stat plots showing the number of patient samples belonging to a Moffitt subtype and grouped by AJCC Stage. Stage (I-IV) and corresponding sample number (n) are shown at the bottom of each plot. Separate plots are provided for chemo-naïve and post-CTX samples. As above, a Pearson χ2-test of independence (two-sided) is provided at the top of each plot and P-values from a one sample proportions test (two-sided) are displayed on the top of each bar. P-values are not adjusted for multiple testing. e) WGCNA dendrogram of co-expressed genes showing dissimilarity based on topological overlap and assigned gene module colours. f) Heatmap showing the enrichment of gene programs in chemo-naïve and post-CTX patient samples. Samples are clustered by module eigengene values with higher values (red) associated with increased enrichment and lower values (blue) associated with decreased enrichment of a gene module in a sample. The gene modules presented are all significantly enriched. LCM patient samples were removed from the analysis to provide a direct comparison of chemo-naïve and post-CTX bulk RNAseq samples. Source data
Extended Data Fig. 2
Extended Data Fig. 2. Enrichment of subtype-specific gene programs (GP) and neoplastic cell phenotypes in chemo-naïve and post-CTX samples.
a) Heatmap and bar plot of previously defined Bailey GP signatures that are significantly enriched in either the Classical/Progenitor/Immunogenic, Basal-like/Squamous or ADEX subtypes. Heatmap z scores represent changes in median GP scores between chemo-naïve (n = 64) and post-CTX (n = 33) samples. Bar plots represent –Log10 (Kruskal Wallis rank sum test two-sided P-value adjusted for multiple testing (pAdj)). b) Single sample gene set enrichment analysis using GP signatures (as shown in a) followed by tSNE. Sample clusters are identical between tSNE plots with individual samples highlighted according to treatment type, chemotherapy regimen and indicated GP score. Analyses for chemo-naïve (n = 64) and post-CTX (n = 33) samples are shown. c) Bar charts showing the differential enrichment of specific neoplastic cell populations in chemo-naïve and post-CTX samples as indicated. The significance of the enrichment is provided as -Log10(Wilcoxon rank sum test two-sided pAdj-value adjusted for multiple testing). The dotted line represents -Log10(pAdj ≤ 0.05). d) Volcano plots showing the differential enrichment of genes associated with the indicated neoplastic cell populations in post-CTX samples treated with either GEM or mFFX. Genes significantly enriched (Log 2 Fold change > 1 and -Log10(pAdj) >2) in samples treated pre-operatively with GEM or mFFX are shown. pAdj represent the significance of a two-sided Wald test adjusted for multiple testing. Source data
Extended Data Fig. 3
Extended Data Fig. 3. Multiplexed IF and single nuclei RNAseq identifies complex intratumor heterogeneity.
a) Multiplexed IF showing the spatial expression of KRT17 and GATA6 in Classical subtype GATA6 High and Basal subtype KRT17 High samples, respectively. These images correspond to whole tissue sections shown in Fig. 2d. Scale bars are shown in the images. b) Reanalysis of single nuclei RNAseq data first published in Hwang et al. demonstrating the presence of GATA6, KRT17 and CYP3A5 co-expressing cells in chemo-naïve samples that persist following chemotherapy and nearly always radiotherapy. UMAP embeddings of single nuclei gene expression profiles representing the indicated cell types in chemo-naïve and post-therapy patient samples. CRT denotes chemoradiotherapy (FOLFIRINOX as the major chemotherapy regimen) and CRTL denotes chemoradiotherapy (FOLFIRINOX as the major chemotherapy regimen) plus losartan. c) Dot plot showing the relative enrichment of GATA6, CYP3A5, and KRT17 in cell types comprising post-CRT samples. d) Dot plot showing the relative enrichment of GATA6, CYP3A5, and KRT17 in chemo-naïve (untreated) and post-CRT or post-CRTL patient samples. Source data
Extended Data Fig. 4
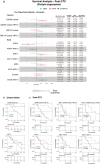
Extended Data Fig. 4. GATA6Hi and KRT17Hi persister phenotypes are associated with poor patient outcomes in mFOLFIRINOX but not gemcitabine post-CTX patient samples.
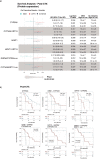
a) Forest plot and associated table of discovery analyses showing univariate cox proportional hazards for neoadjuvant post-CTX with patient samples dichotomized with high and low protein biomarker expression. Analyses are shown for combined GEM and mFFX (black) (n = 44), GEM alone (cyan) (n = 18) and mFFX alone (red) (n = 25) post-CTX patient samples. Hazard Ratios (HR) are shown on the plot as the central measure (symbol) with 95% Confidence Intervals (CI) shown as bars. Log-rank P-values (two-sided) and Median Overall Survival (MOS) for high and low expressing groups are provided for each comparison. Log-rank P-values were not adjusted for multiple testing. b) Kaplan Meier survival analysis for dichotomized High and Low GATA6 and KRT17 protein expression in chemo-naïve PDAC-HD samples. c) Kaplan Meier survival analysis for dichotomized High and Low GATA6 and KRT17 protein expression in post-CTX PDAC-HD samples. Kaplan Meier survival analysis of post-CTX patient samples representing combined (GEM and mFFX), GEM alone or mFFX alone is shown. For panels b) and c), patient numbers for each group are provided under ‘Numbers at risk’. Log Rank P-value ≤ 0.05 is considered significant. Log-rank P-values were not adjusted for multiple testing. Source data
Extended Data Fig. 5
Extended Data Fig. 5. Intermediate co-expressor (IC) ‘Hybrid’ states are significantly enriched in post-CTX samples.
a) Top panel, heatmap showing the expression of gene signatures derived from single cell analyses that define distinct Classical (scClassical), Basal (scBasal) and Intermediate co-expressor (IC) cell phenotypes. Patient samples are ordered according to increasing scBasal ssGSEA enrichment scores. Bottom panel, bar charts showing the percent tumor enrichment of GATA6/CYP3A/KRT17 cell populations as determined by multiplexed IF. Patient samples in top panel and bottom panel are identical and similarly ordered. A LOESS regression line has been added to each bar plot. b) Box plots showing the enrichment of scClassical, scBasal and scIC signature scores in chemo-naïve and post-CTX patient samples. Sample numbers (n) shown at the bottom of each plot. Two-sided Welch’s t-test was performed to determine significance between treatment groups. Welch’s P-values were not corrected for multiple testing. Two-sided Friedman rank sum test was performed to determined significance between signature score in indicated treatment group. Friedman P-values were adjusted for multiple testing. Boxplots show the median (line), the interquartile range (IQR) between the 25th and 75th percentiles (box) and 1.5× the IQR ± the upper and lower quartiles. c) Bar stat plots showing the number of GATA6/KRT17/CYP3A ‘hybrid’ cells observed (n) in Moffitt subtypes Basal (n = 20) and Classical (n = 27). A Pearson χ2-test of independence (two-sided) is provided at the top of each plot and P-values from a one sample proportions test (two-sided) are displayed on the top of each bar. P-values were not adjusted for multiple testing. Source data
Extended Data Fig. 6
Extended Data Fig. 6. CYP3AHi persister phenotypes are associated with poor patient outcomes in mFFX but not GEM post-CTX patient samples.
a) Forest plot and associated table of discovery analyses showing univariate cox proportional hazards for post-CTX patient samples with the indicated dichotomized High and Low protein biomarker expression. Univariate analyses have not been corrected for multiple testing. Analyses are shown for combined GEM and mFFX (black) (n = 44), GEM alone (cyan) (n = 18) and mFFX alone (red) (n = 25) post-CTX patient samples. Hazard Ratios (HR) are shown on the plot as the central measure (symbol) with 95% Confidence Intervals (CI) shown as bars. Log-rank P-values (two-sided) and Median Overall Survival (MOS) for high and low expressing groups are provided for each comparison. Log-rank P-values were not adjusted for multiple testing. b) Kaplan Meier survival analysis for dichotomized High and Low CYP3A, ‘hybrid’ CYP3A/KRT17+ve and CYP3A/KRT17+ve persister phenotypes in post-CTX PDAC-HD samples. Kaplan Meier survival analysis of post-CTX patient samples representing combined (GEM and mFFX), GEM alone or mFFX alone is shown. Patient numbers for each group are provided under ‘Numbers at risk’. Log Rank P-value ≤ 0.05 is considered significant. Log-rank P-values were not adjusted for multiple testing. Source data
Extended Data Fig. 7
Extended Data Fig. 7. AJCC (8th Edition) Stage is associated with GATA6/ CYP3A/KRT17 ‘hybrid’ cell enrichment in chemo-naïve PDAC-HD samples.
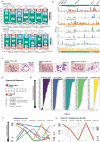
a) Bar stat plots showing the number of GATA6/KRT17/CYP3A ‘hybrid’ cells observed in different AJCC stages for both chemo-naïve (n = 69) and post-CTX samples (n = 42). As above, a Pearson χ2-test of independence (two-sided) is provided at the top of each plot and P-values from a one sample proportions test (two-sided) are displayed on the top of each bar. Number of observations (n) cells are provided at the bottom of each bar. P-values were not adjusted for multiple testing. b) Bar plot showing the percent tumor content of GATA6/KRT17/CYP3A ‘hybrid’ cells in chemo-naïve samples (n = 69) for each AJCC stage. A LOESS regression line has been added to each bar plot. c) Hematoxylin and Eosin (H&E) stains of representative patient samples showing the histology of the parental tissue and matched PDO. d) Table describing PDAC-HD organoids used in this study. e) Pharmacotyping of PDOs showing heterogeneity of chemotherapy response. PDOs are ranked by increasing Log (IC50) values for the indicated drug treatments and concentrations. f) Line plot showing the heterogeneity of chemotherapy responses for PDOs resistant and susceptible to irinotecan. g) Line plot showing chemotherapy responses for PDAC-HD PDO h20 which was generated from a patient sample that had received mFFX pre-operatively. Numbers in line plots represent the Log (IC50) rank for the indicated treatment. Source data
Extended Data Fig. 8
Extended Data Fig. 8. CYP3A protein expression in PDOs is positively correlated with irinotecan resistance.
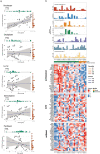
a) Scatter plots showing the correlations between CYP3A protein expression and Log (IC50) values for the indicated chemotherapies. Winsorized correlations (two-sided) were performed to reduce the effect of outliers. P-values are shown on each correlation plot with P-value ≤ 0.05 considered significant. The plots show a solid regression line and error bands representing 95% confidence intervals. P-values were not adjusted for multiple testing. b) CYP3A-positive ‘Hybrid’ cells overlap scClassical and scIC gene signatures. Top panel, bar plots showing the percent tumour content of GATA6/CYP3A/KRT17 hybrid cell types in PDOs. A LOESS regression line has been added to each bar plot. Bottom panel, heatmap showing the relative expression of gene signatures derived from single cell analyses that define distinct Classical (scClassical), Basal (scBasal) and Intermediate co-expressor (IC) cell phenotypes. PDOs are grouped by Moffitt subtype. Source data
Extended Data Fig. 9
Extended Data Fig. 9. CYP3A activity mediates irinotecan tolerance in CYP3A-positive PDOs.
a) Cell proliferation assay showing doubling time for resistant (n = 3) and susceptible (n = 3) PDOs. The results represent n = 3 independent biological experiments. b) Bar plot showing doubling time between resistant (n = 3) and susceptible (n = 3) PDOs. Mann-Whitney (two-sided) P-value is shown on the plot. P-value was not adjusted for multiple testing. Bar plots represent mean values ± s.d. c) Bar plot of Ki67 protein expression in selected resistant (n = 5) and susceptible (n = 6) PDOs. Mann-Whitney (two-sided) P-value is shown on the plots. P-value was not adjusted for multiple testing. Bar plots represent mean values ± s.d. d) CYP3A enzyme activity in selected PDOs as determined by luminescence assay. CYP3A enzyme activity was normalized to total cell number. PDOs were treated with increasing concentrations of the CYP3A inhibitors ketoconazole and cobicistat to determine the optimum concentrations for combination treatments. Dunnett’s multiple comparison test (two-sided) was performed to identify concentrations sufficient to significantly inhibit CYP3A activity. P-values adjusted by multiple correction are shown on the plot. Bar plots show mean values of n = 3 independent biological experiments ± s.d. e) Cell viability assays showing PDO responses to increasing concentrations of the CYP3A inhibitors ketoconazole and cobicistat. Dunnett’s multiple comparison test (two-sided) was performed to identify concentrations sufficient to significantly reduce cell viability. P-values adjusted by multiple correction are shown on the plot. Bar plots show mean values of n = 3 independent biological replicates ± s.d. f) Compound analysis by UPLC-MS/MS of relative resistant and relative susceptible PDOs showing relative irinotecan to SN-38 conversion. Bar plots show mean values of n = 3 independent biological experiments ± s.d. g) Compound analysis by UPLC-MS/MS of relative resistant and relative susceptible PDOs showing relative SN-38 in the supernatant. Bar plots show mean values of n = 3 independent biological experiments ± s.d. h) Treatment of selected PDOs with irinotecan, SN-38, or paclitaxel in combination with either ketoconazole or cobicistat as indicated. Combination treatment with ketoconazole increases drug sensitivity to irinotecan and paclitaxel but not SN-38. IC50 values are provided for the indicated treatments. The results represent n = 3 independent biological experiments. Data are presented as mean values +/− s.e.m. Source data

Similar articles

Cited by

References

    1. Siegel RL, Miller KD, Fuchs HE, Jemal A. Cancer statistics, 2022. CA Cancer J. Clin. 2022;72:7–33. doi: 10.3322/caac.21708. - DOI - PubMed
    1. Cunningham D, et al. Phase III randomized comparison of gemcitabine versus gemcitabine plus capecitabine in patients with advanced pancreatic cancer. J. Clin. Oncol. 2009;27:5513–5518. doi: 10.1200/JCO.2009.24.2446. - DOI - PubMed
    1. Von Hoff DD, et al. Increased survival in pancreatic cancer with nab-paclitaxel plus gemcitabine. N. Engl. J. Med. 2013;369:1691–1703. doi: 10.1056/NEJMoa1304369. - DOI - PMC - PubMed
    1. Conroy T, et al. FOLFIRINOX versus gemcitabine for metastatic pancreatic cancer. N. Engl. J. Med. 2011;364:1817–1825. doi: 10.1056/NEJMoa1011923. - DOI - PubMed
    1. Neoptolemos JP, et al. A randomized trial of chemoradiotherapy and chemotherapy after resection of pancreatic cancer. N. Engl. J. Med. 2004;350:1200–1210. doi: 10.1056/NEJMoa032295. - DOI - PubMed

Publication types