. 2023 Sep 7;13(1):14706.
doi: 10.1038/s41598-023-41933-5.

Asarinin attenuates bleomycin-induced pulmonary fibrosis by activating PPARγ

Affiliations

Asarinin attenuates bleomycin-induced pulmonary fibrosis by activating PPARγ

Qian Zeng et al. Sci Rep. .

Abstract

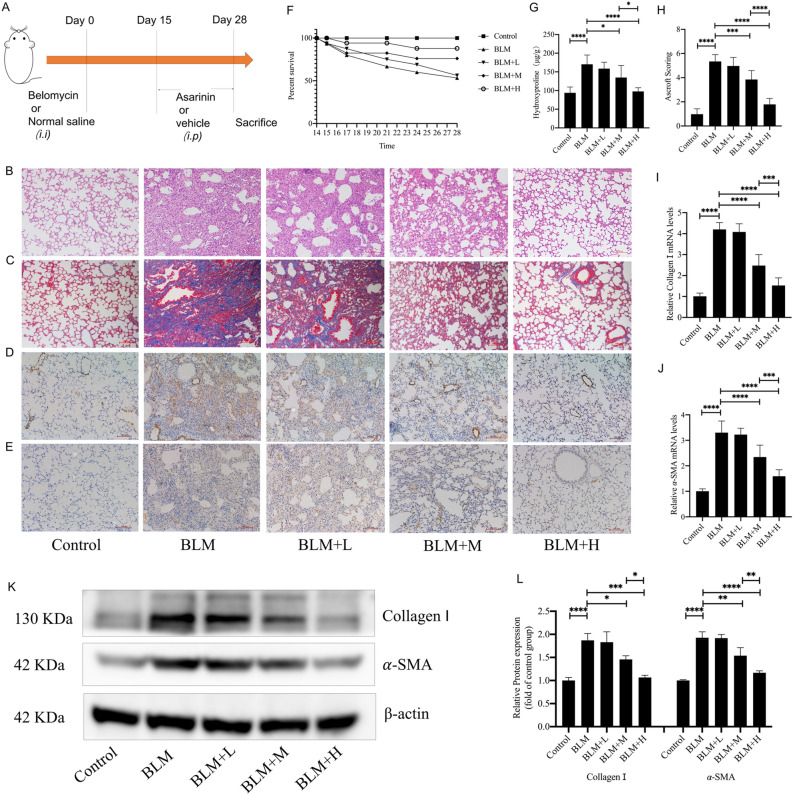
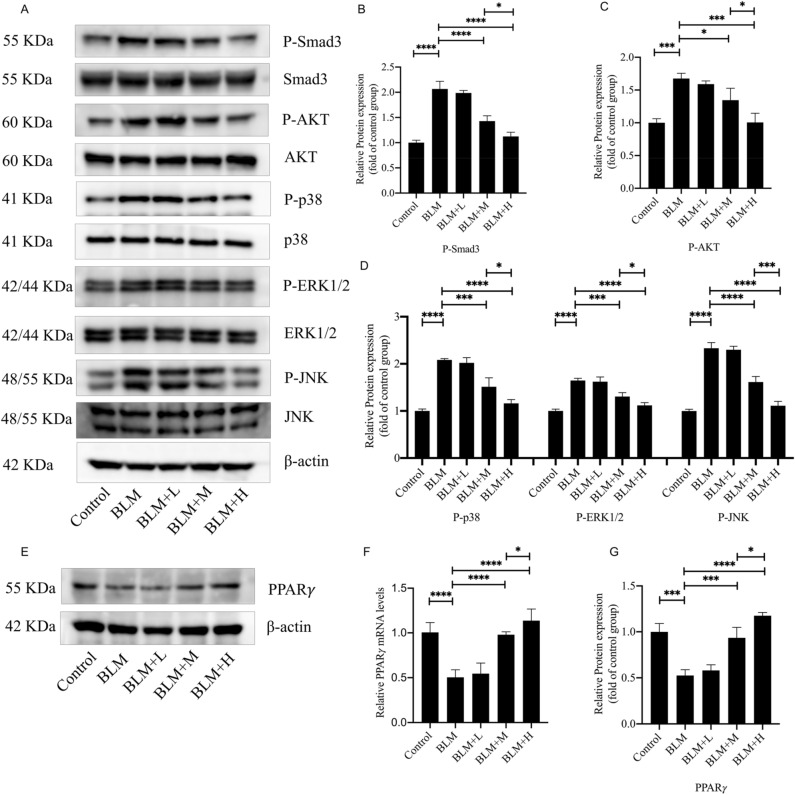
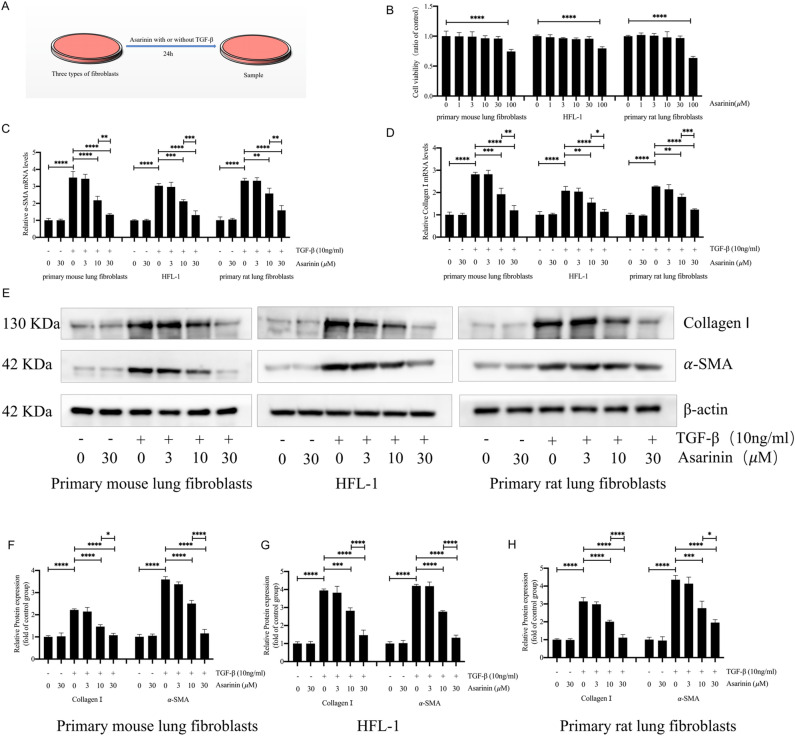
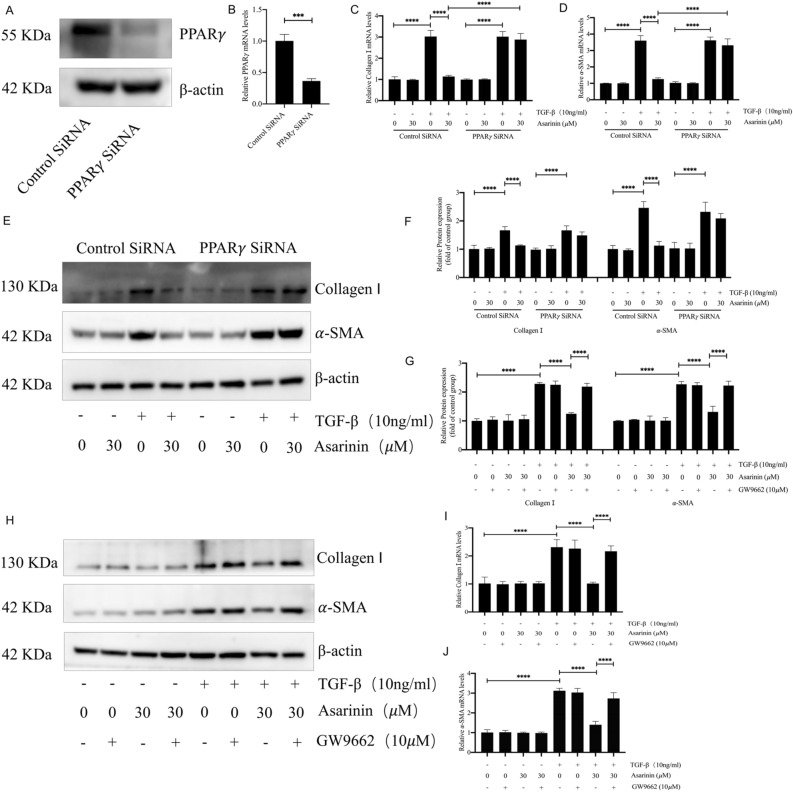
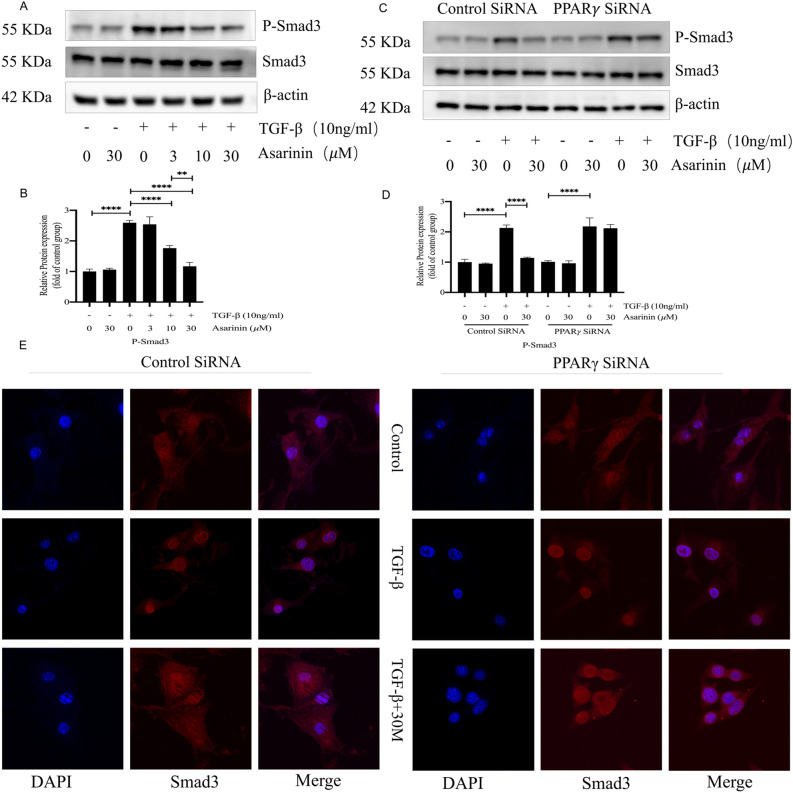
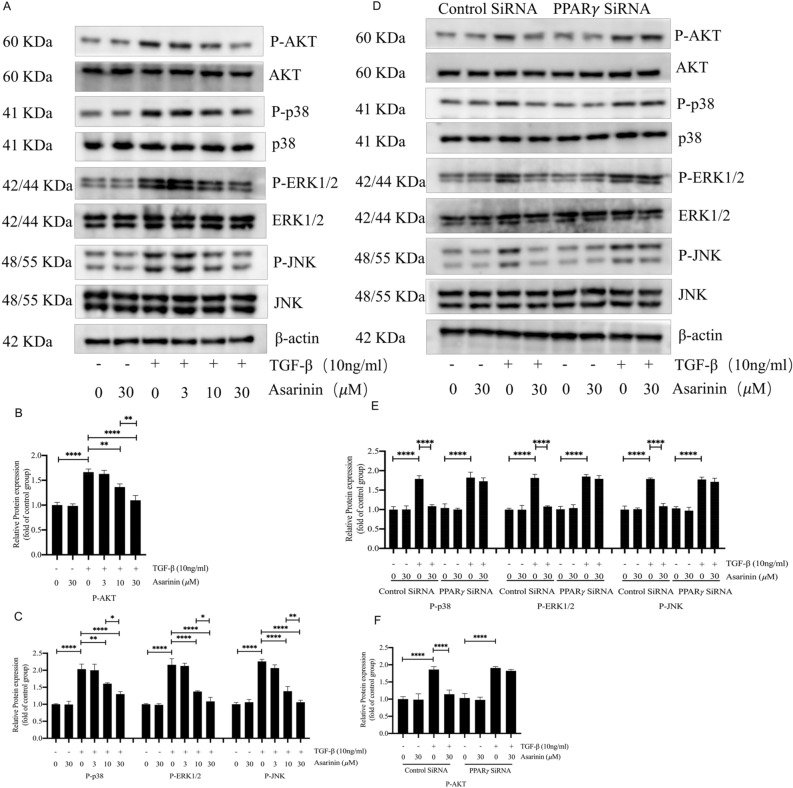
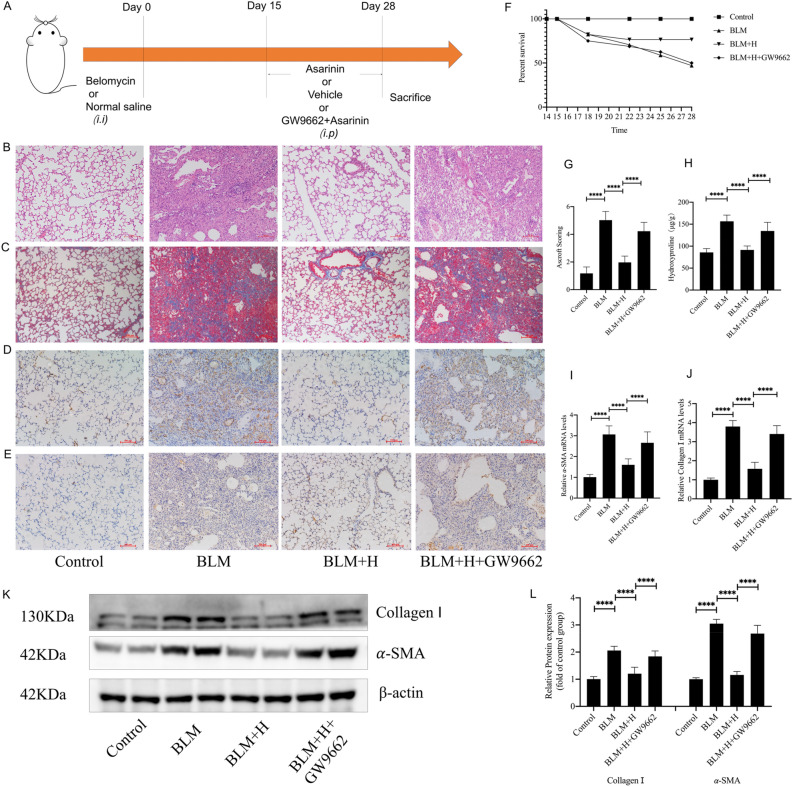
Idiopathic pulmonary fibrosis (IPF) is a chronic progressive interstitial lung disease that lacks effective treatment modalities. Once patients are diagnosed with IPF, their median survival is approximately 3-5 years. PPARγ is an important target for the prevention and treatment of pulmonary fibrosis. Asarinin is a lignan compound that can be extracted from food plant Asarum heterotropoides. In this study, we investigated the therapeutic effects of asarinin in a pulmonary fibrosis model constructed using bleomycin in mice and explored the underlying mechanisms. Intraperitoneal administration of asarinin to mice with pulmonary fibrosis showed that asarinin effectively attenuated pulmonary fibrosis, and this effect was significantly inhibited by the PPARγ inhibitor GW9662. Asarinin inhibited TGF-β1-induced fibroblast-to-myofibroblast transition in vitro, while GW9662 and PPARγ gene silencing significantly inhibited this effect. In addition, asarinin inhibited not only the canonical Smad pathway of TGF-β but also the non-canonical AKT and MAPK pathways by activating PPARγ. Our study demonstrates that asarinin can be used as a therapeutic agent for pulmonary fibrosis, and that PPARγ is its key target.


Conflict of interest statement

The authors declare no competing interests.

Figures

Figure 1
Figure 1
Asarinin improved lung tissue morphology and structure and reduced lung fibrosis marker levels. A mouse lung fibrosis model was constructed using BLM, and high (20 mg/kg), medium (5 mg/kg), and low (1 mg/kg) doses of asarinin were injected intraperitoneally to assess the direct antifibrotic effect of asarinin (A). Hematoxylin and eosin staining and Masson staining analysis for changes in lung tissue structure and extracellular matrix deposition (magnification ×100) (B,C). Ashcroft score analysis for the degree of pulmonary fibrosis (H). Record the number of deaths in each group of mice and make a survival curve (F). Immunohistochemical analysis for the expression of α-SMA and type I collagen in lung tissue (magnification ×100) (D,E). Biochemical methods were used to determine the hydroxyproline content of lung tissue (G). Quantitative real-time PCR analysis for the gene expression levels of Acta2 with Col1a1 in lung tissue (I,J). Western blot analysis of α-SMA and type I collagen protein levels in lung tissue (K,L). Control represents the control group; BLM represents the pulmonary fibrosis model group; BLM+L represents the low-dose asarinin treatment group; BLM +M represents the medium-dose asarinin treatment group; BLM + H represents the high-dose asarinin treatment group. Data are expressed as mean ± standard deviation, sample size (n) = 8 for each group, *P < 0.05; **P < 0.01; ***P < 0.001; ****P < 0.0001.
Figure 2
Figure 2
Asarinin attenuated the decrease in expression of PPARγ and increase in phosphorylation levels of Smad3, AKT, p38, ERK1/2 and JNK caused by BLM. Western blotting analysis for protein expression levels of P-Smad3, Smad3, P-AKT, AKT, p38, P-p38, ERK1/2, P-ERK1/2, JNK, P-JNK and PPARγ protein expression levels in mouse lung tissues (A–E,G), and quantitative real-time PCR analysis for gene expression levels of Pparg in mouse lung tissues (F). Data are expressed as mean ± standard deviation, sample size (n) = 8 for each group, *P < 0.05; **P < 0.01; ***P < 0.001; ****P < 0.0001.
Figure 3
Figure 3
Asarinin decreased the expression levels of TGF-β1-induced α-SMA and type I collagen (A). CCK-8 analysis of the effects of different concentrations of asarinin on the cell viability of primary mouse lung fibroblasts, HFL-1 cells and primary rat lung fibroblasts were examined (B). Quantitative real-time PCR analysis for the gene expression levels of Acta2 with Col1a1 in three types of cells induced by TGF-β1 (C,D). Western blotting analysis for the protein expression levels of α-SMA and type I collagen in the three types of cells induced by TGF-β1 (E–H). Data are expressed as mean ± standard deviation, and all experiments were repeated independently at least 3 times, sample size (n) = 3 for each group, *P < 0.05; **P < 0.01; ***P < 0.001; ****P < 0.0001.
Figure 4
Figure 4
Asarinin promoted the expression and nuclear translocation of PPARγ. After extracting total cellular, nuclear, and cytoplasmic proteins, we verified their PPARγ protein expression levels by western blotting (A,B). The RNA expression levels of Pparg were detected by quantitative real-time PCR (C). The expression and nuclear translocation of PPARγ in mouse primary lung fibroblasts was detected by immunofluorescence (magnification ×1000) (D). Data are expressed as mean ± standard deviation, and all experiments were repeated independently at least 3 times, sample size (n) = 3 for each group, *P < 0.05; **P < 0.01; ***P < 0.001; ****P < 0.0001.
Figure 5
Figure 5
GW9662 and Pparg silencing inhibited the effect of asarinin on α-SMA and type I collagen expression in myofibroblast transition. Western blotting (WB) and quantitative real-time PCR (Q-PCR) verified the effect of Pparg silencing (A,B). WB detected the protein expression levels of α-SMA and type I collagen after Pparg silencing or GW9662 co-incubation (E–H). Q-PCR was performed to detect the gene expression levels of Acta2 with Col1a1 after Pparg silencing or GW9662 co-incubation (C,D,I,J). Data are expressed as mean ± standard deviation, and all experiments were repeated independently at least 3 times, sample size (n) = 3 for each group, *P < 0.05; **P < 0.01; ***P < 0.001; ****P < 0.0001.
Figure 6
Figure 6
The expression levels of P-Smad3 were reduced by asarinin, and the effect of asarinin on the expression of P-Smad3 was suppressed after PPARγ silencing. Western blotting (WB) detected the protein expression levels of P-Smad3 and Smad3 (A,B). After silencing the Pparg, WB was used to detect the protein expression levels of P-Smad3 and Smad3 (C,D). Immunofluorescence was used to detect the effect of asarinin on TGF-b-induced Smad3 nuclear translocation (magnification ×1000) (E). Data are expressed as mean ± standard deviation, and all experiments were repeated independently at least 3 times, sample size (n) = 3 for each group, *P < 0.05; **P < 0.01; ***P < 0.001; ****P < 0.0001.
Figure 7
Figure 7
The expression levels of P-AKT, P-p38, P-ERK1/2 and P-JNK were reduced by asarinin, and the effect of asarinin on the expression of P-AKT, P-p38, P-ERK1/2 and P-JNK were suppressed after PPARγ silencing. Western blotting (WB) detected the protein expression levels of P-AKT, AKT, p38, P-p38, ERK1/2, P-ERK1/2, JNK and P-JNK (A-C). After silencing the Pparg, WB was used to detect the protein expression levels of P-AKT, AKT, p38, P-p38, ERK1/2, P-ERK1/2, JNK and P-JNK (D-F). Data are expressed as mean ± standard deviation, and all experiments were repeated independently at least 3 times, sample size (n) = 3 for each group, *P < 0.05; **P < 0.01; ***P < 0.001; ****P < 0.0001.
Figure 8
Figure 8
GW9662 inhibited the effect of asarinin on lung tissue morphology and lung fibrosis marker levels. Intraperitoneal injection of 1 mg/kg GW9662 was followed by intraperitoneal injection of 20 mg/kg asarinin 30 min later and compared with pulmonary fibrosis mice and asarinin-treated mice (A). Hematoxylin and Eosin staining and Masson staining were used to assess the lung tissue morphology and extracellular matrix deposition (magnification ×100) (B,C), and the Ashcroft scoring method was used to evaluate the degree of pulmonary fibrosis (G). Record the number of deaths in each group of mice and make a survival curve (F). Immunohistochemistry was used to assess the expression of α-SMA with type I collagen in lung tissue (magnification ×100) (D,E). Biochemical methods were used to determine the hydroxyproline content of lung tissue (H). Quantitative real-time PCR was used to determine the gene expression levels of Acta2 and Col1a1 in lung tissue (I,J). Western blotting was used to determine the protein expression levels of α-SMA and type I collagen in lung tissue (K,L). Control represents the control group; BLM represents the pulmonary fibrosis model group; BLM + H represents the high-dose (20 mg/kg) asarinin treatment group; BLM + H + GW9662 represents mice modeled with bleomycin that were injected intraperitoneally with 1 mg/kg of GW9662 prior to each intraperitoneal injection of high-dose asarinin. Data are expressed as mean ± standard deviation, sample size (n) = 8 for each group, *P < 0.05; **P < 0.01; ***P < 0.001; ****P < 0.0001.

Similar articles

Cited by

References

    1. Lederer DJ, Martinez FJ. Idiopathic pulmonary fibrosis. N. Engl. J. Med. 2018;378:1811. doi: 10.1056/NEJMra1705751. - DOI - PubMed
    1. Raghu G, et al. Idiopathic pulmonary fibrosis (an update) and progressive pulmonary fibrosis in adults: An official ATS/ERS/JRS/ALAT clinical practice guideline. Am. J. Respir. Crit. Care Med. 2022;205:e18. doi: 10.1164/rccm.202202-0399ST. - DOI - PMC - PubMed
    1. Albert RK, Schwartz DA. Revealing the secrets of idiopathic pulmonary fibrosis. N. Engl. J. Med. 2019;380:94. doi: 10.1056/NEJMcibr1811639. - DOI - PMC - PubMed
    1. Tomasek JJ, Gabbiani G, Hinz B, Chaponnier C, Brown RA. Myofibroblasts and mechano-regulation of connective tissue remodelling. Nat. Rev. Mol. Cell Biol. 2002;3:349. doi: 10.1038/nrm809. - DOI - PubMed
    1. Marchioni A, et al. Pulmonary stretch and lung mechanotransduction: Implications for progression in the fibrotic lung. Int. J. Mol. Sci. 2021;22:6443. doi: 10.3390/ijms22126443. - DOI - PMC - PubMed

Publication types