. 2023 Oct;8(10):1896-1910.
doi: 10.1038/s41564-023-01473-0. Epub 2023 Sep 7.

Eukaryotic-like gephyrin and cognate membrane receptor coordinate corynebacterial cell division and polar elongation

Affiliations

Eukaryotic-like gephyrin and cognate membrane receptor coordinate corynebacterial cell division and polar elongation

Mariano Martinez et al. Nat Microbiol. 2023 Oct.

Abstract

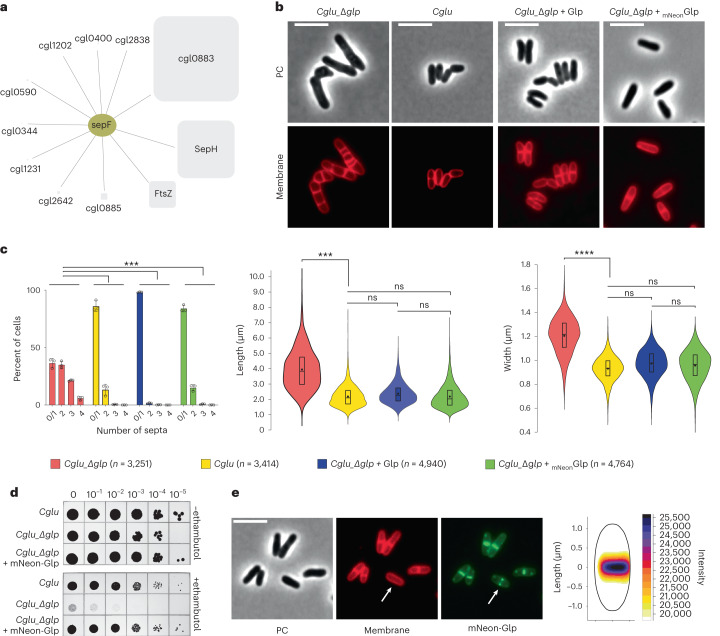
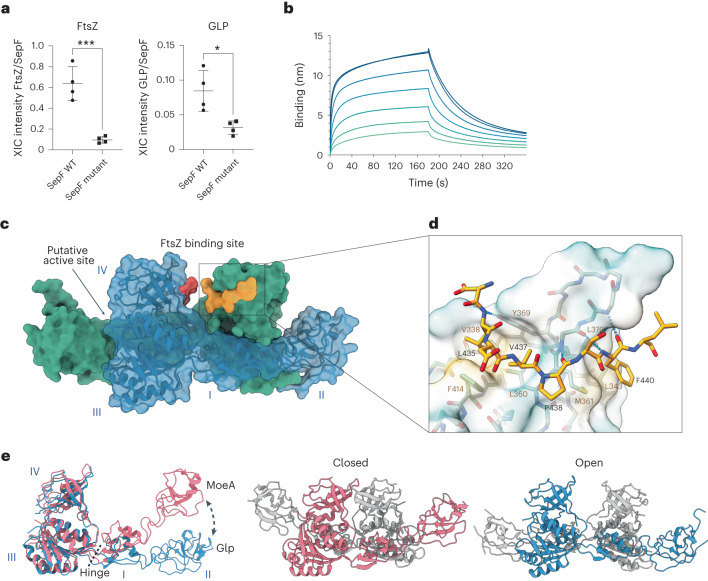
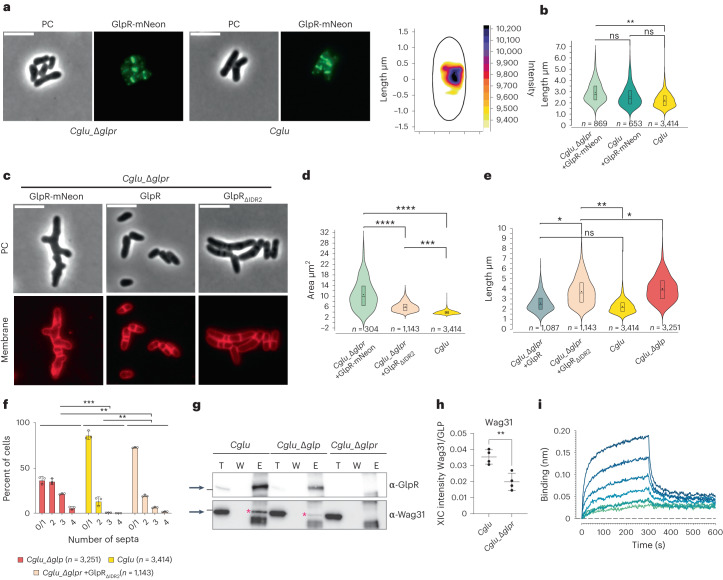
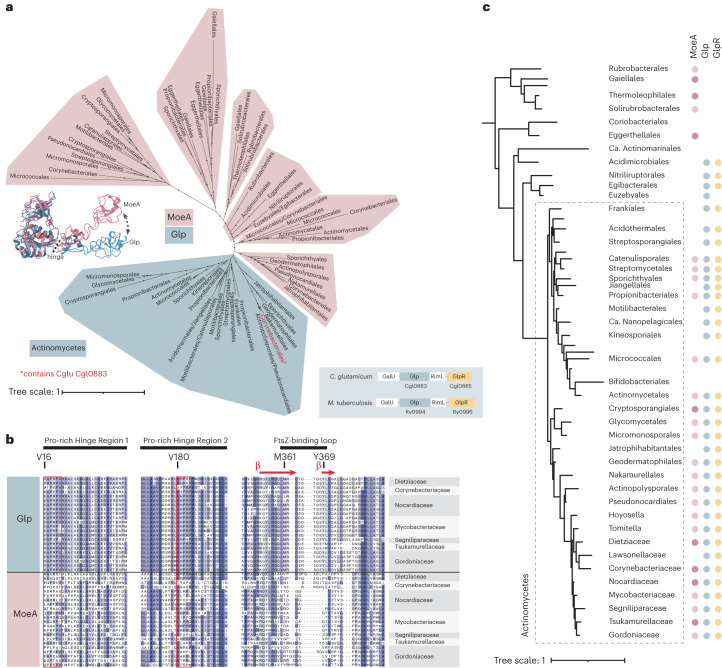
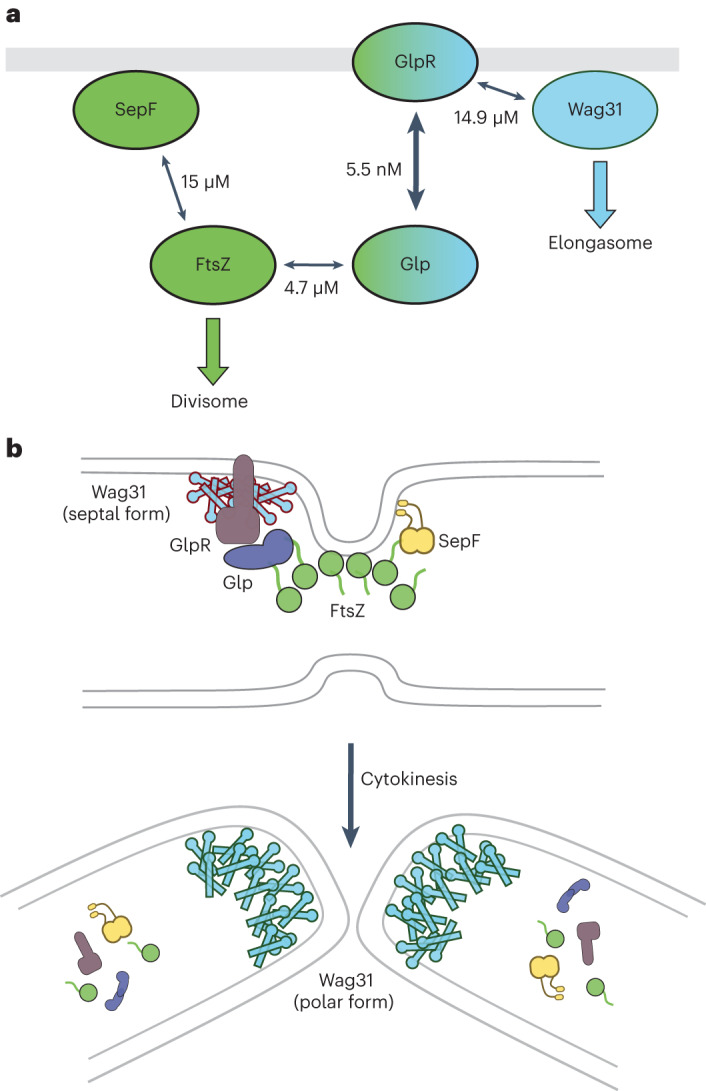
The order Corynebacteriales includes major industrial and pathogenic Actinobacteria such as Corynebacterium glutamicum or Mycobacterium tuberculosis. These bacteria have multi-layered cell walls composed of the mycolyl-arabinogalactan-peptidoglycan complex and a polar growth mode, thus requiring tight coordination between the septal divisome, organized around the tubulin-like protein FtsZ, and the polar elongasome, assembled around the coiled-coil protein Wag31. Here, using C. glutamicum, we report the discovery of two divisome members: a gephyrin-like repurposed molybdotransferase (Glp) and its membrane receptor (GlpR). Our results show how cell cycle progression requires interplay between Glp/GlpR, FtsZ and Wag31, showcasing a crucial crosstalk between the divisome and elongasome machineries that might be targeted for anti-mycobacterial drug discovery. Further, our work reveals that Corynebacteriales have evolved a protein scaffold to control cell division and morphogenesis, similar to the gephyrin/GlyR system that mediates synaptic signalling in higher eukaryotes through network organization of membrane receptors and the microtubule cytoskeleton.


Conflict of interest statement

The authors declare no competing interests.

Figures

Fig. 1
Fig. 1. Identification of Glp as a member of the corynebacterial divisome.
a, The core interactome of SepF, including proteins recovered from three independent co-IP experiments using different strains/antibodies: Cglu/α-SepF, Cglu_SepF-Scarlet/α-SepF and Cglu_SepF-Scarlet/α-Scarlet. The square size for each interactor is proportional to its enrichment in the interactome compared to the proteome (Supplementary Table 1), and the lines indicate either direct or indirect interactors. b, Glp depletion and complementation. Representative images in phase contrast (PC) and membrane staining for indicated strains. c, Left: frequency histogram showing the number of septa per cell for the different strains, calculated from n cells imaged (indicated in the figure) from three independent experiments for each strain (Cgluglp, n = 873, 1,538 and 840; Cglu, n = 718, 1,468 and 1,223; Cgluglp + Glp, n = 2,465, 1,169 and 1,297; Cgluglp + mNeon-Glp, n = 1,641, 1,311 and 1,801); open circles represent the corresponding data points; mean ± s.d.; Cohen’s d (see Methods for interpretation of values), from top to bottom: (***d = 1.57, P = 0), (***d = 1.84, P = 0), (***d = 1.6, P = 0). Middle and right: violin plots showing the distribution of cell length (Cohen’s d, from top to bottom: (***d = 1.76, P ~ 0), (nsd = 0, P = 0.95), (nsd = 0.29, P = 3.78 × 10−37), (nsd = 0.27, P = 2.59 × 10−39)) and cell width (Cohen’s d: (****d = 2.21, P ~ 0), (nsd = 0.25, P = 4.13 × 10−25), (nsd = 0.38, P = 9.65 × 10−74), (nsd = 0.08, P = 1.74 × 10−12)); the box indicates the 25th to the 75th percentile, the mean and the median are indicated with a dot and a line in the box, respectively. d, Ethambutol sensitivity assay. BHI overnight cultures of Cglu and Cgluglp complemented with the empty plasmid or mNeon-Glp were normalized to an OD600 of 0.5, serially diluted 10-fold and spotted onto BHI agar medium with or without 1 μg ml−1 ethambutol. e, Left: localization of mNeon-Glp in Cglu. Representative images in PC, membrane staining and mNeon-Glp fluorescent signals. The arrow indicates the Glp localization before septum formation. Right: heat map representing the localization pattern of mNeon-Glp; 3,879 cells were analysed, from triplicate experiments. Scale bars, 5 μm. Source data
Fig. 2
Fig. 2. Glp–FtsZ interaction.
a, Comparison of the recovery of FtsZ and Glp in co-IP (α-Scarlet) of Cglu_SepF-Scarlet and the mutant unable to bind FtsZ (SepFK125E/F131A-Scarlet). Each point corresponds to the normalized XIC intensity in each replicate for each condition, calculated as described in Methods; n = 4 biologically independent samples per condition; mean ± s.d. Statistical analysis was performed using unpaired two-sided Student’s t-test. FtsZ fold change (FC) = 6.61 (P = 0.0006); Glp FC = 2.70 (P = 0.014). See Supplementary Table 1b for corresponding analysis. b, BLI sensorgrams of Glp binding to immobilized SUMO-FtsZ. Glp concentrations range from 80 μM (dark blue) to 1.25 μM (light green) in 2-fold dilutions. c, Crystal structure of the Glp homodimer (blue and green) in complex with FtsZCTD (yellow and red). The Glp monomer is composed of 4 structural domains (labelled I–IV): domain I (residues 20–45 and 146–181), domain II (residues 46–145), domain III (residues 1–19 and 182–331) and domain IV (residues 332–417). The location of the putative active site at the distal dimer interface is indicated. d, Detailed view of Glp–FtsZ interactions. The peptide adopts a linear extended conformation, with a central kink promoted by the presence of Pro438. The C-terminal half of the peptide backbone runs roughly parallel to the Glp β-strand 360–363 and is stabilized by three intermolecular hydrogen bonds between main-chain atoms (NR362-OP438, OR362-NF440 and NA364-OF440) and by hydrophobic interactions (FtsZ Phe440 with Glp Leu343, Met361 and Leu370). On the N-terminal half, the side chains of FtsZ residues Leu435 and Val437 are anchored in a hydrophobic pocket defined by Glp residues Val338, Leu360, Tyr369 and Phe414. Residues involved in protein–protein interactions are labelled; the molecular surface of Glp shows hydrophobicity (yellow, hydrophobic; green, hydrophilic); intermolecular hydrogen bonds are shown as blue dotted lines. e, Left: the superposition of the monomers from Glp (blue) and MoeA from E. coli (pink, pdb 1g8l) reveals a pronounced conformational change from a hinge region at the interface between domain I and III. This change leads to a central open (right; Glp, blue) or closed (middle; MoeA, pink) conformation in the respective homodimers. Source data
Fig. 3
Fig. 3. Identification of GlpR as a membrane receptor for Glp.
a, Schematic representation of GlpR, with 3 transmembrane segments and the intrinsically disordered regions IDR1 (in red, residues 27–218, theoretical isoelectric points (pI) of 4.05) and IDR2 (in blue, residues 263–340, pI of 10.87). b, BLI sensorgrams of Glp binding to immobilized GlpR. Glp concentrations range from 100 nM (dark blue) to 1.56 nM (light green) in 2-fold dilutions. c, Cell fractionation and subcellular localization of Glp. Total (T), soluble (S) and membrane (M) fractions of Cglu or Cgluglpr strains were obtained by differential centrifugation and analysed by western blot using an α-Glp antibody. d, Left: localization of mNeon-Glp in Cgluglpr. Representative image in PC and mNeon-Glp fluorescent signal. Right: heat map representing the localization pattern of mNeon-Glp; 5,963 cells were analysed, from triplicate experiments. Scale bars, 5 μm. Source data
Fig. 4
Fig. 4. GlpR links the mid-cell divisome with the future polar elongasome via Wag31.
a, Left: representative images of GlpR-mNeon expressed in Cglu and Cgluglpr. Right: heat map of the localization of GlpR-mNeon in Cglu (n = 111). b, Violin plots (cell length). Cohen’s d, from top to bottom: (**d = 0.98, P = 2.88 × 10−85), (nsd = 0.49, P = 6.34 × 10−19), (nsd = 0.39, P = 2.78 × 10−13). The expression levels of GlpR-mNeon are shown in Extended Data Fig. 4d. c, Representative images of Cgluglpr complementation (overexpression conditions). d, Violin plots (cell surface areas). Cohen’s d: (****d = 3.95, P = 7.34 × 10−63), (****d = 2.35, P = 1.01 × 10−46), (***d = 1.4, P = 5.37 × 10−319). The expression levels of GlpR-mNeon are shown in Extended Data Fig. 4e. e, Violin plots of cell length. Cohen’s d: (**d = 1.17, P = 7.22 × 10−255), (*d = 1.70, P = 6.20 × 10−138), (*d = 0.61, P = 3.07 × 10−60), (nsd = 0.49, P = 8.12 × 10−34). Boxes indicate the 25th to the 75th percentile, mean and median indicated with a dot and a line, respectively, in the box. Number of cells used (n) below the violin representation corresponds to triplicates. f, Histogram of number of septa per cell, calculated from n cells from 3 independent experiments (Cgluglp, n = 873, 1,538 and 840; Cglu, n = 718, 1,468 and 1,223; Cgluglp + GlpRΔIDR2, n = 451, 737 and 841); open circles represent the corresponding data points; mean ± s.d.; Cohen’s d, from top to bottom: (***d = 1.60, P = 0), (**d = 0.80, P = 3.70 × 10−169), (**d = 0.79, P = 8.20 × 10−147). g, Co-IP of GlpR-Wag31 for indicated strains using GlpR as bait. Total (T), wash (W) and elution (E) fractions were analysed by western blot using α-GlpR and α-Wag31 antibodies. Arrows indicate GlpR (top) and Wag31 (bottom) and Wag31 is additionally highlighted by a red *. The black bar corresponds to the 55 kDa molecular weight marker. h, Wag31 recovery in co-IPs of Glp from indicated strains. Each point corresponds to the normalized XIC intensity in each biologically independent replicate (n = 4) for each condition; mean ± s.d. Wag31 FC = 1.78 (P = 0.004). Statistical analysis was performed using a two-sided unpaired Student’s t-test. i, BLI sensorgrams of Wag31 binding to GlpR. Wag31 concentrations: 150 μM (dark blue) to 2.3 μM (light green) in 2-fold dilutions. Source data
Fig. 5
Fig. 5. Phylogenetic analyses of Glp in Actinobacteria.
a, Maximum-likelihood phylogeny of MoeA homologues in Actinobacteria. The clade with a blue background corresponds to Glp, clades in pink correspond to other MoeA homologues. Monophyletic classes were collapsed into a single branch for clarity. Dots indicate ultrafast bootstrap (UFB) > 0.85. Scale bar, average number of substitutions per site. For the detailed tree, see Supporting Data. The genomic context of glp in Cglu and M. tuberculosis is indicated on the right of the tree. The locus tags are indicated for genes glp and glpr present in Cglu (Cgl locus tag) and M. tuberculosis (Rv locus tag) genomes. b, Partial alignment of three selected regions from MoeA paralogues in Corynebacteriales. Sequences of Glp and MoeA are shown for the same species, representative of all Corynebacteriales families. The FtsZ-binding loop is delimited by the key residues methionine (M361) and tyrosine (Y369) indicated according to their position on the Cglu sequence. The Pro-rich hinge regions 1 and 2 are indicated by a red rectangle and the first residue inside the box is numbered and highlighted above. c, Phyletic pattern for the presence of MoeA, Glp and GlpR in Actinobacteria. Full circles indicate presence of the gene in >50% of the analysed genomes of the phylum. Column MoeA indicates the presence of one (light pink) or more (dark pink) paralogues, except for Glp that is indicated in a separate column. The presence of GlpR is indicated by yellow dots. The phyletic pattern is represented on a reference Actinobacteria tree. Actinobacteria classes were collapsed into a single branch for clarity. Actinomycetes class is indicated by a dashed line. Dots indicate UFB > 0.85. Scale bar, average number of substitutions per site. For the detailed tree, see Extended Data Fig. 7, and for the detailed analysis, see Supplementary Table 3.
Fig. 6
Fig. 6. Interaction network and proposed function for Glp–GlpR.
a, Known direct protein–protein interactions and their associated apparent Kd values. Note that SepF-FtsZ was determined using surface plasmon resonance, whereas all other measurements were done with BLI (this work). b, Working model of the roles of Glp-GlpR-Wag31 in the divisome–elongasome transition during cytokinesis in Corynebacteriales. At the septum, Glp–GlpR would control the functional status of Wag31 and prevent premature pole formation through excessive Wag31 accumulation. Once cell division is completed, this septal control on Wag31 would disappear and an elongation-competent cell pole could form.
Extended Data Fig. 1
Extended Data Fig. 1. Identification of Glp as a cell division protein.
(a) Venn diagram showing the overlap between 3 independent SepF interactomes using Cglu or Cglu_SepF-Scarlet strains. Proteins only detected in each interactome were identified by comparison with control condition and using the probability mode (p value < 0.05) of Patternlab Venn diagram module following a bayesian model. Proteins enriched in SepF Co-IPs when compared to controls were identified using pairwise comparison module of Patternlab V based on XIC intensities. 20, 22 and 98 proteins were detected as SepF interactors in Cglu/α-SepF (strain/antibody), Cglu_SepF-Scalet/α-SepF and Cglu_SepF-Scalet/α-Scarlet respectively. 12 proteins were common to all of Co-IPs, and for 11 of them an enrichment factor in relation to the total proteome could be calculated, and thus represent the core SepF interactome (Supplementary Table 1,a and Fig. 1a). One additional interactor, the hypothetical protein Cgl1805, could not be detected in the proteome and no enrichment factor could thus be reported. (b) Western blots of whole cell extracts (120 μg) from Cglu (lane 1) and Cglu_Δglp strains transformed with the empty plasmid (lane 2) or mNeon-Glp (lane 3). Glp and mNeon-Glp levels were revealed using the α-Glp antibody. Left: molecular weight markers (kDa) (c) Cellular localization of Cglu MoeA homologs MoeA1/Cgl0212 (25% aa sequence identity) and MoeA3/Cgl1196 (27% aa sequence identity). Representative images in phase contrast and mNeon fluorescent signal for Cglu_mNeon-MoeA1 and Cglu_mNeon-MoeA3. Both MoeA1 and MoeA3 are cytosolic, which contrasts with the mid-cell localization of mNeon-Glp shown in Fig. 1e. All Scale bars 5μm. (d) the cytoplasmic distribution was not due to fusion protein degradation as shown by Western blots of whole cell extracts (120 μg) from Cglu carrying mNeon-MoeA1, mNeon-Glp or mNeon-MoeA3 plasmids and revealed using an α-mNeon antibody. Left: molecular weight markers (kDa); Lanes 1: mNeon-MoeA1 (sucrose); 2: mNeon-MoeA1 (gluconate); 3: mNeon-Glp (sucrose); 4: mNeon-Glp (gluconate); 5: mNeon-MoeA3 (sucrose); 6: mNeon-MoeA3 (gluconate). Source data
Extended Data Fig. 2
Extended Data Fig. 2. Glp-FtsZ interaction.
(a) BLI sensorgrams of FtsZ binding to immobilized Glp in the presence or absence of 1 mM GTP. (b) Normalized melting curves of Glp with or without 1 mM FtsZCTD peptide as determined by a thermofluor assay. Glp was stabilized by 2 °C in the presence of FtsZCTD. (c) The crystal structures of ligand-free (red) and FtsZCTD-bound (blue and yellow ligand). Glp can be superimposed with an r.m.s.d. of 0.64 Å for 392 equivalent Cα atoms. (d) Electron density map of FtsZCTD bound to Glp monomer B contoured at 1.2 σ. (e) Comparison of the Glp-FtsZCTD complex (red, left panel) with the Gephyrin-GlyR complex (blue, right panel, PDB code: 2fts). In both cases the FtsZCTD and GlyR peptides (molecular surfaces) bind the domain IV (in colour) of Glp and gephyrin respectively. (f) Far-UV circular dichroism spectra of Glp and GlpΔloop. (g) BLI sensorgrams of FtsZ (10 μM) binding to immobilized Glp or GlpΔloop. (h) Representative images for mNeon-GlpΔloop in Cgluglp. Scale bar = 5 μm. (i) Left, Violin plots showing the distribution of cell length. The number of cells used in the analyses (n) is indicated below each plot representing triplicate experiments. The box indicates the 25th to the 75th percentile, the mean and the median are indicated with a dot and a line in the box, respectively. Significance indicated corresponds to values of Cohen’s d (from top to bottom: (***, d = 1,55, P = 0), (ns, d = 0,09, P = 0,0012), (***, d = 1,76, P = 0), (***, d = 1,58, P = 0), (***, d = 1,78, P = 0), (ns, d = 0, P = 0,95)). Right, frequency histogram indicating the number of septa per cell, calculated from n cells imaged from 3 independent experiments (triplicates) for each strain (for Cglu, n = 718, 1468 and 1223; for Cgluglp + mNeon-Glp, n = 1641, 1311 and 1801; for Cgluglp, n = 873, 1538 and 840; for Cgluglp + mNeon-GlpΔloop, n = 678, 1187 and 905); open circles represent the corresponding data points; bars represent the mean ± SD. Cohen’s d from top to bottom (ns, d = 0.28, P = 1.19e-26), (***, d = 1.25, P = 0). Source data
Extended Data Fig. 3
Extended Data Fig. 3. BLI sensorgram.
BLI sensorgram of Glp or GlpΔloop (0.1 μM) binding to immobilized GlpR. Source data
Extended Data Fig. 4
Extended Data Fig. 4. Phenotypic analysis of the Cglu_Δglpr strain.
(a) Western blots of whole cell extracts (120 μg) from Cglu and Cgluglpr. GlpR was revealed using an α-GlpR antibody. An arrow indicates the specific signal for GlpR. Molecular weight markers (kDa) are shown on the left (b) Representative images of Cgluglpr. Scale bar 5μm. Violin plots showing the distribution of cell length (ns, d = 0,46, p = 8,22e-75) and cell width (ns, d = 0, p = 0,29) for Cgluglpr and Cglu. The number of cells (n) used (from triplicates) is indicated below each violin representation; the box indicates the 25th to the 75th percentile, mean and the median are indicated with a dot and a line in the box, respectively. Frequency histogram indicating the number of septa per cell for Cglu and Cgluglpr strains, calculated from n cells imaged from 3 independent experiments for each strain (for Cglu, n = 718, 1468 and 1223; for Cgluglpr, n = 931, 934 and 1363); open circles represent the corresponding data points; bars represent the mean ± SD. Cohen’s d (ns, d = 0.01, p-value = 0.8271459) (c) Ethambutol sensitivity assay of Δglpr strain. (d) Western blots of whole cell extracts (120 μg) from Cglu and Cglu_Δglpr strains complemented with the empty plasmid or GlpR-mNeon. GlpR was revealed using an α-GlpR antibody. An arrow indicates the specific signal for GlpR and GlpR-mNeon. Western blot corresponds to representative cells shown in Fig. 4a. Left: molecular weight markers (kDa); Lane 1: Cglu + empty plasmid; Lane 2: Cglu_Δglpr + empty plasmid; Lane 3: Cglu + GlpR-mNeon; Lane 4: Cglu_Δglpr + GlpR-mNeon. (e) Western blots of whole cell extracts (120 μg) from Cglu and Cglu_Δglpr strains complemented with the empty plasmid, GlpR, GlpR-mNeon or GlpRΔIDR2. GlpR was revealed using an α-GlpR antibody. Arrows indicate specific signal for GlpR, GlpR-mNeon and GlpRΔIDR2. Western blot corresponds to representative cells shown in Fig. 4c. Left: molecular weight markers (kDa); Lane 1: Cglu + empty plasmid; Lane 2: Cglu_Δglpr + empty plasmid; Lane 3: Cglu_Δglpr + GlpR; Lane 4: Cglu_Δglpr + GlpR-mNeon; Lane 5: Cglu_Δglpr + GlpRΔIDR2. Note that many cells in the GlpR-mNeon overexpressing strain have lost their plasmid and thus the overexpression is underestimated in these whole cell extracts. Source data
Extended Data Fig. 5
Extended Data Fig. 5. GlpR-Wag31 interactions.
Sensorgrams of Wag311-61 binding to immobilized GlpR by biolayer interferometry. A series of measurements using a range of concentrations for Wag311-61 (200 μM (dark blue) - 3.125 μM (light green)) was carried out to derive the apparent equilibrium dissociation constant Kd (14.86 μM) from steady-state signal versus concentration curves fitted assuming a one-site binding model. Source data
Extended Data Fig. 6
Extended Data Fig. 6. Phylogenetic analyses of Glp in Bacteria.
(a) Maximum likelihood phylogeny of MoeA-like paralogs in Bacteria. The genomic context of Glp/MoeA paralogs is indicated for each branch, if conserved in at least two other cases. Non-conserved genes in the genomic context are indicated with gray rectangles without labels. Branches that correspond to C. glutamicum and M. tuberculosis species are indicated in red. Dots indicate UFB > 0.85. The scale bar represents the average number of substitutions per site. (b) Phyletic pattern for the presence of MoeA-like paralogs in Bacteria. Full circles indicate presence of the gene in more than 50% of the analyzed genomes of the phylum, darker pink indicates the presence of more than one copy. The phyletic pattern is represented on a reference Bacteria tree. Phyla were collapsed into a single branch for clarity. For the detailed analysis see Supplementary Table 4.
Extended Data Fig. 7
Extended Data Fig. 7. Phyletic pattern for the presence of MoeA, Glp and GlpR in Actinobacteria.
Extended version of Fig. 5c. Full circles indicate presence of the gene in the species and blanks indicate its absence. In the column MoeA, darker pink indicates the presence of more than one copy. Column MoeA represents all paralogs, except for Glp that is indicated in a separate column. The phyletic pattern is represented on a reference Actinobacteria tree. Actinomycetes class is indicated by a dashed line. Dots indicate UFB > 0.85. The scale bar represents the average number of substitutions per site.

Update of

References

    1. Hirota H, Ryter A, Jacob F. Thermosensitive mutants of E. coli affected in the processes of DNA synthesis and cellular division. Cold Spring Harb. Symp. Quant. Biol. 1968;33:677–693. doi: 10.1101/SQB.1968.033.01.077. - DOI - PubMed
    1. Du S, Lutkenhaus J. At the heart of bacterial cytokinesis: the Z ring. Trends Microbiol. 2019;27:781–791. doi: 10.1016/j.tim.2019.04.011. - DOI - PMC - PubMed
    1. den Blaauwen T, Hamoen LW, Levin PA. The divisome at 25: the road ahead. Curr. Opin. Microbiol. 2017;36:85–94. doi: 10.1016/j.mib.2017.01.007. - DOI - PMC - PubMed
    1. McQuillen R, Xiao J. Insights into the structure, function, and dynamics of the bacterial cytokinetic FtsZ-ring. Annu. Rev. Biophys. 2020;49:309–341. doi: 10.1146/annurev-biophys-121219-081703. - DOI - PMC - PubMed
    1. Donovan C, Bramkamp M. Cell division in Corynebacterineae. Front. Microbiol. 2014;5:132. doi: 10.3389/fmicb.2014.00132. - DOI - PMC - PubMed

Publication types

MeSH terms