. 2023 Sep 7;20(1):204.
doi: 10.1186/s12974-023-02889-5.

Supraphysiologic doses of 17β-estradiol aggravate depression-like behaviors in ovariectomized mice possibly via regulating microglial responses and brain glycerophospholipid metabolism

Affiliations

Supraphysiologic doses of 17β-estradiol aggravate depression-like behaviors in ovariectomized mice possibly via regulating microglial responses and brain glycerophospholipid metabolism

Ming Li et al. J Neuroinflammation. .

Abstract

Background: 17β-Estradiol (E2) is generally considered neuroprotective in humans. However, the current clinical use of estrogen replacement therapy (ERT) is based on the physiological dose of E2 to treat menopausal syndrome and has limited therapeutic efficacy. The efficacy and potential toxicity of superphysiological doses of ERT for menopausal neurodegeneration are unknown.

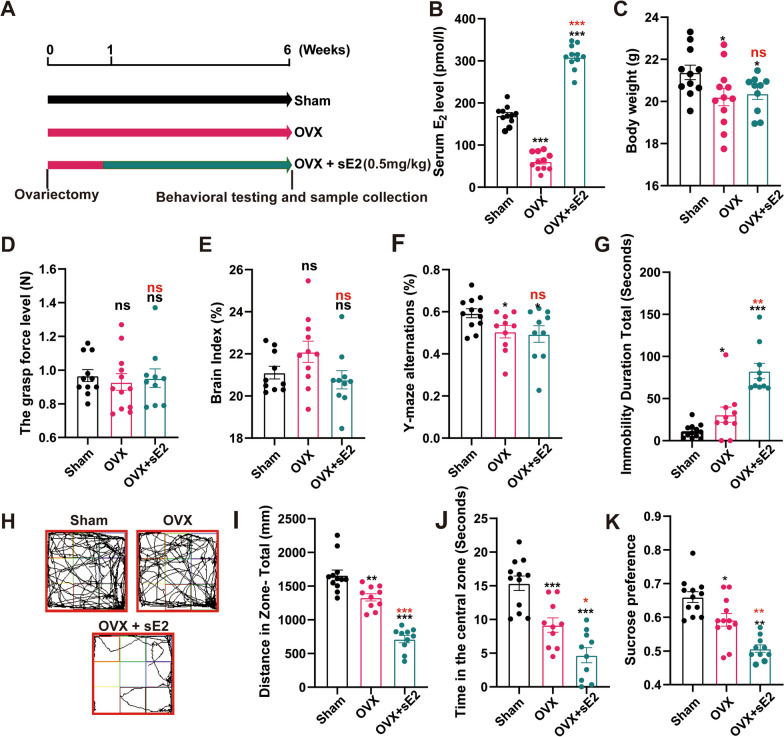
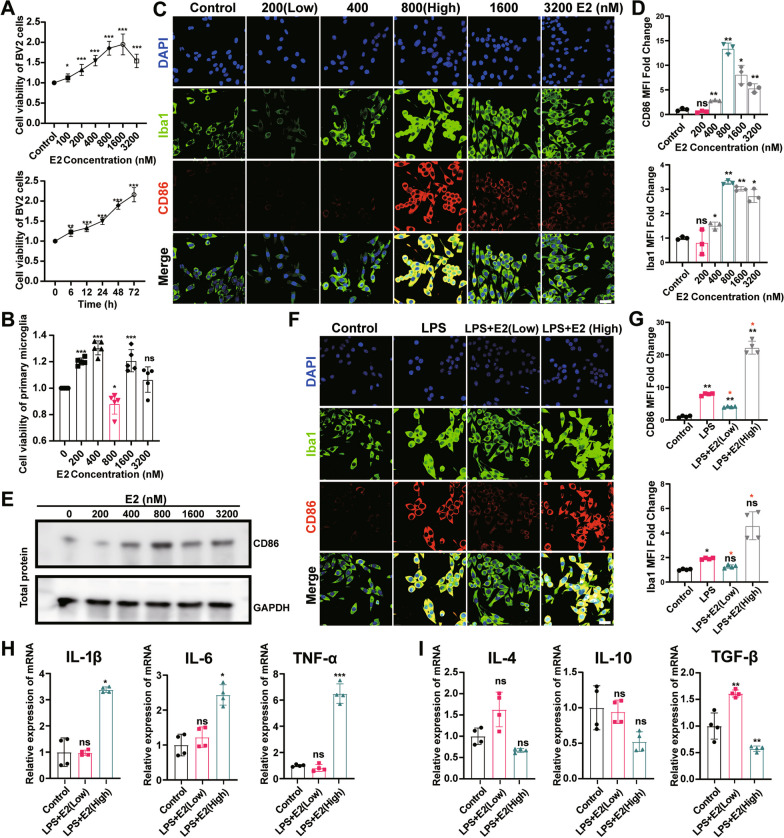
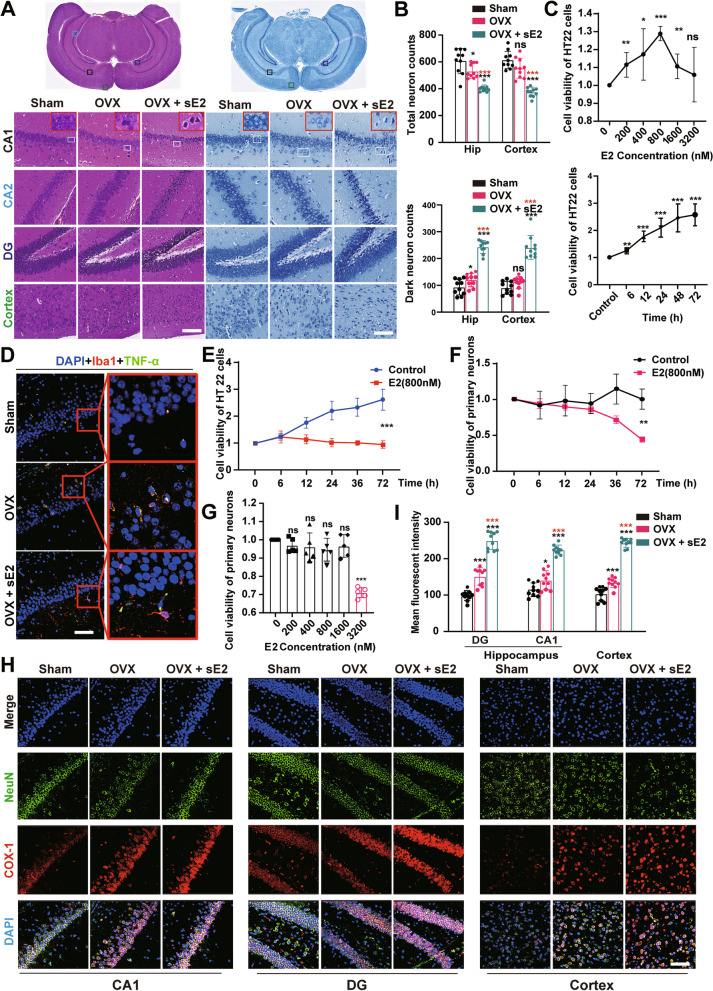
Methods: In this study, we investigated the effect of E2 with a supraphysiologic dose (0.5 mg/kg, sE2) on the treatment of menopausal mouse models established by ovariectomy. We performed the open field, Y-maze spontaneous alternation, forced swim tests, and sucrose preference test to investigate behavioral alterations. Subsequently, the status of microglia and neurons was detected by immunohistochemistry, HE staining, and Nissl staining, respectively. Real-time PCR was used to detect neuroinflammatory cytokines in the hippocampus and cerebral cortex. Using mass spectrometry proteomics platform and LC-MS/ MS-based metabolomics platform, proteins and metabolites in brain tissues were extracted and analyzed. BV2 and HT22 cell lines and primary neurons and microglia were used to explore the underlying molecular mechanisms in vitro.

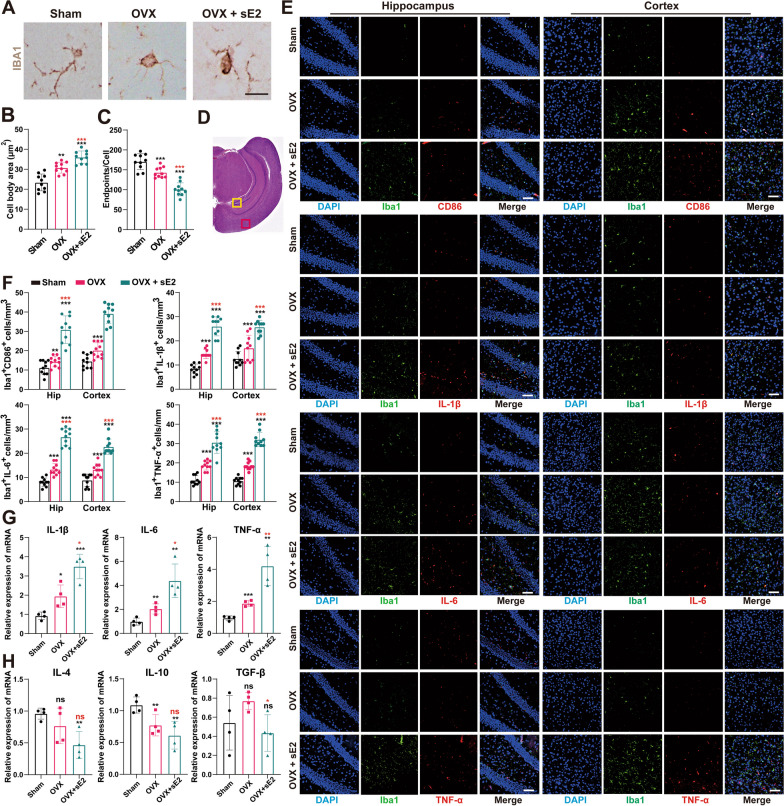
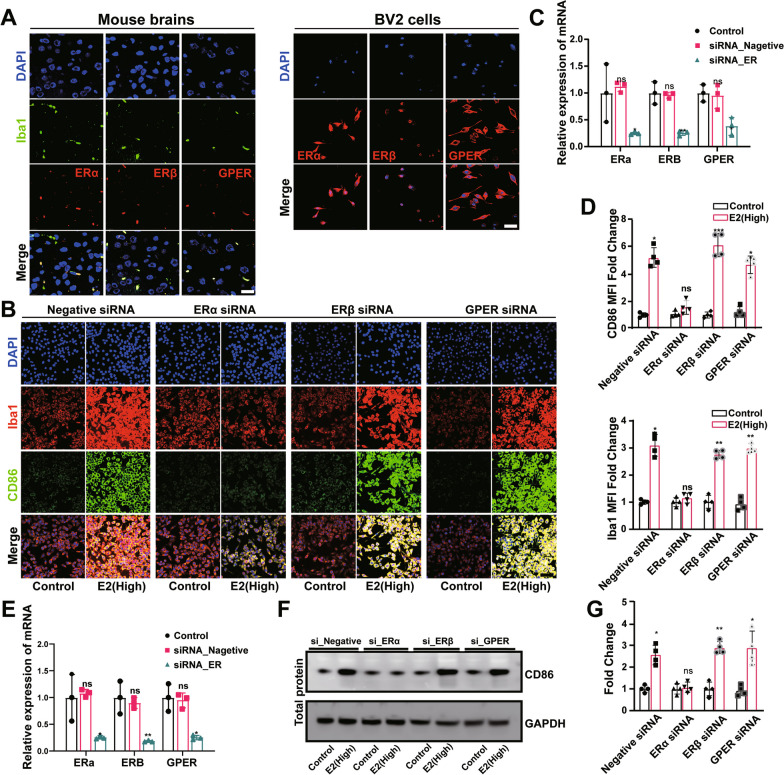
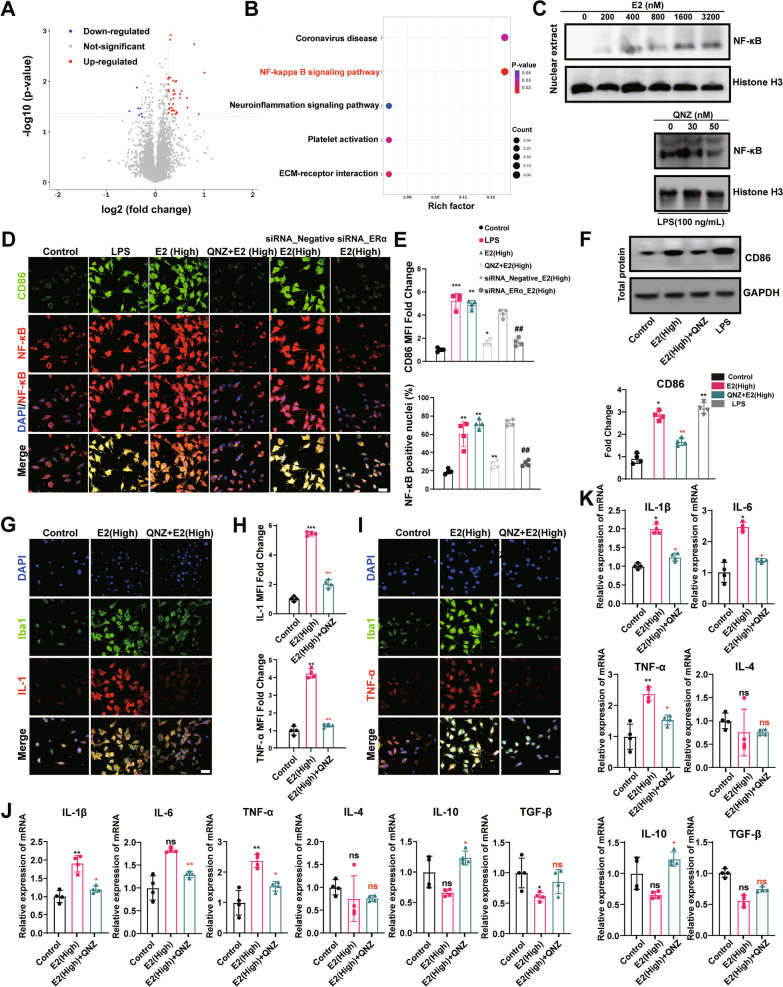
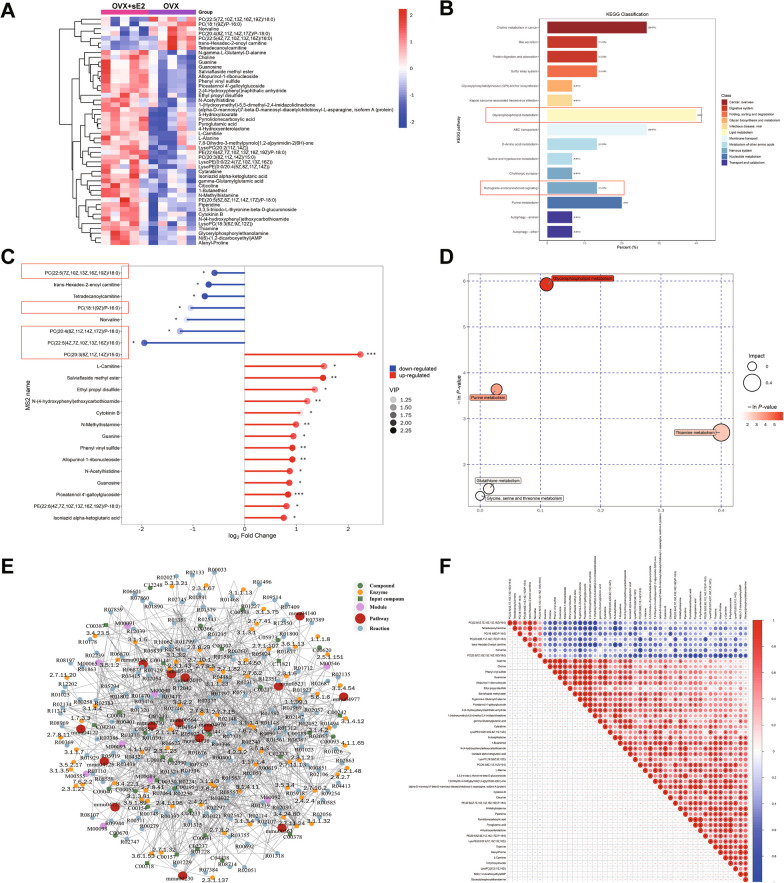
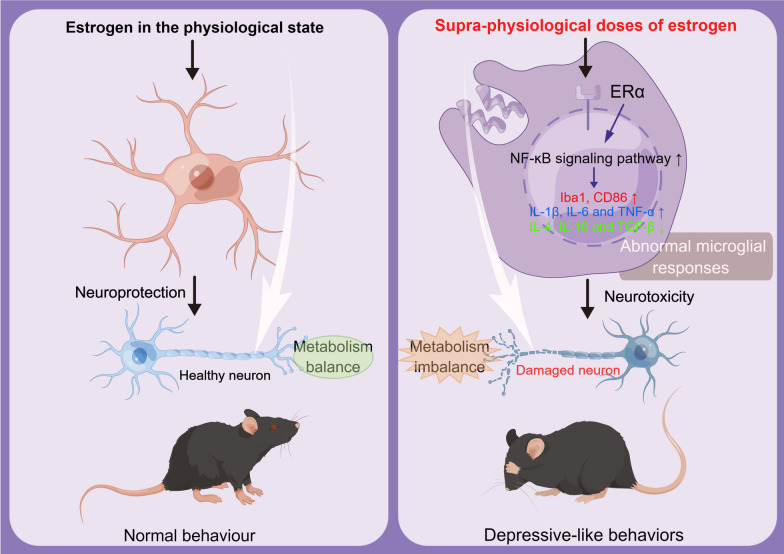
Results: sE2 aggravated depression-like behavior in ovariectomized mice, caused microglia response, and increased proinflammatory cytokines in the cerebral cortex and hippocampus, as well as neuronal damage and glycerophospholipid metabolism imbalance. Subsequently, we demonstrated that sE2 induced the pro-inflammatory phenotype of microglia through ERα/NF-κB signaling pathway and downregulated the expression of cannabinoid receptor 1 in neuronal cells, which were important in the pathogenesis of depression.

Conclusion: These data suggest that sE2 may be nonhelpful or even detrimental to menopause-related depression, at least partly, by regulating microglial responses and glycerophospholipid metabolism.

Keywords: 17β-Estradiol; Depression; Estrogen replacement therapy; Glycerophospholipid metabolism; Menopausal syndrome; Microglial.


Conflict of interest statement

The authors declare no competing interests.

Figures

Fig. 1
Fig. 1
Supraphysiological doses of 17β-Estradiol (sE2) exacerbate depression-like behaviors in ovariectomized mice. A Schematic illustration of the workflow of animal experiments. B Serum 17β-Estradiol levels in all groups of mice. C–E Body weight, grasp, and brain index in the different groups of mice before sacrifice. F Alternation score in the Y maze task. G The immobility time of mice in the forced swim test. Representative motion track (H), distance (I), and time spent in the center quadrant (J) of the mice in the open field. The sucrose preference index (K) was measured using sucrose preference test. Students t-test is performed to determine the significant difference based on P < 0.05 (*), P < 0.01 (**), and P < 0.001 (***), respectively, in comparison to the sham group (as indicated by black asterisks and “ns”) or the OVX group (as indicated by red asterisks). ns: not significant difference. Data are presented as mean ± the standard deviation (SD) of at least ten animals per group
Fig. 2
Fig. 2
Supraphysiological doses of 17β-Estradiol (sE2) exacerbate microglial response and neuroinflammation in the brains of ovariectomized mice. Immunohistochemical staining is used to label microglia in paraffin sections of mouse brain tissues with an anti-Iba1 antibody. Representative pictures (A) and quantification of the cell body area and endpoints of Iba1-labeled microglia in each group of mice (B, C). Bar = 5 µm. D Areas for immunofluorescence analysis marked on HE-stained coronal brain sections. The hippocampus is marked in yellow squares and the cortex is marked in red squares. E Typical images of microglia (Iba1-labeled) and M1 polarization markers (i.e., CD86, IL-1β, IL-6, and TNF-α) co-located by immunofluorescence. Bar = 50 µm. F Quantification of the number of positive cells for microglia M1 polarization markers per field in each group of mice. The mRNA levels of proinflammatory factors IL-1β, IL-6, and TNF-α (G), and anti-inflammatory factors IL-4, IL-10, and TGF-β (H) are evaluated by qPCR analysis. Student’s t-test is performed to determine the significant difference based on P < 0.05 (*), P < 0.01 (**), and P < 0.001 (***), respectively, in comparison to the sham group (as indicated by black asterisks and “ns”) or the OVX group (as indicated by red asterisks). ns: no statistical significance. Data are presented as mean ± the standard deviation (SD) of at least four animals per group
Fig. 3
Fig. 3
High concentrations of 17β-Estradiol (hE2) promote microglial microglial response. A Viability of BV-2 cells after treatment with E2 for various durations and concentrations. B Viability of primary microglia after treatment with E2 for various concentrations. BV2 cells are fixed and immunostained for Iba1 (green) and CD86 (red) (C, F). Bar = 30 µm. Cells are incubated with E2 of 0 nmol/L to 3200 nmol/L for 24 h (C, E) or pre‐treated with 100 ng/mL of LPS for 1 h and then co‐treated with LPS and E2 (200 or 800 nmol/L) for 24 h (F). The mean fluorescence intensity of CD86 or Iba1 and the levels of Iba1 intensity expressed as a relative change in comparison with untreated cells (D, G). E Representative band of protein expression. The mRNA levels of proinflammatory factors IL-1β, IL-6, and TNF-α (H), and anti-inflammatory factors IL-4, IL-10, and TGF-β (i) are evaluated by qPCR. Students t-test is performed to determine the significant difference based on P < 0.05 (*), P < 0.01 (**), and P < 0.001 (***), respectively, in comparison to the control group as indicated by black asterisks or ns and the LPS + E2 (Low) group as indicated by red asterisks. ns: no statistical significance. Data are presented as mean ± the standard deviation (SD). Each experiment is repeated independently in three
Fig. 4
Fig. 4
Microglial response caused by high-dose of estrogen (hE2) via ERα. A Representative images of microglia (Iba1-labeled) and estrogen receptors (Erα, ERβ, and GPER) co-located in mouse brain and BV2 cells by immunofluorescence. Bar = 15 μm. The siRNAs are used to suppress different estrogen receptors (ERs) in BV2 cells. Negative siRNA is used as the negative control. The effects of hE2 on CD86 and Iba1 are subsequently analyzed. B Representative images of microglia (Iba1-labeled) and M1 polarization markers (CD86) co-located by immunofluorescence. C qPCR analysis of ER proteins in BV2 cells transfected with different siRNAs to suppress the corresponding ER. D Quantification of the mean fluorescence intensity per cell with the indicated number of cells. E The siRNAs are used to suppress different estrogen receptors (ERs) in primary microglia. Results of qPCR analysis of ER proteins in primary microglia transfected with different siRNAs to suppress the corresponding ER. Representative band (F) and quantification (G) of protein expression in primary microglia. Students t-test is performed to determine the significant difference based on P < 0.05 (*), P < 0.01 (**), and P < 0.001 (***), respectively, in comparison to the control group as indicated by black asterisks or “ns” (i.e., no statistical significance). Data are presented as mean ± standard deviation (SD)
Fig. 5
Fig. 5
High concentrations of 17β-Estradiol (hE2) promote microglial response through the NF-κB signaling pathway. A Volcano plot of protein abundances changes in OVX vs. OVX + sE2 mice brians, based on proteomics analysis. B KEGG pathway enrichment analysis of differentially expressed proteins. QNZ is used as an inhibitor of NF-κB activation. The effects of hE2 on CD86 protein expression levels and NF-κB activation are analyzed. C Western blot analysis was used to examine the effects of E2 or QNZ of different concentrations on NF-κB activation in primary microglia. D Typical images of microglia M1 polarization markers (CD86 labeled) and NF-κB signaling pathway (p65) co-located in BV2 cells by immunofluorescence. Bar = 15 μm. E The relative quantification of CD86 and NF-κB-stained positive cells. Nuclear translocation of NF-κB is determined by immunofluorescence microscopy. F Representative band (up) and quantification (down) of protein expression in primary microglia. Typical images of microglia (Iba1-labeled) and NF-κB signaling pathway (IL-1 and TNFα) co-located in BV2 cells by immunofluorescence (G, I). Bar = 15 μm. H Quantification of the mean fluorescence intensity per cell with the indicated number of cells. The mRNA levels of proinflammatory factors IL-1β, IL-6, and TNF-α, and anti-inflammatory factors IL-4, IL-10, and TGF-β are evaluated by qPCR in primary microglia (K) or BV2 cells (J). Student’s t-test is performed to determine the significant difference based on P < 0.05 (*), P < 0.01 (**), and P < 0.001 (***), respectively, in comparison to the control group as indicated by black asterisks or “ns,” to the E2 (High) group as indicated by red asterisks, and to the siRNA negative group as indicated by symbol “#.” ns: no statistical significance. Data are presented as mean ± the standard deviation (SD). Each experiment is repeated independently three
Fig. 6
Fig. 6
Supraphysiological doses of 17β-Estradiol (sE2) exacerbate neuronal damage in ovariectomized mice. Representative images of HE (left) and Nissl (right) staining of coronal brain sections. Bar = 50 µm. Black, light blue, and dark blue boxes indicate the hippocampal CA1, CA2, and DG areas; green boxes indicate the cortex. B Quantification of total neuron (up) and cell death by Nissl staining in neurons (down). C Viability of HT22 cells treated with E2 for various treatment durations and concentrations. D Typical images of microglia (Iba1-labeled) and M1 polarization markers (TNF-α) co-located by immunofluorescence. Cytotoxicity is detected by CCK-8 assays. HT22 cells (E) or primary neurons (F) are cultured either in E2 alone or co-cultured with microglia for 0–72 h. G Viability of primary neurons treated with E2 of various concentrations. H Typical images of neurons (NeuN-labeled) and COX1 co-located by immunofluorescence. Bar = 50 µm. I Quantification of the mean fluorescence intensity of COX1 per NeuN+ cell for (H). Student’s t-test is performed to determine the significant difference based on P < 0.05 (*), P < 0.01 (**), and P < 0.001 (***), respectively, in comparison to the sham or control groups as indicated by black asterisks or “ns” and to the OVX group as indicated by red asterisks. ns: no significant difference. Data are presented as mean ± the standard deviation (SD). Each experiment is repeated independently three. Data are based on a minimum of 10 animals in each group
Fig. 7
Fig. 7
Analysis of untargeted metabolomics of brain from sE2‐treated OVX mice compared to vehicle‐treated OVX mice under positive ions. A Heatmap of 48 significantly changed metabolites based on untargeted metabolomics. B The KEGG enrichment analysis of the differential metabolites. The X-axis indicates the number of annotated metabolites under a given pathway as a percentage of all annotated metabolites. C Matchstick analysis of the differential metabolites. Red boxes are labeled for metabolites related to glycerophospholipid metabolism and retrograde endocannabinoid signaling. ANOVA is performed to determine the significant difference based on P < 0.05 (*), P < 0.01 (**), and P < 0.001 (***), respectively. D Pathway enrichment of differential metabolites. E Network analysis of the differential metabolites. F Heatmap of correlation analysis for differential metabolites. Each group contained 5 animals
Fig. 8
Fig. 8
Under normal physiological conditions, E2 maintains microglial stability, and brain metabolic balance, thereby exerting its neuroprotective effects. The supraphysiological doses of estrogen (sE2) treatment activate the ERα/NF-κB pathway, promote the microglial response and brain metabolic imbalance, and then induce the neuroinflammation-mediated neuronal damage, ultimately resulting in depressive-like behaviors in mice

Similar articles

Cited by

References

    1. Kim GD, Chun H, Doo M. Associations among BMI, dietary macronutrient consumption, and climacteric symptoms in korean menopausal women. Nutrients. 2020;12(4):945. doi: 10.3390/nu12040945. - DOI - PMC - PubMed
    1. Chu K, Shui J, Ma L, Huang Y, Wu F, Wei F, et al. Biopsychosocial risk factors of depression during the menopause transition in southeast China. BMC Womens Health. 2022;22(1):273. doi: 10.1186/s12905-022-01710-4. - DOI - PMC - PubMed
    1. Perich T, Ussher J. Stress predicts depression symptoms for women living with bipolar disorder during the menopause transition. Menopause. 2021;29(2):231–235. doi: 10.1097/GME.0000000000001894. - DOI - PubMed
    1. Slopien R, Pluchino N, Warenik-Szymankiewicz A, Sajdak S, Luisi M, Drakopoulos P, Genazzani A. Correlation between allopregnanolone levels and depressive symptoms during late menopausal transition and early postmenopause. Gynecol Endocrinol. 2018;34(2):144–147. doi: 10.1080/09513590.2017.1371129. - DOI - PubMed
    1. Han QQ, Shen SY, Chen XR, Pilot A, Liang LF, Zhang JR, et al. Minocycline alleviates abnormal microglial phagocytosis of synapses in a mouse model of depression. Neuropharmacology. 2022;220:109249. doi: 10.1016/j.neuropharm.2022.109249. - DOI - PubMed