. 2023 Sep 7;18(1):56.
doi: 10.1186/s13062-023-00401-w.

ILC1-derived IFN-γ regulates macrophage activation in colon cancer

Affiliations

ILC1-derived IFN-γ regulates macrophage activation in colon cancer

Yandong Zhang et al. Biol Direct. .

Erratum in

Abstract

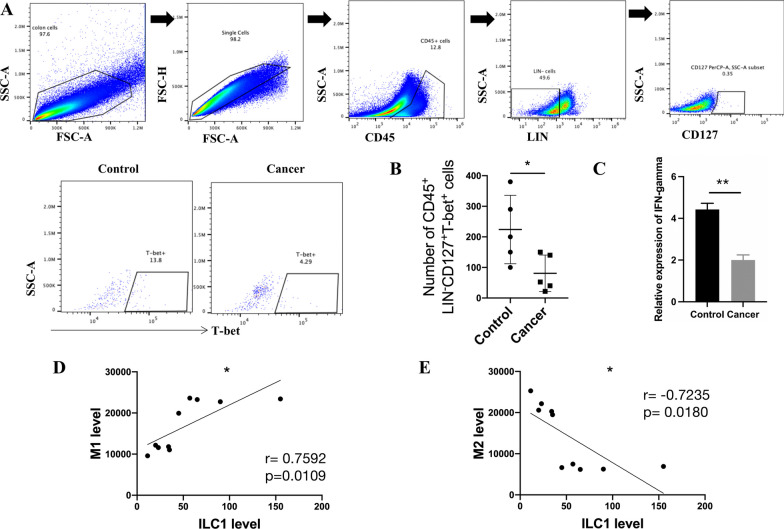
Background: Tumor-associated macrophages (TAMs) are an important subset of innate immune cells in the tumor microenvironment, and they are pivotal regulators of tumor-promoting inflammation and tumor progression. Evidence has proven that TAM numbers are substantially increased in cancers, and most of these TAMs are polarized toward the alternatively activated M2 phenotype; Thus, these TAMs strongly promote the progression of cancer diseases. Type 1 innate lymphocytes (ILC1s) are present in high numbers in intestinal tissues and are characterized by the expression of the transcription factor T-bet and the secretion of interferon (IFN)-γ, which can promote macrophages to polarize toward the classically activated antitumor M1 phenotype. However, the relationship between these two cell subsets in colon cancer remains unclear.

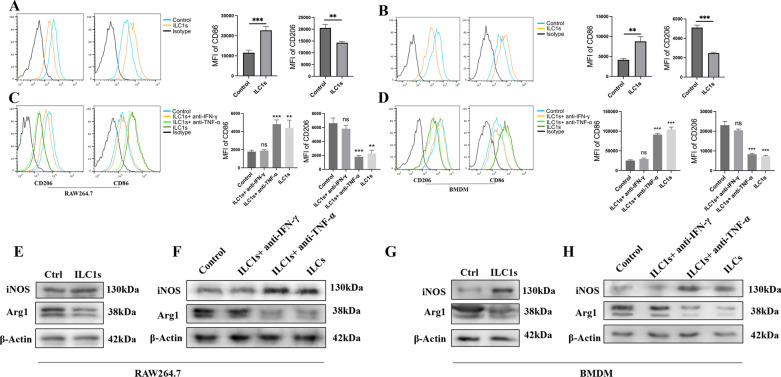
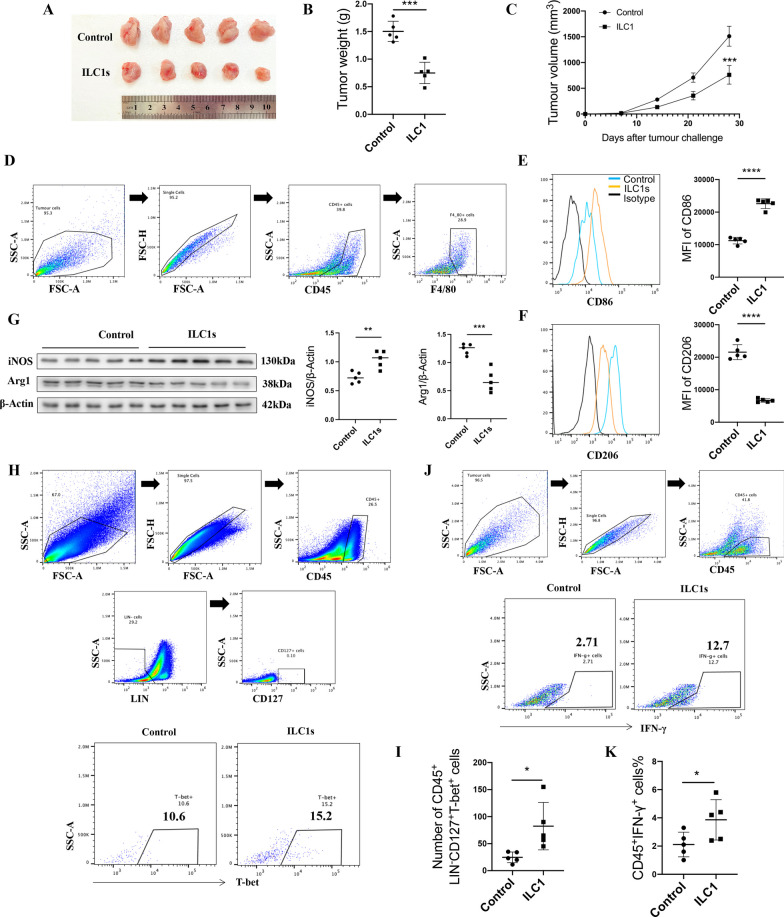
Methods: Flow cytometry was used to determine the percentages of M1-like macrophages, M2-like macrophages and ILC1s in colon cancer tissues and paracancerous healthy colon tissues in the AOM/DSS-induced mouse model of colon cancer. Furthermore, ILC1s were isolated and bone marrow-derived macrophages were generated to analyze the crosstalk that occurred between these cells when cocultured in vitro. Moreover, ILC1s were adoptively transferred or inhibited in vivo to explore the effects of ILC1s on tumor-infiltrating macrophages and tumor growth.

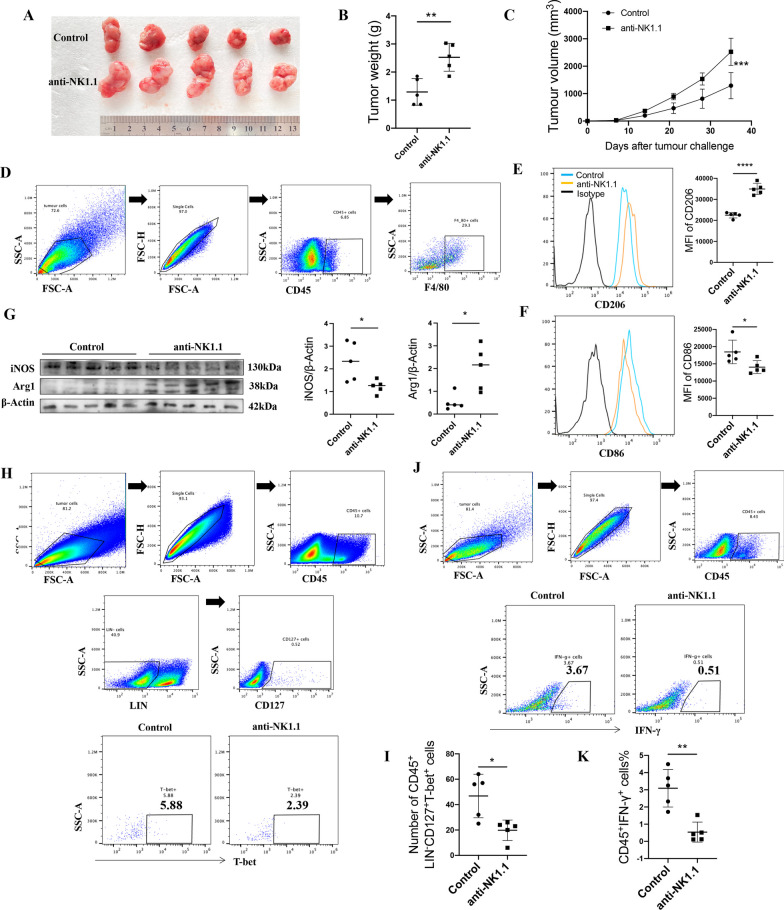
Results: We found that the percentages of M1-like macrophages and ILC1s were decreased in colon cancer tissues, and these populations were positively correlated. ILC1s promoted the polarization of macrophages toward the classically activated M1-like phenotype in vitro, and this effect could be blocked by an anti-IFN-γ antibody. The in vivo results showed that the administration of the Group 1 innate lymphocyte-blocking anti-NK1.1 antibody decreased the number of M1-like macrophages in the tumor tissues of MC38 tumor-bearing mice and promoted tumor growth, and adoptive transfer of ILC1s inhibited tumors and increased the percentage of M1-like macrophages in MC38 tumor-bearing mice.

Conclusions: Our studies preliminarily prove for the first time that ILC1s promote the activation of M1-like macrophages by secreting IFN-γ and inhibit the progression of colon cancer, which may provide insight into immunotherapeutic approaches for colon cancer.

Keywords: Colon cancer; Group 1 innate lymphocytes; IFN-γ; M1 macrophage; Tumor-associated macrophage.


Conflict of interest statement

The authors declare that they have no competing interests.

Figures

Fig. 1
Fig. 1
Macrophage CD206 expression is up-regulated in colon cancer tissue. A representative flow cytometry graphs of getting the colon cancer tissue and paracancer control tissue macrophage from AOM/DSS-induced mice colon cancer model, Fc-receptor-blocking antibody was used before staining the macrophage for flow cytometry analysis. B percentage of macrophage (CD45+F4/80+) in tumor tissue and control, n = 5. C, D CD206 mean fluorescence intensity (MFI) of macrophage (CD45+F4/80+CD206+) was detected by flow cytometry, n = 5. E, F CD86 MFI of macrophage (CD45+F4/80+CD86+) was detected by flow cytometry, n = 5. All the experiments repeated for 3 times. Data are shown as mean ± SD (n = 5 per group, *p < 0.05, **p < 0.01, ***p < 0.001, and *****p < 0.0001)
Fig. 2
Fig. 2
Percentage of ILC1s is positive correlation with the level of M1-like phenotype macrophage. A Representative flow cytometry graphs of ILC1s getting strategy in the colon cancer tissue and paracancer control tissue. B Relative number of ILC1s (CD45+LineageCD127+T-bet+) in tumor tissue and control, n = 5. C Relative expression of IFN-γ in cancer tissue and control was detected by RT-PCR. D, E The levels of tumor-infiltrated ILC1s compared to tumor-infiltrated macrophage CD86 MFI (M1 level) and macrophage CD206 MFI (M2 level) was made the regression analysis. All the experiments repeated for 3 times. Data are shown as mean ± SD (n = 5 per group, *p < 0.05, **p < 0.01, ***p < 0.001, and ***p < 0.0001)
Fig. 3
Fig. 3
ILC1s promote M1-like phenotype macrophage polarizing in vitro. Sorted ILC1s (1 × 105) from mouse spleen co-cultured with macrophage cell line RAW264.7 (2 × 104) and bone marrow-derived macrophage (BMDM) for 24 h. A representative flow cytometry graphs and statistical chart of the expression of CD206 and CD86 in ILC1s co-cultured RAW264.7 and control RAW264.7. B representative flow cytometry graphs and statistical chart of the expression of CD206 and CD86 in ILC1s co-cultured BMDM and control BMDM. C, D 10 µg/ml anti-IFN-γ and TNF-α were added to co-culture system, flow cytometry was used to detected the expression of CD206 and CD86 in RAW264.7 and BMDM of different treated groups. E, F Western blotting was used to detect the expression of iNOS and Arg-1 in ILC1s co-cultured, anti-IFN-γ and TNF-α treated co-culture system, and control RAW264.7. G, H western blotting was used to detect the expression of iNOS and Arg-1 in ILC1s co-cultured, anti-IFN-γ and TNF-α treated co-culture system, and control BMDM. All the experiments repeated for 3 times
Fig. 4
Fig. 4
Adoptively transferred ILC1s inhibit the tumor growth by promoting the M1-like phenotype macrophage polarization. AC the tumor graph, tumor weight, and tumor volume in 2 × 105 ILC1s adoptively transferred mice and control mice. D Representative flow cytometry graphs of getting the tumor tissue macrophage. E CD86 MFI of macrophage (CD45+F4/80+CD86+) in the tumor of ILC1s adoptively transferred mice and control mice was detected by flow cytometry. F CD206 MFI of macrophage (CD45+F4/80+CD206+) in the tumor of ILC1s adoptively transferred mice and control mice was detected by flow cytometry. G Western blotting was used to detect the expression of iNOS and Arg-1 in the tumor of ILC1s adoptively transferred mice and control mice. H Representative flow cytometry graphs of getting the tumor tissue ILC1s in different groups. I Percentage of ILC1s in different groups. J Representative flow cytometry getting strategy of the tumor tissue IFN-γ in different groups. K The expression level of IFN-γ in the tumor of ILC1s adoptively transferred mice and control mice. All the experiments repeated for 3 times, n = 5. Data are shown as mean ± SD (n = 5 per group, *p < 0.05, **p < 0.01, ***p < 0.001, and ****p < 0.0001)
Fig. 5
Fig. 5
Blocking ILC1s promoting the tumor growth of MC38 tumor-bearing mice by inhibiting the M1-like phenotype macrophage polarization. A–C The tumor graph, tumor weight, and tumor volume in ILC1s mice and control mice, n = 5. D Representative flow cytometry graphs of getting the tumor tissue macrophage. E CD86 MFI of M1-like phenotype macrophage (CD45+F4/80+CD86+) in the tumor of ILC1s-blocking mice and control mice was detected by flow cytometry, n = 5. F CD206 MFI of M2-like phenotype macrophage (CD45+F4/80+CD206+) in the tumor of ILC1s mice and control mice was detected by flow cytometry, n = 5. G Western blotting was used to detect the expression of iNOS and Arg-1 in the tumor of ILC1s mice and control mice. H Representative flow cytometry graphs of getting the tumor tissue ILC1s in different groups. I Relative number of ILC1s in different groups, n = 5. J Representative flow cytometry graphs of getting the tumor tissue IFN-γ in different groups. K The expression level of IFN-γ in the tumor of ILC1s mice and control mice, n = 5. All the experiments repeated for 3 times. Data are shown as mean ± SD (n = 5 per group, *p < 0.05, **p < 0.01, ***p < 0.001, and ****p < 0.0001)

Similar articles

Cited by

References

    1. Wen J, Min X, Shen M, Hua Q, Han Y, Zhao L, Liu L, Huang G, Liu J, Zhao X. ACLY facilitates colon cancer cell metastasis by CTNNB1. J Exp Clin Cancer Res: CR. 2019;38(1):401. doi: 10.1186/s13046-019-1391-9. - DOI - PMC - PubMed
    1. Otani K, Kawai K, Hata K, Tanaka T, Nishikawa T, Sasaki K, Kaneko M, Murono K, Emoto S, Nozawa H. Colon cancer with perforation. Surg Today. 2019;49(1):15–20. doi: 10.1007/s00595-018-1661-8. - DOI - PubMed
    1. Yang Y. Cancer immunotherapy: harnessing the immune system to battle cancer. J Clin Investig. 2015;125(9):3335–3337. doi: 10.1172/JCI83871. - DOI - PMC - PubMed
    1. Kouidhi S, Ben Ayed F, Benammar Elgaaied A. Targeting tumor metabolism: a new challenge to improve immunotherapy. Front Immunol. 2018;9:353. doi: 10.3389/fimmu.2018.00353. - DOI - PMC - PubMed
    1. Wagner M, Koyasu S. Cancer immunoediting by innate lymphoid cells. Trends Immunol. 2019;40(5):415–430. doi: 10.1016/j.it.2019.03.004. - DOI - PubMed

Publication types

Substances

LinkOut - more resources