. 2023 Aug 31;12(8):1283-1295.
doi: 10.21037/tau-23-101. Epub 2023 Aug 14.

NHERF1/EBP50 immunoexpression in renal cell carcinomas and oncocytomas with ultrastructural analysis of clear cell renal cell carcinoma

Affiliations

NHERF1/EBP50 immunoexpression in renal cell carcinomas and oncocytomas with ultrastructural analysis of clear cell renal cell carcinoma

Aliaksandr Aksionau et al. Transl Androl Urol. .

Abstract

Background: Na+/H+ exchanger (NHE) maintains the alkaline pH of epithelial cells working at the cellular membrane and exchanging H+/Na+ ions. In renal tubular epithelial cells, the reabsorption of NaCl is implemented by NHE3 isoform, which is regulated by NHE regulatory factor-1 (NHERF1). Normally situated at the apical zones of proximal tubular cells, NHERF1 participates in cytoskeletal reorganization and signal transduction facilitating structural stability and ion exchange. Based on an extensive search in English literature, NHERF1/EBP50 immunoexpression has been studied in breast, colon, and other tumors with only one study on 21 cases of renal cell carcinomas (RCC).

Methods: Using NHERF1/EBP50 immunohistochemistry (IHC) on 64 (82%) RCCs (34 clear cells, 21 papillary and 9 chromophobe types) and 14 (18%) oncocytomas, we evaluated and scored NHERF1/EBP50 immunoexpression depending on the World Health Organization (WHO)/International Society of Urological Pathology (ISUP) grading system followed by ultrastructural identification of microlumen-like structures (MLS) in clear cell renal cell carcinomas (ccRCC).

Results: Staining patterns varied throughout the tumors and within individual tumors. Only ccRCC showed unique MLS within the cytoplasm of tumor cells. All neoplasia-transformed tubular cells, regardless of the tumor grade and stage, had altered immunoexpression of NHERF1/EBP50 ranging from complete absence to aberrant expression in the luminal cell membrane, nuclear or cytoplasmic localizations.

Conclusions: Only ccRCC showed unique dot-like condensations of immunostaining/MLS at membranous, submembranous, and paranuclear localizations. The latter two localizations were mainly observed in the combined WHO/ISUP grade 1 and 2 group compared to the combined group of grade 3 and 4 tumor samples (P=0.0146 and P<0.0001, respectively). Ultrastructurally, the MLS were identified as thick microvilli trapped by a single-layer membrane, displaced into the cytoplasm and ranging from 400 nm to 3.5 µm. These significant ultrastructural reorganizations may contribute to tumor progression, metastasis, and drug resistance.

Keywords: NHERF1/EBP50; electron microscopy; microlumen; oncocytoma; renal cell carcinoma (RCC).


Conflict of interest statement

Conflicts of Interest: All authors have completed the ICMJE uniform disclosure form (available at https://tau.amegroups.com/article/view/10.21037/tau-23-101/coif). The authors have no conflicts of interest to declare.

Figures
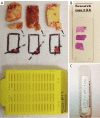
Figure 1
Figure 1
Sample processing. (A) Both main samples (marked with asterisks) and secondary samples (indicated by arrows with notations) are meticulously selected from grossly heterogeneous regions within the same tumor. (B) The accompanying photograph illustrates the visual representation of the main samples on a glass slide subsequent to histological processing. (C) The corresponding secondary samples are stored in a single container containing a 2.5% glutaraldehyde solution at pH 7.4.
Figure 2
Figure 2
NHERF1/EBP50 immunoexpression findings on light microscopy. (A) Within the benign renal parenchyma, proximal tubular epithelial cells demonstrate strong and linear luminal NHERF1/EBP50 immunoexpression (indicated by a black arrow), while cytoplasmic expression appears diffuse and weak (indicated by a white arrow). Glomerular podocytes (marked with an asterisk) exhibit focal and weak NHERF1/EBP50 immunopositivity. (B) In areas where clear cell renal cell carcinoma cells form tubules, NHERF1/EBP50 immunoexpression is comparable to the benign renal parenchyma, albeit with reduced intensity (luminal and cytoplasmic expression is denoted by black and white arrows, respectively). (C,D) Immunostaining of NHERF1/EBP50 in ccRCC cells reveals noteworthy condensations/microlumen-like structures in membranous (indicated by dashed arrows), submembranous (indicated by black arrows), and paranuclear (indicated by white arrows) localizations. Infrequently, weak NHERF1/EBP50 immunopositivity is observed in tumor cell nuclei (marked by arrowheads). (NHERF1/EBP50 immunostaining, 40×). NHERF1, Na+/H+ exchanger regulatory cofactor 1; ccRCC, clear cell renal cell carcinoma.
Figure 3
Figure 3
Density of microlumen-like structures with statistical analysis on the main 36 samples of 12 ccRCC cases. (A-C) MLS density in membranous, submembranous, and paranuclear localizations, respectively. (D-F) Comparison of MLS formation between tumors with WHO/ISUP grade 1 and 2 and those with grade 3 and 4, specifically in membranous, submembranous, and paranuclear sites, respectively. ccRCC, clear cell renal cell carcinoma; MLS, microlumen; WHO/ISUP, World Health Organization/International Society of Urological Pathology.
Figure 4
Figure 4
Transmission electron photomicrograph of microlumen-like structures with entrapped microvilli in paranuclear localizations in clear cell renal cell carcinoma cells. (A) An electron micrograph demonstrates the presence of microlumen-like structure (indicated by an arrow) adjacent to the nuclear karyolemma (marked by an asterisk). (B-D) Subsequent electron micrographs exhibit smaller microlumen-like structures (indicated by arrows) dispersed in the cytoplasm or positioned in close proximity to intracellular structures, specifically near the nuclei (indicated by asterisks). Images A, B, C represent case #11, while image D represents case #9.
Figure 5
Figure 5
Transmission electron photomicrograph of microlumen-like structures with entrapped microvilli in membranous and submembranous localizations in clear cell renal cell carcinoma cells. (A,B) Electron micrographs unveil the presence of distinct microlumen-like structures (indicated by arrows) situating between two cells, with clearly defined cytoplasmic membranes extending on either side of these formations. Notably, the erythrocyte (indicated by an arrowhead) and the tumor cell nucleus (marked by an asterisk) are also visible. (C,D) Notably, submembranous microlumen-like structures (indicated by arrows) are observed, displaying no connection with the neighboring cell membranes or surrounding cytoplasmic structures. Erythrocytes (indicated by an arrowhead) are also seen. Image A represents case #1, while images B and C correspond to case #8. Lastly, image D corresponds to case #2.

References

    1. Siegel RL, Miller KD, Fuchs HE, et al. Cancer statistics, 2022. CA Cancer J Clin 2022;72:7-33. 10.3322/caac.21708 - DOI - PubMed
    1. Capitanio U, Bensalah K, Bex A, et al. Epidemiology of Renal Cell Carcinoma. Eur Urol 2019;75:74-84. 10.1016/j.eururo.2018.08.036 - DOI - PMC - PubMed
    1. Nabi S, Kessler ER, Bernard B, et al. Renal cell carcinoma: a review of biology and pathophysiology. F1000Res 2018;7:307. 10.12688/f1000research.13179.1 - DOI - PMC - PubMed
    1. Young JR, Coy H, Douek M, et al. Clear Cell Renal Cell Carcinoma: Identifying the Loss of the Y Chromosome on Multiphasic MDCT. AJR Am J Roentgenol 2017;209:333-8. 10.2214/AJR.16.17010 - DOI - PubMed
    1. Cairns P. Renal cell carcinoma. Cancer Biomark 2010;9:461-73. 10.3233/CBM-2011-0176 - DOI - PMC - PubMed