Alzheimer's disease biomarker profiling in a memory clinic cohort without common comorbidities
- PMID: 37680670
- PMCID: PMC10481253
- DOI: 10.1093/braincomms/fcad228
Alzheimer's disease biomarker profiling in a memory clinic cohort without common comorbidities
Abstract
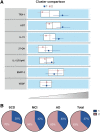
Alzheimer's disease is a multifactorial disorder with large heterogeneity. Comorbidities such as hypertension, hypercholesterolaemia and diabetes are known contributors to disease progression. However, less is known about their mechanistic contribution to Alzheimer's pathology and neurodegeneration. The aim of this study was to investigate the relationship of several biomarkers related to risk mechanisms in Alzheimer's disease with the well-established Alzheimer's disease markers in a memory clinic population without common comorbidities. We investigated 13 molecular markers representing key mechanisms underlying Alzheimer's disease pathogenesis in CSF from memory clinic patients without diagnosed hypertension, hypercholesterolaemia or diabetes nor other neurodegenerative disorders. An analysis of covariance was used to compare biomarker levels between clinical groups. Associations were analysed by linear regression. Two-step cluster analysis was used to determine patient clusters. Two key markers were analysed by immunofluorescence staining in the hippocampus of non-demented control and Alzheimer's disease individuals. CSF samples from a total of 90 participants were included in this study: 30 from patients with subjective cognitive decline (age 62.4 ± 4.38, female 60%), 30 with mild cognitive impairment (age 65.6 ± 7.48, female 50%) and 30 with Alzheimer's disease (age 68.2 ± 7.86, female 50%). Angiotensinogen, thioredoxin-1 and interleukin-15 had the most prominent associations with Alzheimer's disease pathology, synaptic and axonal damage markers. Synaptosomal-associated protein 25 kDa and neurofilament light chain were increased in mild cognitive impairment and Alzheimer's disease patients. Grouping biomarkers by biological function showed that inflammatory and survival components were associated with Alzheimer's disease pathology, synaptic dysfunction and axonal damage. Moreover, a vascular/metabolic component was associated with synaptic dysfunction. In the data-driven analysis, two patient clusters were identified: Cluster 1 had increased CSF markers of oxidative stress, vascular pathology and neuroinflammation and was characterized by elevated synaptic and axonal damage, compared with Cluster 2. Clinical groups were evenly distributed between the clusters. An analysis of post-mortem hippocampal tissue showed that compared with non-demented controls, angiotensinogen staining was higher in Alzheimer's disease and co-localized with phosphorylated-tau. The identification of biomarker-driven endophenotypes in cognitive disorder patients further highlights the biological heterogeneity of Alzheimer's disease and the importance of tailored prevention and treatment strategies.
Keywords: Alzheimer’s disease; biomarkers; cerebrospinal fluid; clustering; metabolic disorders.
© The Author(s) 2023. Published by Oxford University Press on behalf of the Guarantors of Brain.
Conflict of interest statement
W.J.G. and Y.W. are listed as inventors on the patent ‘Kit and method for quantitative detection of steroids’ US9851368B2. D.I. and A.C.-M. are employees of Sanofi. H.Z. has served at scientific advisory boards and/or as a consultant for Abbvie, Alector, Annexon, Artery Therapeutics, AZTherapies, CogRx, Denali, Eisai, Nervgen, Novo Nordisk, Pinteon Therapeutics, Red Abbey Labs, Passage Bio, Roche, Samumed, Siemens Healthineers, Triplet Therapeutics and Wave, has given lectures in symposia sponsored by Cellectricon, Fujirebio, Alzecure, Biogen and Roche, and is a co-founder of Brain Biomarker Solutions in Gothenburg AB, which is a part of the GU Ventures Incubator Program (outside submitted work). M.K. has served at scientific advisory boards at Biogen, Roche, Combinostics and Swedish Care International and given lectures in symposia sponsored by Biogen, Roche, Nutricia, Lundbeck and Nestlé. All other authors reported no biomedical financial interests or potential conflicts of interest.
Figures


References
Grants and funding
LinkOut - more resources
Full Text Sources
