. 2023 Jul 20:4:uqad033.
doi: 10.1093/femsml/uqad033. eCollection 2023.

The eukaryome of African children is influenced by geographic location, gut biogeography, and nutritional status

Collaborators, Affiliations

The eukaryome of African children is influenced by geographic location, gut biogeography, and nutritional status

Pascale Vonaesch et al. Microlife. .

Abstract

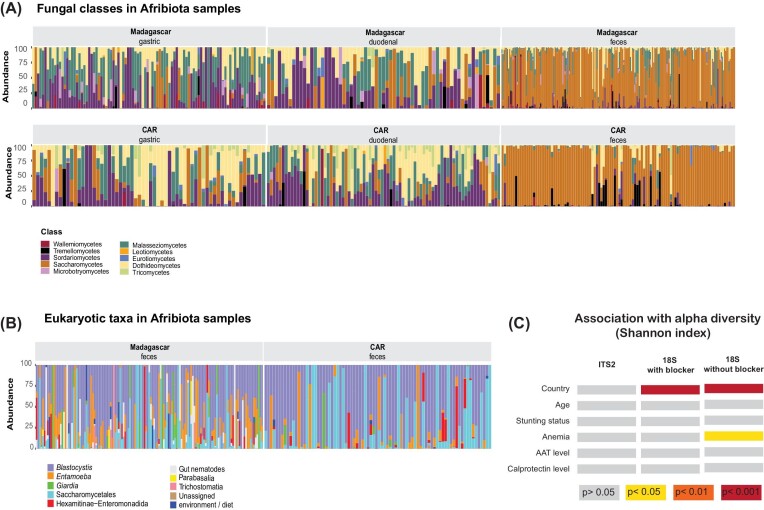
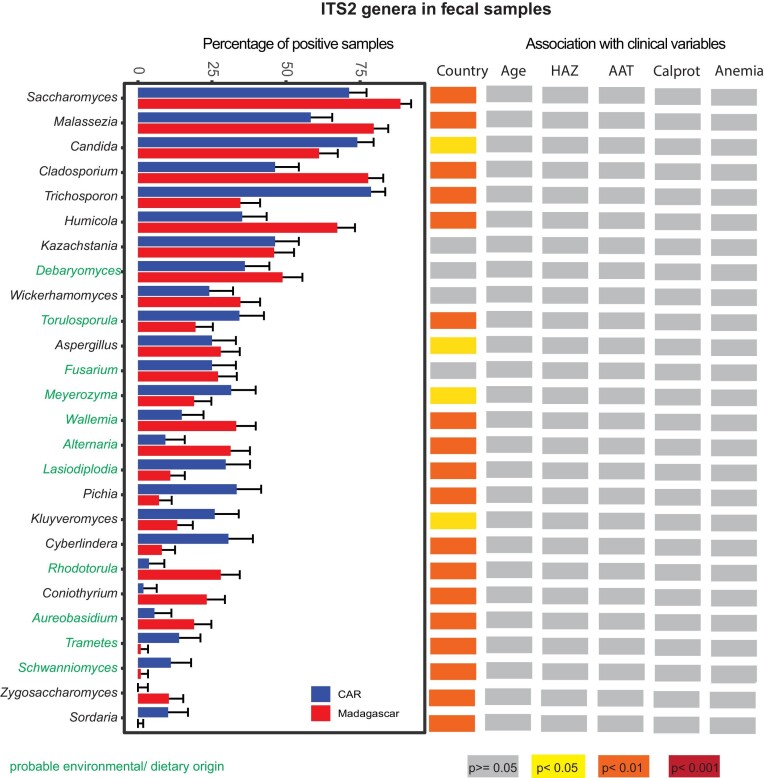
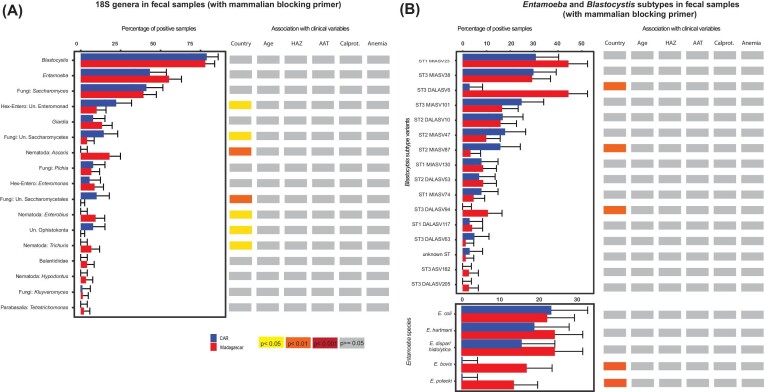
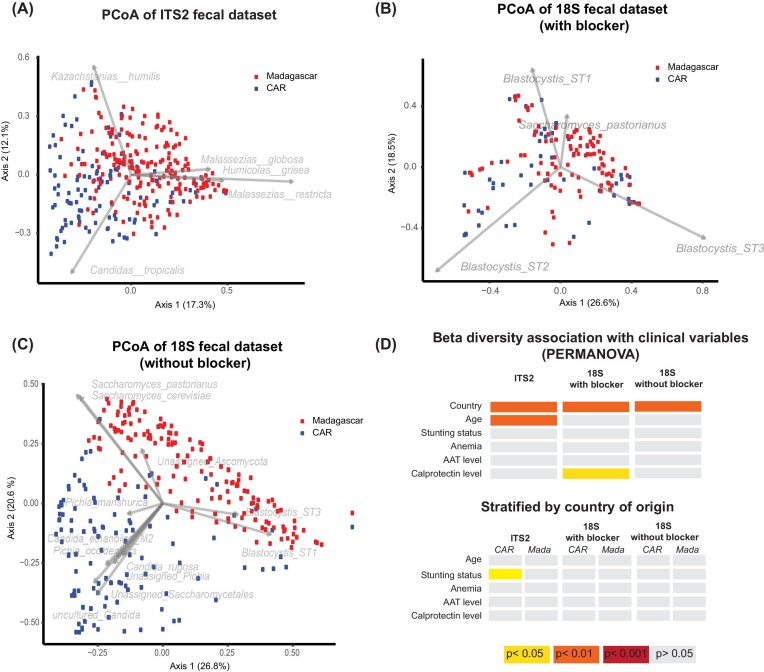
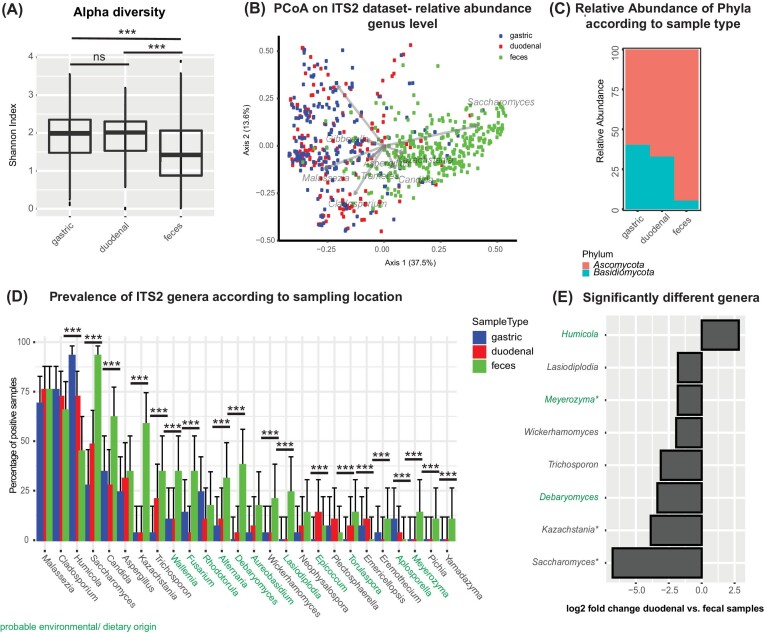
Eukaryotes have historically been studied as parasites, but recent evidence suggests they may be indicators of a healthy gut ecosystem. Here, we describe the eukaryome along the gastrointestinal tract of children aged 2-5 years and test for associations with clinical factors such as anaemia, intestinal inflammation, chronic undernutrition, and age. Children were enrolled from December 2016 to May 2018 in Bangui, Central African Republic and Antananarivo, Madagascar. We analyzed a total of 1104 samples representing 212 gastric, 187 duodenal, and 705 fecal samples using a metabarcoding approach targeting the full ITS2 region for fungi, and the V4 hypervariable region of the 18S rRNA gene for the overall eukaryome. Roughly, half of all fecal samples showed microeukaryotic reads. We find high intersubject variability, only a handful of taxa that are likely residents of the gastrointestinal tract, and frequent co-occurrence of eukaryotes within an individual. We also find that the eukaryome differs between the stomach, duodenum, and feces and is strongly influenced by country of origin. Our data show trends towards higher levels of Fusarium equiseti, a mycotoxin producing fungus, and lower levels of the protist Blastocystis in stunted children compared to nonstunted controls. Overall, the eukaryome is poorly correlated with clinical variables. Our study is of one of the largest cohorts analyzing the human intestinal eukaryome to date and the first to compare the eukaryome across different compartments of the gastrointestinal tract. Our results highlight the importance of studying populations across the world to uncover common features of the eukaryome in health.

Keywords: Sub-Saharan Africa; biogeography; fungi, protists; human intestinal eukaryome; microbiota.


Conflict of interest statement

None declared.

Figures

Figure 1.
Figure 1.
Composition of the Afribiota samples as revealed by ITS2 sequencing targeting fungi (A), the broader 18S primers using a mammalian blocker (B) as well as association of the overall diversity with different clinical outcomes (C). Significant association with the Shannon index as a measure of alpha diversity were assessed using a Wilcoxon rank-sum test. The colour code illustrating the degree of significance of the association is given on the bottom of the figure.
Figure 2.
Figure 2.
Differences in the fecal mycobiome in relation to geographic location and different clinical outcomes. Samples were considered to be positive for a given genus if they had at least a single reads relating to this genus. Genera indicated in green are of probable environmental origin. Groups were compared using the Pearson chi-squared test and Benjamini–Hochberg correction for multiple testing. The colour code illustrating the degree of significance of the association is given on the bottom of the figure.
Figure 3.
Figure 3.
Differences in the fecal microeukaryome in relation to geographic location and clinical variables. (A) All genera as detected by 18S sequencing using a mammalian blocking primer and (B) split in different Blastocystis clusters or Entamoeba species based on phylogenetic trees. Samples were considered to be positive for a given genus if they had at least a single sequence relating to this genus. Groups were compared using the Pearson chi-squared test and Benjamini–Hochberg correction for multiple testing. The colour code illustrating the degree of significance of the association is given on the bottom of the figure.
Figure 4.
Figure 4.
Differences in the microeukaryome (18S dataset) based on country of origin. PCoA plot based on the normalized Bray–Curtis dissimilarity index (log10) of the fecal dataset iteratively rarefied to 1000 microeukaryotic reads (A) with the ITS2 primers targeting fungi (CAR: n = 100, Madagascar: n = 202), (B) with a mammalian blocker using 18S primers (CAR: n = 54, Madagascar: n = 99), (C) without a mammalian blocker using 18S primers (CAR: n = 110, Madagascar: n = 154). Samples from CAR are coloured in blue, samples from Madagascar in red. (D) Association of different clinical factors with Beta Diversity using a Permanova analysis on dispersion. The colour code is given in the figure.
Figure 5.
Figure 5.
Differences in the mycobiome along the GI tract. (A) Alpha diversity in the different compartments as measured by the Shannon index. (B) PCoA plot based on the normalized Bray–Curtis dissimilarity index (log10) of the dataset iteratively rarefied to 5000 fungal sequences (gastric: N = 148, duodenal: N = 132, and feces: N=299). (C) Relative abundance of the different phyla according to sample type. (D) Differences in the mycobiome in relation to sampling location along the GI tract. Samples were considered to be positive for a given genus if they had at least a single sequence relating to this genus. Groups were compared using the Pearson chi-squared test and Benjamini–Hochberg correction for multiple testing. *P < .05; **P < .01; ***P < .005; comparison without an indication are nonsignificant. (E) Fungal genera showing significant differences in their relative abundance between duodenal and fecal samples in a DeSeq2 model correcting for sequencing depth.

References

    1. Alfellani MA, Stensvold CR, Vidal-Lapiedra Aet al. Variable geographic distribution of Blastocystis&nbsp;subtypes and its potential implications. Acta Trop. 2013;126:11–18. 10.1016/j.actatropica.2012.12.011. - DOI - PubMed
    1. Anders S, Huber W. Differential expression analysis for sequence count data. Genome Biol. 2010;11:R106. 10.1186/gb-2010-11-10-r106. - DOI - PMC - PubMed
    1. Anders S, McCarthy DJ, Chen Yet al. Count-based differential expression analysis of RNA sequencing data using R and Bioconductor. Nat Protoc. 2013;8:1765–86. 10.1038/nprot.2013.099. - DOI - PubMed
    1. Andersen LO, Stensvold CR. Blastocystis&nbsp;in health and disease: are we moving from a clinical to a public health perspective?. J Clin Microbiol. 2016;54:524–8. 10.1128/JCM.02520-15. - DOI - PMC - PubMed
    1. Arrieta MC, Arévalo A, Stiemsma Let al. Associations between infant fungal and bacterial dysbiosis and childhood atopic wheeze in a nonindustrialized setting. J Allergy Clin Immunol. 2018;142:424–34. 10.1016/j.jaci.2017.08.041. - DOI - PMC - PubMed

LinkOut - more resources