. 2023 Sep 15;150(18):dev201767.
doi: 10.1242/dev.201767. Epub 2023 Sep 27.

Single-cell transcriptomics identifies new blood cell populations in Drosophila released at the onset of metamorphosis

Affiliations

Single-cell transcriptomics identifies new blood cell populations in Drosophila released at the onset of metamorphosis

Alexander Hirschhäuser et al. Development. .

Abstract

Drosophila blood cells called hemocytes form an efficient barrier against infections and tissue damage. During metamorphosis, hemocytes undergo tremendous changes in their shape and behavior, preparing them for tissue clearance. Yet, the diversity and functional plasticity of pupal blood cells have not been explored. Here, we combine single-cell transcriptomics and high-resolution microscopy to dissect the heterogeneity and plasticity of pupal hemocytes. We identified undifferentiated and specified hemocytes with different molecular signatures associated with distinct functions such as antimicrobial, antifungal immune defense, cell adhesion or secretion. Strikingly, we identified a highly migratory and immune-responsive pupal cell population expressing typical markers of the posterior signaling center (PSC), which is known to be an important niche in the larval lymph gland. PSC-like cells become restricted to the abdominal segments and are morphologically very distinct from typical Hemolectin (Hml)-positive plasmatocytes. G-TRACE lineage experiments further suggest that PSC-like cells can transdifferentiate to lamellocytes triggered by parasitoid wasp infestation. In summary, we present the first molecular description of pupal Drosophila blood cells, providing insights into blood cell functional diversification and plasticity during pupal metamorphosis.

Keywords: Drosophila; Blood; Hemocytes; Lamellocytes; Migration; PSC; Plasmatocytes; Progenitor; scRNA-seq analysis.


Conflict of interest statement

Competing interests The authors declare no competing or financial interests.

Figures
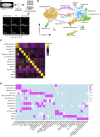
Fig. 1.
Fig. 1.
scRNA-seq analysis of pupal Drosophila hemocytes reveals a remarkable cellular heterogeneity. (A) Workflow for the full-length SMART scRNA-Seq approach using the ICELL8 platform. Only wells containing single cells were selected using the CellSelect Software prior to the on-chip RT-reaction, library preparation and sequencing. Example images of Lsp-Bomanin-PL, PSC and Secretory-PL cells are shown. (B) UMAP plot of 2811 high-quality cells in 14 transcriptomically distinct clusters. (C) Heatmap of the top 50 differentially regulated genes per cluster. (D) Transcription factor activity of selected transcription factors identified by SCENIC (Aibar et al., 2017).
Fig. 2.
Fig. 2.
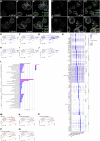
Identification of several undifferentiated plasmatocyte populations. (A,B) UMAP plots. srp is highly expressed (A) and active (B) in several clusters. (C,C′) Confocal images of pupal hemocytes expressing srpHemo-3xmCherry; white arrowheads highlight low-expressing cells. The data show representative images replicated in three independent experiments. Scale bar: 10 µm. (D) Dotplot showing the average expression and percentage expression per cluster for marker genes of clusters with high srp expression: undifferentiated PL, transitory PL-1, PL-2 and Osiris-PL. (E-I) Expression of transitory PL-1 markers on UMAP plots. (E) Expression of CG8046, an undifferentiated PL marker. (F) CG4822 expression is also detected in undifferentiated PL cells. (G) CG31141 expression is also detected in the Spermatid-Marker-PL cluster. (H) Combined expression of CG4822 and CG31141 is only detected in the transitory PL-1 cluster. (I,J) Monocle3 pseudotime analysis. (I) Pseudotime trajectory on a UMAP plot. (J) UMAP plot with pseudotime trajectory and cells colored based on pseudotime. (K,L) Expression of marker genes on UMAP plots. (K) CG13012, identified as a marker for the transitory PL-2 cluster. (L) grindelwald (grnd), identified as a marker for the Osiris-PL cluster.
Fig. 3.
Fig. 3.
Identification of effector cells with distinct molecular signatures. (A-B″) Confocal images of pupal hemocytes stained with an anti-Grindelwald (Grnd) antibody. Yellow arrowheads indicate plasmatocytes with marked Grnd expression. Scale bars: 10 µm. (C-D″) Confocal images of pupal hemocytes stained with an anti-Tlp94D antibody. Yellow arrowheads indicate plasmatocytes with marked Grnd expression. Scale bars: 10 µm. (E-J) Expression of selected markers on UMAP plots. (E) mil is a marker for the Spermatid-Marker-PL cluster. (F) Lsp1α is expressed in Lsp-Bomanin-PL cells. (G) 28SrRNA-Psi:CR40596 is highly expressed in the OxPhos-PL cluster. (H) CG6426 is a marker for the Adhesive-PL cluster. (I) CG15905 marks the Adhesive-PL cluster. (J) CG5402 marks the AMP-PL cluster. (K) Dotplot of selected marker genes with average expression and percent expression per cluster for the following clusters: Spermatid-Marker-PL, Lsp-Bomanin-PL, OxPhos-PL, Chitinase-PL, Adhesive-PL and AMP-PL. ECM, extracellular matrix. (L) Representative terms of the top seven annotation clusters identified with DAVID 2021 GO term analysis of DEGs of the clusters Spermatid-Marker-PL, Lsp-Bomanin-PL, OxPhos-PL, Chitinase-PL, Adhesive-PL and AMP-PL. The bar length reflects the enrichment score of the annotation cluster and is colored based on the P-value of the GO term. (M-Q) Activity of transcription factors on UMAP plots identified with SCENIC. (M) Rel is highly active in Precursor-PL-3, AMP-PL and Chitinase-PL clusters. (N-P) CG34367 (N), CG11294 (O) and HGTX (P) are active in the Spermatid-Marker-PL cluster. (Q) abd-A is active in the Chitinase-PL cluster. The data show representative images replicated in three independent experiments.
Fig. 4.
Fig. 4.
Secretory-PL are transcriptomically distinct from other pupal blood cell types. (A-D) UMAP plots showing the expression of Secretory-PL markers. (A) CG31174 is specific for Secretory-PL. (B-D) Tep4 (B), ham (C) and Ance (D) expression can also be detected in PSC cells. (E) Average expression and percentage expression of Secretory-PL markers on a dotplot. Note the importance of many genes in immunity or their function in proteolysis. (F,G) Activity of CrebA (F) and dl (G), transcription factors that are highly active in the Secretory-PL cluster on UMAP plots as identified by SCENIC. (H-L‴) Maximum intensity projections of confocal images of pupal hemocytes expressing GFP; cells with plasmatocyte-like cell shape are marked by white arrowheads; small spiky cells with filopodial protrusions are marked by yellow arrowheads; Alexa 568-labeled phalloidin was used to stain the actin cytoskeleton. (H) Tep4-Gal4. (I) Ham-Gal4. (J) Ancemimic-GFP. (K) CG31174mimic-GFP. (L-L‴) Small spiky cells are not CG31174 positive. CG31174mimic-GFP co-expressing Tep4-Gal4-nls-mCherry. Small spiky cells are marked by a yellow arrowhead and plasmatocyte-like shaped cells co-expressing both markers are marked by a white arrowhead. The data show representative images replicated in three independent experiments. Scale bars: 10 µm.
Fig. 5.
Fig. 5.
Identification of individual PSC cells in pupae. (A-C) Expression of the PSC markers kn (A), Antp (B) and tau (C) on UMAP plots. (D) Dotplot with average expression and percentage of expression of PSC markers. (E,F) Activity of transcription factors kn (E) and Antp (F) on UMAP plots. (G-J) Maximum intensity projections of confocal images of the actin cytoskeleton in pupal macrophages; phalloidin (white) was used to stain the actin cytoskeleton and DAPI for the nuclei (blue). The data show representative images replicated in three independent experiments. (G) PSC cells and Secretory-PL cells represent different cell types. CG31174 mimic-GFP co-expressing kn-Gal4-mCherry. PSC cells are marked by a yellow arrowhead and CG31174-positive cells are marked by a white arrowhead. (H) kn-Gal4 driving UAS-GFP. (I) Antp-Gal4 driving UAS-GFP. (J) tau-Gal4 driving UAS-GFP. (K) Quantification of GFP-positive spiky PSC cells, GFP-positive and GFP-negative cells with plasmatocyte morphology frequency represented by kn, pupal (n=638; GFP-positive=4.4% spiky and 10.8% round); kn, larval (n=351; GFP-positive: 0% spiky, 3.4% round); tau, pupal (n=464; GFP-positive: 1.4% spiky and 0% round). No tau-positive cells were found in larval bleeds. CG31174: n=359; GFP-positive=24.5%; GFP-negative=75%. Cells were obtained from six individual experiments. Scale bars: 10 µm.
Fig. 6.
Fig. 6.
PSC cells can differentiate into lamellocytes upon wasp infestation. (A) Schematic overview of the G-TRACE system. (B-B‴) Activation of G-TRACE with tau-Gal4 results in labeling of PCS cells of third instar lymph gland. No expression can be observed in other cells outside the PSC region. (C-D‴) Maximum intensity projections of confocal images of isolated pupal macrophages. Cell lineage analysis was done using tau>G-TRACE. Green arrowheads mark a GFP-positive lamellocyte derived from PSC cells. Other lamellocytes are GFP negative and may thus be differentiated from other cellular sources. Atilla-positive lamellocytes are marked by yellow arrowheads. Scale bars: 10 µm. (E) Quantification of tau>G-TRACE GFP-positive lamellocytes. n=157 lamellocytes. (F-G′) Third instar larval lymph gland expressing GFP (green) under the control of tau-Gal4 driver co-stained with DAPI (white). (F′,F″) Control lymph gland with prominent expression of GFP in the PSC region of primary lobes. (G′,G″) Wasp-infested lymph gland disintegrates prematurely resulting in a reduced overall cell number. Scale bars: 100 μm (F,G); 50 µm (F′,G′). (H,I) Quantification of tau-marked PSC cells (H) and overall lymph gland cell number (I) stained with DAPI confirmed a premature dissociation of the Wasp-infested lymph glands. *P=0.013, **P=0.01 (Mann–Whitney test). Error bars represent s.d. n=10 lobes each. (J,K) Maximum intensity projections of confocal images of pupal hemocytes. Phalloidin was used to stain the actin cytoskeleton (F-actin). The PSC cell is marked by EGFP expression driven by kn-Gal4 (J) and tau-Gal4 (K). Green arrowhead indicates PSC cells. Scale bars: 10 µm. The data show representative images replicated in three independent experiments.
Fig. 7.
Fig. 7.
PSC cells are highly motile and immune-responsive cells. (A,B) Frames of spinning disk time-lapse movies of randomly migrating 4 h (A) and 16 h (B) APF pupal hemocytes marked by GFP expression under the control of tau-Gal4. The time point of each image is annotated. Scale bars: 20 µm. (C) Co-labeling of EGFP-marked PSC cell with Hml-dsRed-positive plasmatocytes in a 16 h APF pupa. The PSC cell extends dynamic filopodial protrusions towards plasmatocytes. White arrowheads indicate filopodial protrusions of PSC cells. Dashed box indicates the area enlarged in subsequent images. (D) Still images of a spinning disk time-lapse movie of a tau-marked PSC cell (marked by a yellow arrowhead) migrating towards the wound site. At the wound site, the tau-marked PSC cell forms a typical phagocytic cup. An ablated PSC cell is marked by an asterisk. (E) Quantification of phagocytosis activity of isolated tau-marked cells compared with professional Hml-marked phagocytes. ****P<0.0001 (Mann–Whitney Test). Error bars represent s.d. n=30 cells. The data show representative images replicated in three independent experiments. Scale bars: 20 μm.

References

    1. Aibar, S., González-Blas, C. B., Moerman, T., Huynh-Thu, V. A., Imrichova, H., Hulselmans, G., Rambow, F., Marine, J.-C., Geurts, P., Aerts, J.et al. (2017). SCENIC: single-cell regulatory network inference and clustering. Nat. Methods 14, 1083-1086. 10.1038/nmeth.4463 - DOI - PMC - PubMed
    1. Anderl, I., Vesala, L., Ihalainen, T. O., Vanha-Aho, L.-M., Andó, I., Rämet, M. and Hultmark, D. (2016). Transdifferentiation and proliferation in two distinct hemocyte lineages in Drosophila melanogaster larvae after Wasp infection. PLoS Pathog. 12, e1005746. 10.1371/journal.ppat.1005746 - DOI - PMC - PubMed
    1. Andersen, D. S., Colombani, J., Palmerini, V., Chakrabandhu, K., Boone, E., Röthlisberger, M., Toggweiler, J., Basler, K., Mapelli, M., Hueber, A.-O.et al. (2015). The Drosophila TNF receptor Grindelwald couples loss of cell polarity and neoplastic growth. Nature 522, 482-486. e1005746. 10.1038/nature14298 - DOI - PubMed
    1. Bajzek, C., Rice, A. M., Andreazza, S. and Dushay, M. S. (2012). Coagulation and survival in Drosophila melanogaster fondue mutants. J. Insect Physiol. 58, 1376-1381. 10.1016/j.jinsphys.2012.07.013 - DOI - PubMed
    1. Baldeosingh, R., Gao, H., Wu, X. and Fossett, N. (2018). Hedgehog signaling from the posterior signaling center maintains U-shaped expression and a prohemocyte population in Drosophila. Dev. Biol. 441, 132-145. 10.1016/j.ydbio.2018.06.020 - DOI - PMC - PubMed

Publication types

Substances