. 2023 Nov;22(11):e13980.
doi: 10.1111/acel.13980. Epub 2023 Sep 8.

A single-cell transcriptomic atlas characterizes age-related changes of murine cranial stem cell niches

Affiliations

A single-cell transcriptomic atlas characterizes age-related changes of murine cranial stem cell niches

Bo Li et al. Aging Cell. 2023 Nov.

Abstract

The craniofacial bones provide structural support for the skull and accommodate the vulnerable brain tissue with a protective cavity. The bone tissue undergoes constant turnover, which relies on skeletal stem cells (SSCs) and/or mesenchymal stem cells (MSCs) and their niches. SSCs/MSCs and their perivascular niche within the bone marrow are well characterized in long bones. As for cranial bones, besides bone marrow, the suture mesenchyme has been identified as a unique niche for SSCs/MSCs of craniofacial bones. However, a comprehensive study of the two different cranial stem cell niches at single-cell resolution is still lacking. In addition, during the progression of aging, age-associated changes in cranial stem cell niches and resident cells remain uncovered. In this study, we investigated age-related changes in cranial stem cell niches via single-cell RNA sequencing (scRNA-seq). The transcriptomic profiles and cellular compositions have been delineated, indicating alterations of the cranial bone marrow microenvironment influenced by inflammaging. Moreover, we identified a senescent mesenchymal cell subcluster and several age-related immune cell subclusters by reclustering and pseudotime trajectory analysis, which might be closely linked to inflammaging. Finally, differentially expressed genes (DEGs) and cell-cell communications were analyzed during aging, revealing potential regulatory factors. Overall, this work highlights the age-related changes in cranial stem cell niches, which deepens the current understanding of cranial bone and suture biology and may provide therapeutic targets for antiaging and regenerative medicine.

Keywords: cranial bone marrow; inflammaging; mesenchymal stem cell; single-cell RNA sequencing; stem cell niche; suture mesenchyme.


Conflict of interest statement

The authors declare no conflict of interest.

Figures

FIGURE 1
FIGURE 1
Overview of the workflow and the single‐cell atlas of cranial stem cell niches during aging. (a) Experimental design schematic. Briefly, six groups are established, including three groups of samples containing cranial bone marrow adjacent to the suture (CBMA_02m; CBMA_12m; CBMA_18m) and three groups of samples containing cranial bone marrow distant from the suture (CBMD_02m; CBMD_12m; CBMD_18m). All samples are processed using 10x Genomics Chromium platform. (b) UMAP method for dimensional reduction and visualization. UMAP plots segregated into CBMA_02m, CBMA_12m, CBMA_18m, CBMD_02m, CBMD_12m, and CBMD_18m groups. Cell types are clustered, annotated, and distinguished by colors. (c) Lineage tracing of Gli1+ SuSCs using Gli1 CreER ; tdTomato mice induced with Tamoxifen. White dotted lines depict parietal bones and sagittal suture mesenchyme. Scale bars, 500 μm. (d) Lineage tracing of Axin2+ SuSCs using Axin2 CreER ; tdTomato mice induced with tamoxifen. White dotted lines depict parietal bones and sagittal suture mesenchyme. Scale bars, 500 μm. Abbreviations: CBMA, cranial bone marrow (including the suture mesenchyme) adjacent to the suture; CBMD, cranial bone marrow distant from the suture; MNP, mononuclear phagocytes; SuSC, cranial suture mesenchymal stem cell; UMAP, Uniform Manifold Approximation and Projection.
FIGURE 2
FIGURE 2
Cell‐type annotation and marker gene expression of cell clusters within cranial stem cell niches. (a) Dot plot demonstrating the expression of classical marker genes in different cell clusters. Cell types are distinguished by colors. (b) Feature plots demonstrating representative marker genes in different cell clusters. Cell types are distinguished by colors (erythrocyte cluster not shown).
FIGURE 3
FIGURE 3
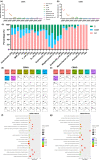
Characterization of the cellular composition, cell cycle distribution, and temporal gene expression profile. (a, b) Line charts depict the cellular composition of each cell type within CBMA (a) and CBMD (b) at different ages. Cell types are distinguished by colors. (c) Bar chart showing cell cycle distribution concerning each cell type within cranial stem cell niches (CBMA and CBMD) at different ages. Cell types are distinguished by colors. (d, e) STEM analysis showing temporal gene expression profiles in CBMA (d) and CBMD (e). Profiles enriched with statistical significance are color labeled with p values annotated. (f, g) GO analysis of genes related to profile 28 in CBMA (f) and CBMD (g). Top 20 enriched GO terms are displayed. Abbreviations: STEM, Short Time‐series Expression Miner; GO, Gene Ontology.
FIGURE 4
FIGURE 4
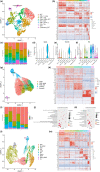
Subclustering and pseudotime trajectory analysis of the mesenchymal cell cluster. (a) UMAP plot of the reclustered mesenchymal cell population. Mesenchymal cell subsets are distinguished by colors. (b) Heatmap revealing six subsets of the mesenchymal cell cluster within cranial stem cell niches (CBMA and CBMD). Top 10 marker genes with the highest expression in each subset are displayed. (c) Dot plot demonstrating the expression of classical marker genes in different mesenchymal cell subsets. Mesenchymal cell subsets are distinguished by colors. (d–f) Violin plots depict expression levels of aging‐related marker genes, such as Il1b (d), Itgam (e), and Lmnb1 (f), highly expressed by the senescent subset of mesenchymal cells. Mesenchymal cell subsets are distinguished by colors. (g) Developmental trajectory of mesenchymal cell subsets by pseudotime value. (h) Distribution of six mesenchymal cell subsets along the developmental trajectory. The senescent subset had the highest pseudotime value and was located at the ending point, whereas the SuSC subset had the lowest pseudotime value and was located at the starting point. (i) Clustered heatmap revealing top 50 genes with the most significant alterations across pseudotime in mesenchymal cell population. Abbreviations: CAR, CXCL12‐abundant reticular cell; SCLC, Schwann cell‐like cell; VSMC, vascular smooth muscle cell.
FIGURE 5
FIGURE 5
Subclustering and characterization of the immune cell clusters to reveal age‐related subsets. (a) UMAP plot of reclustered T‐cell population. T‐cell subsets are distinguished by colors. (b) Heatmap revealing nine subsets of the T‐cell cluster within cranial stem cell niches (CBMA and CBMD). Top 10 marker genes with the highest expression in each subset are displayed. (c) Bar chart showing cellular composition of T‐cell subsets within cranial suture and bone marrow at different ages. (d–f) Violin plots depict transcriptional signatures of Cd8 + Gzmk+ T‐cell subset, such as Gzmk (d), Eomes (e), and Tox (f). T‐cell subsets are distinguished by colors. (g) UMAP plot of reclustered granulocyte population. Granulocyte subsets are distinguished by colors. (h) Heatmap revealing five subsets of granulocyte cluster within cranial stem cell niches (CBMA and CBMD). Top 10 marker genes with the highest expression in each subset are displayed. (i) Bar chart showing cellular composition of granulocyte subsets within cranial suture and bone marrow at different ages. (j, k) GO analysis of marker genes related to PMN‐ISG subset (j) and PMN‐aging subset (k). Top 20 enriched GO terms are displayed. (l) UMAP plot of reclustered MNP population. MNP subsets are distinguished by colors. (m) Heatmap revealing 10 subsets of MNP cluster within cranial stem cell niches (CBMA and CBMD). Top 10 marker genes with the highest expression in each subset are displayed. Abbreviations: cMo, classical monocyte; DC, dendritic cell; DNT, double‐negative T cell; DPT, double‐positive T cell; GDT, γδ T cell; immNeu, immature neutrophil; iMo, intermediate monocyte; ISG, interferon‐stimulating gene; Macro, macrophage; MDP, monocyte–macrophage/dendritic cell precursor; M‐MDSC, monocytic myeloid‐derived suppressor cell; mNeu, mature neutrophil; ncMo, nonclassical monocyte; NKT, natural killer T cell; Oc, osteoclast; pDC, plasmacytoid dendritic cell; PMN, polymorphonuclear neutrophil; PMN‐MDSC, polymorphonuclear myeloid‐derived suppressor cell; T naive, naïve T cell; Tex, exhausted T cell; Treg, regulatory T cell.
FIGURE 6
FIGURE 6
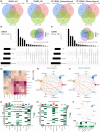
Integrated comparative analysis of shared upregulated DEGs and cell–cell crosstalk within cranial stem cell niches. (a–d) Venn diagrams showing overlaps of age‐related upregulated DEGs of pairwise comparisons among different ages. The upregulated DEGs are screened out from all cell clusters of CBMA (a) and CBMD (b); or the mesenchymal cell cluster of CBMA (c) and CBMD (d). (e, f) Upset plots demonstrating upregulated DEGs in the mesenchymal cell, T cell, granulocyte, and MNP clusters between CBMA_18m and CBMA_02m (e) or between CBMD_18m and CBMD_02m (f). (g) Heatmap revealing the relative cell–cell interaction number among different cell clusters within cranial stem cell niches, analyzed using CellPhoneDB. (h, i) Circle plots demonstrating the cell–cell interaction number (h) and weights/strength (i) of different cell clusters within cranial stem cell niches, analyzed using CellChat. (j, k) Heatmap revealing the incoming (j) and outgoing (k) signaling patterns of different cell clusters within cranial stem cell niches, analyzed using CellChat. Top 30 most significant signaling pathways are displayed. (l, m) Circle plot depicts inferred CXCL signaling networks within cranial stem cell niches (l), and the signaling roles of different cell clusters are revealed by heatmap (m), analyzed using CellChat. Abbreviations: DEG, differentially expressed genes.
FIGURE 7
FIGURE 7
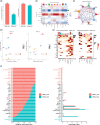
Age‐related changes of intercellular communications in CBMA. (a) Bar chart showing the overall differences of interaction number (left) and strength (right) between CBMA_18m and CBMA_02m, analyzed using CellChat. (b and c) Heatmap (b) and circle plot (c) presented differential interaction numbers among different cell clusters within CBMA, comparing CBMA_18m with CBMA_02m. (d) Scatter plots demonstrating the incoming and outgoing interaction strength of different cell clusters of CBMA_18m (left) and CBMA_02m (right), analyzed using CellChat. (e) Heatmaps revealing overall signaling patterns of different cell clusters of CBMA_18m (left) and CBMA_02m (right), analyzed using CellChat. The darker the color, the stronger the relative interaction strength. (f) Bar plots display the relative information flow (left) and information flow comparisons (right) of differential signaling pathways between CBMA_18m and CBMA_02m.

References

    1. Aldawood, Z. A. , Mancinelli, L. , Geng, X. , Yeh, S. A. , Di Carlo, R. , Leite, T. C. , Gustafson, J. , Wilk, K. , Yozgatian, J. , Garakani, S. , Bassir, S. H. , Cunningham, M. L. , Lin, C. P. , & Intini, G. (2023). Expansion of the sagittal suture induces proliferation of skeletal stem cells and sustains endogenous calvarial bone regeneration. Proceedings of the National Academy of Sciences, 120, e2120826120. - PMC - PubMed
    1. Almanan, M. , Raynor, J. , Ogunsulire, I. , Malyshkina, A. , Mukherjee, S. , Hummel, S. A. , Ingram, J. T. , Saini, A. , Xie, M. M. , Alenghat, T. , Way, S. S. , Deepe, G. S. , Divanovic, S. , Singh, H. , Miraldi, E. , Zajac, A. J. , Dent, A. L. , Hölscher, C. , Chougnet, C. , & Hildeman, D. A. (2020). IL‐10–producing Tfh cells accumulate with age and link inflammation with age‐related immune suppression. Science Advances, 6, eabb0806. - PMC - PubMed
    1. Ambrosi, T. H. , Marecic, O. , McArdle, A. , Sinha, R. , Gulati, G. S. , Tong, X. , Wang, Y. , Steininger, H. M. , Hoover, M. Y. , Koepke, L. S. , Murphy, M. P. , Sokol, J. , Seo, E. Y. , Tevlin, R. , Lopez, M. , Brewer, R. E. , Mascharak, S. , Lu, L. , Ajanaku, O. , … Chan, C. K. F. (2021). Aged skeletal stem cells generate an inflammatory degenerative niche. Nature, 597, 256–262. - PMC - PubMed
    1. Bronte, V. , Brandau, S. , Chen, S. H. , Colombo, M. P. , Frey, A. B. , Greten, T. F. , Mandruzzato, S. , Murray, P. J. , Ochoa, A. , Ostrand‐Rosenberg, S. , Rodriguez, P. C. , Sica, A. , Umansky, V. , Vonderheide, R. H. , & Gabrilovich, D. I. (2016). Recommendations for myeloid‐derived suppressor cell nomenclature and characterization standards. Nature Communications, 7, 12150. - PMC - PubMed
    1. Chan, C. K. F. , Gulati, G. S. , Sinha, R. , Tompkins, J. V. , Lopez, M. , Carter, A. C. , Ransom, R. C. , Reinisch, A. , Wearda, T. , Murphy, M. , Brewer, R. E. , Koepke, L. S. , Marecic, O. , Manjunath, A. , Seo, E. Y. , Leavitt, T. , Lu, W. J. , Nguyen, A. , Conley, S. D. , … Longaker, M. T. (2018). Identification of the human skeletal stem cell. Cell, 175, 43–56.e21. - PMC - PubMed

Publication types