. 2023 Sep 8;8(17):e161282.
doi: 10.1172/jci.insight.161282.

Hepatic FASN deficiency differentially affects nonalcoholic fatty liver disease and diabetes in mouse obesity models

Affiliations

Hepatic FASN deficiency differentially affects nonalcoholic fatty liver disease and diabetes in mouse obesity models

Toshiya Matsukawa et al. JCI Insight. .

Abstract

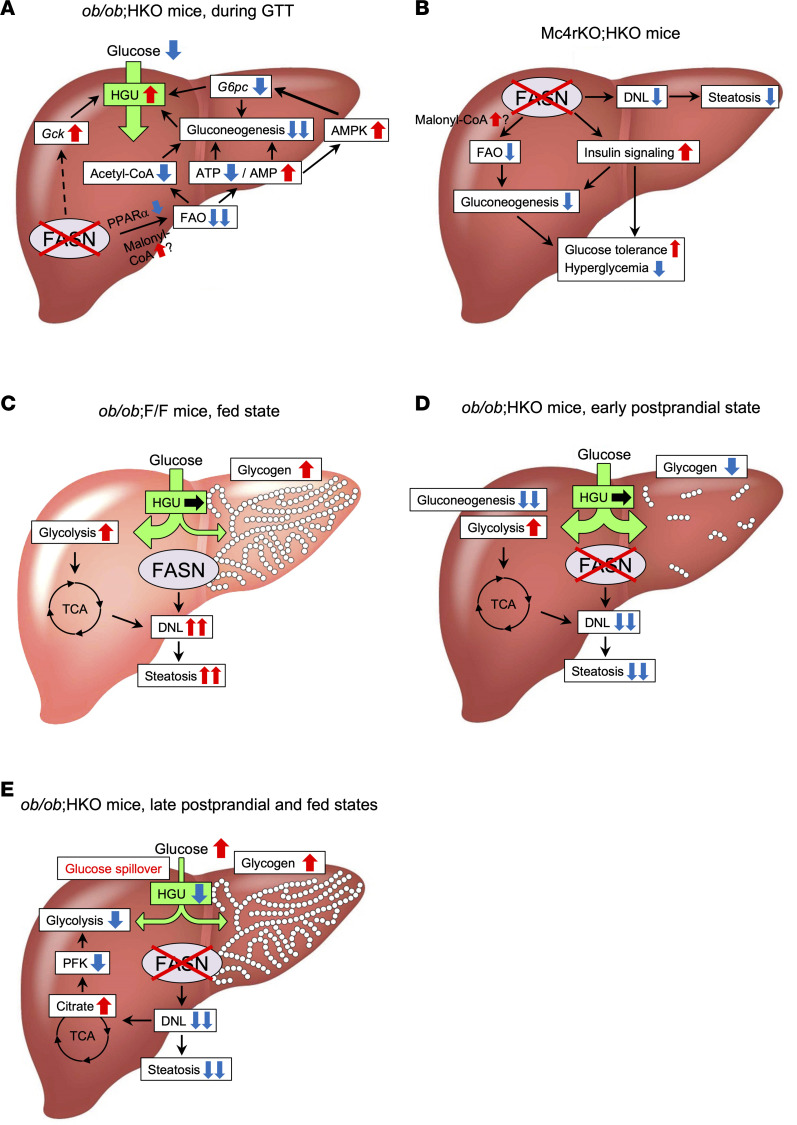
Nonalcoholic fatty liver disease (NAFLD) and type 2 diabetes are interacting comorbidities of obesity, and increased hepatic de novo lipogenesis (DNL), driven by hyperinsulinemia and carbohydrate overload, contributes to their pathogenesis. Fatty acid synthase (FASN), a key enzyme of hepatic DNL, is upregulated in association with insulin resistance. However, the therapeutic potential of targeting FASN in hepatocytes for obesity-associated metabolic diseases is unknown. Here, we show that hepatic FASN deficiency differentially affects NAFLD and diabetes depending on the etiology of obesity. Hepatocyte-specific ablation of FASN ameliorated NAFLD and diabetes in melanocortin 4 receptor-deficient mice but not in mice with diet-induced obesity. In leptin-deficient mice, FASN ablation alleviated hepatic steatosis and improved glucose tolerance but exacerbated fed hyperglycemia and liver dysfunction. The beneficial effects of hepatic FASN deficiency on NAFLD and glucose metabolism were associated with suppression of DNL and attenuation of gluconeogenesis and fatty acid oxidation, respectively. The exacerbation of fed hyperglycemia by FASN ablation in leptin-deficient mice appeared attributable to impairment of hepatic glucose uptake triggered by glycogen accumulation and citrate-mediated inhibition of glycolysis. Further investigation of the therapeutic potential of hepatic FASN inhibition for NAFLD and diabetes in humans should thus consider the etiology of obesity.

Keywords: Diabetes; Hepatology; Metabolism; Molecular pathology; Obesity.


Figures

Figure 1
Figure 1. Hepatic FASN deficiency in ob/ob mice ameliorates hepatic steatosis but exacerbates liver dysfunction.
(AC) Macroscopic appearance of the liver (A), liver weight (B), and H&E and Oil Red O (ORO) staining of liver sections (C) for 10-week-old NCD-fed F/F, HKO, ob/ob F/F, and ob/ob HKO mice. Images in A and C are representative of 5 mice per group. Scale bars, 100 μm (C). (D and E) Triglyceride and cholesterol levels in plasma (D) and the liver (E) of 10-week-old mice either deprived of food overnight (plasma) or in the fed state (plasma and liver). (F) Plasma aspartate aminotransaminase (AST) and alanine aminotransaminase (ALT) levels in 10-week-old mice. (G) Immunoblot analysis of FASN and ACC in the liver of NCD- or HFD-fed mice at the indicated ages. α-Tubulin (Tub) was examined as a loading control. The lanes are from the same gel but were noncontiguous. Each lane corresponds to 1 mouse, and the blots are representative of 2 independent experiments. (H) RT-qPCR analysis of gene expression related to ER stress, inflammation, or apoptosis in the liver of 10-week-old mice in the fed state. All quantitative data are means + SEM (n = 5 or 6 mice). *P < 0.05, **P < 0.01 (1-way ANOVA followed by Tukey’s in B, D, E, and F or Bonferroni’s multiple-comparison test in H).
Figure 2
Figure 2. Hepatic FASN deficiency in ob/ob mice improves glucose tolerance and confers relative fasting hypoglycemia but exacerbates fed hyperglycemia.
(A and B) BW (A) and blood glucose concentration in the fed state (B) for ob/ob F/F and ob/ob HKO mice at the indicated ages (n = 10). (C) Plasma insulin concentrations of mice in the fasted state at 10 weeks of age (n = 8) and in the fed state at 12 weeks of age (n = 8). (D) Fasting blood glucose concentration in 10- to 12-week-old mice (n = 10). (E) Blood glucose levels during a 12-hour fasting challenge test in 12-week-old mice (n = 8). (F) Blood glucose concentrations, AUC, and plasma insulin concentrations during an IPGTT (2 g of glucose per kg of BW) in 10-week-old mice (n = 8). (G) An ITT (4 U of human regular insulin per kg of BW) for 12-week-old mice (n = 5). All data are means + SEM for the indicated numbers (n) of mice. *P < 0.05, **P < 0.01 compared with ob/ob F/F mice or as indicated (2-tailed Student’s t test).
Figure 3
Figure 3. Effects of leptin supplementation and HFruD feeding on the metabolic phenotype of ob/ob HKO mice.
(AD) Food intake (A), change in BW (B), blood glucose concentration in the fed state (C), and the results of an IPGTT (2 g of glucose per kg of BW) (D) at 1 week after the onset of leptin or PBS (vehicle) supplementation in 8- to 9-week-old ob/ob F/F and ob/ob HKO mice (n = 6). (E and F) BW at the indicated ages (n = 7) (E) and blood glucose concentrations in the fasted and fed states at 24 weeks of age (n = 7) (F) for HFruD-fed ob/ob F/F and ob/ob HKO mice. (G) An IPGTT (2 g of glucose per kg of BW) in 14-week-old HFruD-fed mice (n = 4). (H) H&E, Oil Red O, and PAS staining of liver sections from 16-week-old HFruD-fed mice. Images are representative of 4 mice per genotype. Scale bars, 100 μm. (I) Hepatic triglyceride (n = 6), cholesterol (n = 6), and glycogen (n = 4) levels in 24-week-old HFruD-fed mice. (J) A pyruvate tolerance test for 15-week-old HFruD-fed mice (n = 5). All quantitative data are means + SEM for the indicated numbers of mice. *P < 0.05, **P < 0.01 compared with ob/ob F/F mice or as indicated (1-way ANOVA followed by Tukey’s multiple comparison test in AC or 2-tailed Student’s t test in DG, I, and J). HFruD, high-fructose, low-glucose diet; PAS, periodic acid–Schiff.
Figure 4
Figure 4. Hepatic FASN deficiency in ob/ob mice suppresses gluconeogenesis in association with inhibition of PPARα and FAO and activation of AMPK.
(A and B) Pyruvate (A) and glycerol (B) tolerance tests in 10-week-old ob/ob F/F and ob/ob HKO mice (n = 5). (C) Metabolites in the liver of fasted 10-week-old mice (n = 4) were measured by mass spectrometry. The results are depicted as a pathway activity map, with red and blue indicating metabolites whose abundance was increased or decreased, respectively, in ob/ob HKO mice compared with ob/ob F/F mice. Metabolites in parentheses were not detected. Quantitative data are provided in Supplemental Table 1. FBPase, fructose-1,6-bisphosphatase; PEPCK, phosphoenolpyruvate carboxykinase. (D) RT-qPCR analysis of gene expression related to gluconeogenesis or glycolysis in the liver of fasted 10-week-old mice (n = 4 to 6). (E) 2-DG uptake in the liver and gastrocnemius muscle of 10- to 12-week-old mice (n = 6). (F) Hepatic ATP and AMP levels as well as the AMP/ATP ratio in fasted 10-week-old mice (n = 3). (G) Immunoblot analysis of phosphorylated and total forms of AMPKα subunits, ACC, and RAPTOR in the liver of fasted 10-week-old mice (n = 3). (H) Plasma FFA and β-hydroxybutyrate levels in fasted 10-week-old mice (n = 6). (I) RT-qPCR analysis of the expression of PPARα target genes related to FAO or ketogenesis in the liver of fasted 10-week-old mice (n = 4 to 6). All quantitative data are means + SEM for the indicated numbers of mice. *P < 0.05, **P < 0.01 compared with ob/ob F/F mice or as indicated (2-tailed Student’s t test). Gck, glucokinase; Pfkl, liver-type phosphofructokinase.
Figure 5
Figure 5. Hepatic glycogen accumulation and suppression of glycolysis coordinately exacerbate fed hyperglycemia in ob/ob HKO mice.
(A) Metabolomic profiling of the liver of NCD-fed ob/ob F/F and ob/ob HKO mice in the fed state at 10 weeks of age (n = 3 to 6). Liver metabolites were measured by mass spectrometry. Results are depicted as a pathway activity map; red and blue indicate metabolites with an increased or decreased abundance, respectively, in ob/ob HKO mice compared with ob/ob F/F mice. Metabolites in parentheses were not detected. Quantitative data are provided in Supplemental Table 2. GK, glucokinase; PFK, phosphofructokinase; PPP, pentose phosphate pathway; HBP, hexosamine biosynthesis pathway; PK, pyruvate kinase. (B) Blood glucose concentrations at the indicated times during refeeding after food deprivation for 16 hours in 10- to 12-week-old ob/ob F/F and ob/ob HKO mice (n = 10). (C) Hepatic glycogen content in fasted (16 hours), refed (6 hours), and fed states for 10- to 12-week-old ob/ob F/F and ob/ob HKO mice (n = 5). (D) RT-qPCR analysis of Gys2 mRNA in the liver of fasted 10-week-old ob/ob HKO mice injected with an adenovirus encoding GS or a control virus (n = 3). (E) PAS staining of liver sections from 10-week-old ob/ob HKO mice in the fed or overnight-fasted state after injection with control or GS adenoviruses. Images are representative of 4 mice per condition. Scale bars, 200 μm. (F) Hepatic glycogen content in ob/ob HKO mice (n = 6) as in E. (G) An IPGTT (2 g of glucose per kg of BW) in ob/ob HKO mice injected with control or GS adenoviruses (n = 6). (H) Activity and mRNA abundance for liver-type PFK (encoded by Pfkl) in the liver of 10-week-old ob/ob F/F and ob/ob HKO mice in the fed state (n = 6). All quantitative data are means + SEM for the indicated numbers of mice. *P < 0.05, **P < 0.01 compared with ob/ob F/F mice or the control adenovirus, or as indicated (2-tailed Student’s t test in BD, G, and H or 1-way ANOVA followed by Tukey’s multiple-comparison test in F).
Figure 6
Figure 6. Hepatic FASN deficiency in Mc4r-KO mice ameliorates NAFLD and diabetes.
(AE) BW (n = 8) and 24-hour food intake (n = 5) (A), macroscopic appearance of the liver (B), liver weight (n = 5) (C), H&E and Oil Red O staining of liver sections (D), and hepatic triglyceride and cholesterol levels in the fed state (n = 5) (E) for 16- to 19-week-old Mc4r-KO F/F and Mc4r-KO HKO mice maintained on an NCD. All images are representative of 5 mice per group. Scale bars, 100 μm (D). (F and G) Plasma transaminase levels (n = 5) (F) as well as RT-qPCR analysis of hepatic gene expression related to ER stress, inflammation, or apoptosis (n = 5) (G) for 16- to 20-week-old fed mice of the indicated genotypes maintained on an NCD. (H and I) Blood glucose (n = 7) (H) and plasma insulin (n = 6) (I) levels in the fasted and fed states for mice at 16 to 18 weeks of age. (J and K) An ITT (2 U of human regular insulin per kg of BW) (n = 8) (J) and IPGTT (1.5 g of glucose per kg of BW) (n = 7) (K) for 16- to 19-week-old mice. (L) Immunoblot analysis of lipogenic enzymes in the fed liver of 10-week-old ob/ob F/F and ob/ob HKO mice as well as 16- to 18-week-old Mc4r-KO F/F and Mc4r-KO HKO mice maintained on an NCD. (M) Hepatic abundance of newly synthesized palmitate in the fasted state (6 hours) for 10-week-old F/F, HKO, ob/ob F/F, and ob/ob HKO mice and for 16- to 18-week-old Mc4r-KO F/F and Mc4r-KO HKO mice maintained on an NCD (n = 5). All quantitative data are means + SEM for the indicated numbers of mice. *P < 0.05, **P < 0.01 compared with Mc4r-KO F/F mice or as indicated (2-tailed Student’s t test [C, E, H, I, and K] or 1-way ANOVA followed by Bonferroni’s multiple-comparison test [F, G, and M]).
Figure 7
Figure 7. Hepatic FASN deficiency in Mc4r-KO mice improves glucose metabolism by inhibiting gluconeogenesis and augmenting insulin signaling.
(A and B) Pyruvate (A) and glycerol (B) tolerance tests for 20-week-old Mc4r-KO F/F and Mc4r-KO HKO mice (n = 7). (C) Plasma FFA and β-hydroxybutyrate levels in fasted 16- to 20-week-old mice (n = 6). (D) RT-qPCR analysis of the expression of PPARα target genes related to FAO or ketogenesis as well as of genes related to gluconeogenesis or glycolysis in the liver of fasted 16- to 20-week-old mice (n = 6). (E) Immunoblot analysis of phosphorylated and total forms of AMPKα subunits, ACC, and RAPTOR in the liver of fasted 16- to 20-week-old mice (n = 5 or 6). (F) Effects of insulin on IRβ and Akt phosphorylation in the liver of 16- to 20-week-old mice. Mice deprived of food overnight were injected intravenously with insulin (5 U/kg) or PBS (–), 2 minutes after which the liver was isolated, lysed, and subjected to immunoblot analysis. Each lane corresponds to 1 mouse, and the blots are representative of 2 independent experiments. (G) Hepatic citrate levels in 20-week-old Mc4r-KO F/F and Mc4r-KO HKO mice in the fed state (n = 5). All quantitative data are means + SEM for the indicated numbers of mice. *P < 0.05, **P < 0.01 compared with Mc4r-KO F/F mice or as indicated (2-tailed Student’s t test).
Figure 8
Figure 8. Proposed mechanisms by which hepatic FASN deficiency in NCD-fed ob/ob or Mc4r-KO mice affects NAFLD and diabetes.
(A) In the liver of fasted ob/ob HKO mice, FAO is impaired, which results in suppression of gluconeogenesis via AMPK-dependent and -independent mechanisms and thereby leads to fasting hypoglycemia. Gck expression is also upregulated by an unknown mechanism. Suppression of gluconeogenesis and upregulation of GK together promote HGU during an IPGTT, resulting in improved glucose tolerance. (B) In the liver of Mc4r-KO HKO mice, suppression of DNL alleviates hepatic steatosis. Gluconeogenesis is also suppressed as a result of inhibition of FAO and augmentation of insulin signaling. This suppression of gluconeogenesis and enhanced insulin signaling cooperatively improve glucose metabolism. (C) In the liver of fed ob/ob F/F mice, dietary glucose is metabolized predominantly via glycolysis, the TCA cycle, and DNL as a result of sufficient glycogen accumulation. (D) In the liver of ob/ob HKO mice, DNL and gluconeogenesis are suppressed, resulting in alleviation of hepatic steatosis and promotion of glucose uptake. In the early postprandial state, dietary glucose is therefore metabolized predominantly through glycolysis, the TCA cycle, and glycogenesis, resulting in maintenance of blood glucose levels similar to those of ob/ob F/F mice. (E) In the liver of ob/ob HKO mice in the late postprandial and fed states, glycolysis is inhibited through citrate-mediated suppression of PFK activity. This inhibition of glycolysis and hepatic glycogen accumulation cooperatively restrain glucose utilization and uptake, resulting in glucose spillover and consequent exacerbation of fed hyperglycemia.

References

    1. Younossi ZM, et al. Global epidemiology of nonalcoholic fatty liver disease-Meta-analytic assessment of prevalence, incidence, and outcomes. Hepatology. 2016;64(1):73–84. doi: 10.1002/hep.28431. - DOI - PubMed
    1. Chalasani N, et al. The diagnosis and management of non-alcoholic fatty liver disease: practice guideline by the American Association for the Study of Liver Diseases, American College of Gastroenterology, and the American Gastroenterological Association. Hepatology. 2012;55(6):2005–2023. doi: 10.1002/hep.25762. - DOI - PubMed
    1. Younossi ZM, et al. The global epidemiology of NAFLD and NASH in patients with type 2 diabetes: a systematic review and meta-analysis. J Hepatol. 2019;71(4):793–801. doi: 10.1016/j.jhep.2019.06.021. - DOI - PubMed
    1. Polyzos SA, et al. Obesity and nonalcoholic fatty liver disease: from pathophysiology to therapeutics. Metabolism. 2019;92:82–97. doi: 10.1016/j.metabol.2018.11.014. - DOI - PubMed
    1. Harrison SA, et al. Prospective evaluation of the prevalence of non-alcoholic fatty liver disease and steatohepatitis in a large middle-aged US cohort. J Hepatol. 2021;75(2):284–291. doi: 10.1016/j.jhep.2021.02.034. - DOI - PubMed

Publication types

LinkOut - more resources