Review
. 2023 Sep 26;59(77):11484-11499.
doi: 10.1039/d3cc02909c.

Considerations for defining +80 Da mass shifts in mass spectrometry-based proteomics: phosphorylation and beyond

Affiliations
Review

Considerations for defining +80 Da mass shifts in mass spectrometry-based proteomics: phosphorylation and beyond

Leonard A Daly et al. Chem Commun (Camb). .

Abstract

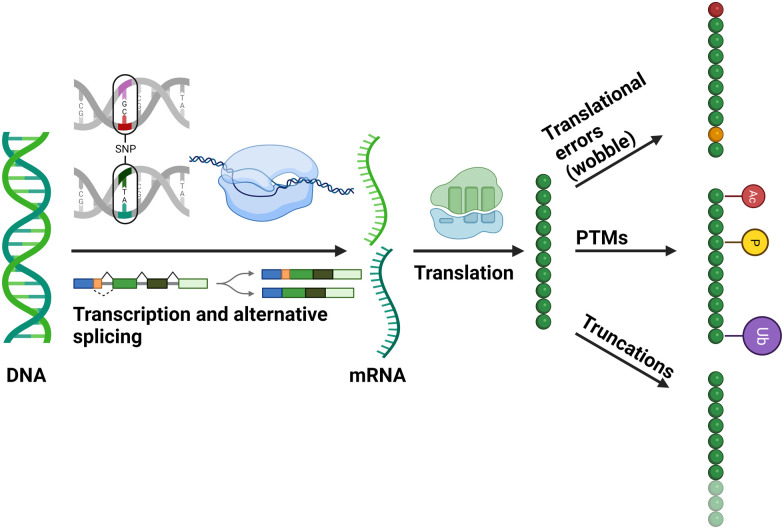
Post-translational modifications (PTMs) are ubiquitous and key to regulating protein function. Understanding the dynamics of individual PTMs and their biological roles requires robust characterisation. Mass spectrometry (MS) is the method of choice for the identification and quantification of protein modifications. This article focusses on the MS-based analysis of those covalent modifications that induce a mass shift of +80 Da, notably phosphorylation and sulfation, given the challenges associated with their discrimination and pinpointing the sites of modification on a polypeptide chain. Phosphorylation in particular is highly abundant, dynamic and can occur on numerous residues to invoke specific functions, hence robust characterisation is crucial to understanding biological relevance. Showcasing our work in the context of other developments in the field, we highlight approaches for enrichment and site localisation of phosphorylated (canonical and non-canonical) and sulfated peptides, as well as modification analysis in the context of intact proteins (top down proteomics) to explore combinatorial roles. Finally, we discuss the application of native ion-mobility MS to explore the effect of these PTMs on protein structure and ligand binding.


Conflict of interest statement

There are no conflicts to declare.

Figures

Fig. 1
Fig. 1. Diagrammatic representation of cellular mechanisms that contribute to the generation of different proteoforms. Figure created with BioRender.com.
Fig. 2
Fig. 2. Chemical structures of biologically relevant phosphorylated amino acids, and sulfotyrosine (sTyr). The atomic structure of all canonical (phosphomonoesters – Ser, Thr, Tyr) and non-canonical (grouped by chemical property); phosphoanhydride (pAsp, pGlu), phosphoramidates (pLys, pArg, 1-pHis, 3-pHis) and phosphorothiolates (pCys) alongside sulfotyrosine (sTyr). All models retrieved from Chemdraw 20.0.
Fig. 3
Fig. 3. Strategies for the investigation of NCPhos. Table includes advantages and disadvantages of the three main enrichment strategies. Figure created in part with BioRender.com.
Fig. 4
Fig. 4. HCD-induced triplet neutral loss from different types of phosphopeptides. Percentage of phosphopeptides exhibiting no neutral loss (triplet = 0) or neutral loss of any combination of 80, 98 and/or 116 Da (Triplet = 1, 2 or 3) as a function of the defined site of phosphorylation following HCD (ptmRS >0.90). Ala (A) was used as a decoy for site localisation analysis. Figure adapted from ref. with permission. Copyright © 2019 Hardman et al. Published by EMBO Press, under a CC-BY 4.0 license.
Fig. 5
Fig. 5. Challenges associated with localisation of sulfotyrosine (sTyr) versus phosphotyrosine (pTyr) on equivalent peptides following HCD. Identical sTyr- and pTyr-containing peptides were subjected to low NCE (10%, 15% or 20%) HCD and the degree of product ion neutral loss quantified using the equation. Green indicates all theoretical fragment ions contain the PTM induced +80 Da mass shift. Red indicates all theoretical fragment ions lack the +80 Da mass shift. White – no software based identification. Adapted from ref. with permission. Copyright © 2023 Daly et al., under a CC-BY 4.0 license.
Fig. 6
Fig. 6. Challenges of proteoform identification and the need for site specific fragmentation to differentiate isobaric proteoforms. Depicted are examples of three different proteoforms (amino acids in green, phosphosites represented by yellow circles). Illustrating isobaric proteoforms (top 2) and proteoforms that differ by a single additional phosphate group (bottom 2). The equation can be used to calculate the number of potential proteoform combinations, where n is the number of potential phosphosites and r is the number of observed events.
Fig. 7
Fig. 7. Intact mass spectrum showing proteoform complexity across three charge state envelopes of an exemplar ∼45 kDa protein. Depending on the occurrence of related proteoforms and the isolation width, it may not be possible to generate proteoform specific MS2 spectra, instead generating chimeric spectra from co-isolated species. Compare isolation of a single 3-phosphate containing ion ((a) black box) versus co-isolation of the multiple proteoforms including oxidised and non-oxidised variants of the 4 phosphate-containing species ((b) red box). z = charge state; P = phosphorylation; O = methionine oxidation.
Fig. 8
Fig. 8. Exploring the effects of PTMs or ligand binding on the conformation of Aurora A (122–203). Native ion mobility mass spectra showing the TWCCSN2→He for the [M + 11H]11+ species of (A) (left) wild-type (WT) phosphorylated active Aurora A (122–403) and (right) non-phosphorylated inactive D274N Aurora A (122–403), detailing the rotationally averaged collision cross section (CCS) and CCS distribution (CCSD) indicative of conformer flexibility for each conformational state. (B) WT Aurora A in the absence (red, DMSO vehicle) and presence (blue) of inhibitors: ENMD-2076 (which favours DFG-in mode); MLN8237 (partial DFG-out); MK-8745 (DFG-out), following collision-induced unfolding with 26 V collision energy. Figure adapted from ref. with permission. Copyright © 2022 Tomlinson et al. Published by American Chemical Society, under a CC-BY 4.0 license.
None
Leonard A. Daly
None
Christopher J. Clarke
None
Allen Po
None
Sally O. Oswald
None
Claire E. Eyers

References

    1. Ramazi S. Zahiri J. Database (Oxford) 2021;2021:baab012. doi: 10.1093/database/baab012. - DOI - PMC - PubMed
    1. Aebersold R. Agar J. N. Amster I. J. Baker M. S. Bertozzi C. R. Boja E. S. Costello C. E. Cravatt B. F. Fenselau C. Garcia B. A. Ge Y. Gunawardena J. Hendrickson R. C. Hergenrother P. J. Huber C. G. Ivanov A. R. Jensen O. N. Jewett M. C. Kelleher N. L. Kiessling L. L. Krogan N. J. Larsen M. R. Loo J. A. Ogorzalek Loo R. R. Lundberg E. MacCoss M. J. Mallick P. Mootha V. K. Mrksich M. Muir T. W. Patrie S. M. Pesavento J. J. Pitteri S. J. Rodriguez H. Saghatelian A. Sandoval W. Schlüter H. Sechi S. Slavoff S. A. Smith L. M. Snyder M. P. Thomas P. M. Uhlén M. Van Eyk J. E. Vidal M. Walt D. R. White F. M. Williams E. R. Wohlschlager T. Wysocki V. H. Yates N. A. Young N. L. Zhang B. Nat. Chem. Biol. 2018;14:206–214. doi: 10.1038/nchembio.2576. - DOI - PMC - PubMed
    1. Drown B. S. Jooß K. Melani R. D. Lloyd-Jones C. Camarillo J. M. Kelleher N. L. J. Proteome Res. 2022;21:1299–1310. doi: 10.1021/acs.jproteome.2c00034. - DOI - PMC - PubMed
    1. Ponomarenko E. A. Poverennaya E. V. Ilgisonis E. V. Pyatnitskiy M. A. Kopylov A. T. Zgoda V. G. Lisitsa A. V. Archakov A. I. Int. J. Anal. Chem. 2016;2016(7436849):7436849. - PMC - PubMed
    1. Eyers C. E. Gaskell S. J. Wiley Encycl. Chem. Biol. 2007:1–34. doi: 10.1002/9780470048672.wecb469. - DOI