. 2023 Aug 30;12(17):2175.
doi: 10.3390/cells12172175.

Recruitment of the Histone Variant MacroH2A1 to the Pericentric Region Occurs upon Chromatin Relaxation and Is Responsible for Major Satellite Transcriptional Regulation

Affiliations

Recruitment of the Histone Variant MacroH2A1 to the Pericentric Region Occurs upon Chromatin Relaxation and Is Responsible for Major Satellite Transcriptional Regulation

Ludmila Recoules et al. Cells. .

Abstract

Heterochromatin formation plays a pivotal role in regulating chromatin organization and influences nuclear architecture and genome stability and expression. Amongst the locations where heterochromatin is found, the pericentric regions have the capability to attract the histone variant macroH2A1. However, the factors and mechanisms behind macroH2A1 incorporation into these regions have not been explored. In this study, we probe different conditions that lead to the recruitment of macroH2A1 to pericentromeric regions and elucidate its underlying functions. Through experiments conducted on murine fibroblastic cells, we determine that partial chromatin relaxation resulting from DNA damage, senescence, or histone hyper-acetylation is necessary for the recruitment of macroH2A1 to pericentric regions. Furthermore, macroH2A1 is required for upregulation of noncoding pericentric RNA expression but not for pericentric chromatin organization. Our findings shed light on the functional rather than structural significance of macroH2A1 incorporation into pericentric chromatin.

Keywords: chromatin decondensation; histone variant; macroH2A1; pericentromeric regions.


Conflict of interest statement

The authors declare no conflict of interest.

Figures
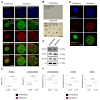
Figure 1
Figure 1
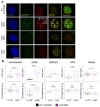
The histone variant mH2A1 is recruited to pericentric heterochromatin in mouse senescent cells. (A) Immunofluorescence (IF) confocal images of proliferating and senescent L929 mouse cells stained with Hoechst and antibodies specific for mH2A1, HP1α and γH2AX. Senescence was induced using etoposide treatment (12.5 μM, 24 h + 4 days of release). Percentage of cells presenting mH2A1 foci at pericentric regions is shown, represented as means ± standard deviation (SD) from two biological replicates. Scale bar = 10 μm. (B) Representative images of a senescence-associated β-galactosidase activity (SA-βgal) assessed by X-gal staining of proliferating and senescent cells. Percentage of SA-βgal-positive cells is indicated as means ± SD from two biological replicates. Scale bar = 100 μm. (C) Immunoblot analysis of mH2A1, γH2AX, β-actin, and H3 in total extract of proliferating and senescent cells. Apparent molecular weights are indicated. (D) IF confocal analysis of proliferating and senescent cells stained with Hoechst and antibody specific for γH2AX. Scale bar = 10 μm. (E) Quantifications of nuclear and chromocenter areas (Hoechst-dense labelling) in proliferating and senescent cells. (F) Quantifications of chromocenters (Hoechst-dense labelling), mH2A1, and γH2AX mean fluorescence intensities in proliferating and senescent cells. The number of cells analyzed for each condition is given (n). On boxplots, each point corresponds to the mean number of foci per cell, except for ‘nucleus’, where they represent the actual values. For statistical analysis, Wilcoxon tests were used to assess the significance of the observed differences. Differences were considered significant at a p-value of 0.05 or less. **** p-value < 0.0001.
Figure 2
Figure 2
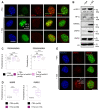
mH2A1 is recruited to Cas9-induced DSBs at pericentric regions. (A) IF confocal images of 48 h post-transfected cells co-expressing Cas9-GFP and gRNAs, stained with Hoechst and antibodies specific for mH2A1 and γH2AX. Three different gRNA are used: a gRNA targeting major satellites (MajS), corresponding to the pericentric DNA, a gRNA targeting minor satellites (MinS), corresponding to the centromeric DNA, and a gRNA targeting telomeres (Telo). Percentage of cells exhibiting mH2A1 foci at MajS are shown, represented as means ± SD from 6 biological replicates. Scale bar = 10 μm. (B) Quantifications of the mean areas and fluorescence intensities of chromocenters (Hoechst-dense labelling), γH2AX, H3K9me3, HP1α and nucleus (Hoechst labelling) in 48 h post-transfected negative (no Cas9-MajS) and positive cells (Cas9-MajS), taken from > 3 biological replicates, except for HP1α (2 biological replicates) and H3K9me3 (1 biological replicate). The number of cells analyzed for each condition is given (n). On boxplots, each point corresponds to the mean number of foci per cell, except for ‘nucleus’, where they represent the actual values. Wilcoxon tests were used to assess the significance of the observed differences. **** p < 0.0001, ** p < 0.01, * p < 0.05, ns: non-significant.
Figure 3
Figure 3
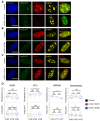
TSA treatment promotes mH2A1 recruitment to pericentric regions in the absence of satellite DSBs. (A) IF confocal images of untreated cells or cells treated with 500 nM of TSA over 48 h, stained with Hoechst and antibodies specific for mH2A1 and HP1α. Percentage of cells presenting mH2A1 foci at chromocenters is shown, represented as means ± SD from 3 biological replicates. Scale bar = 10 μm. (B) Immunoblots of mH2A1, HP1α, H3K9ac, γH2AX, and β-actin in protein extracts prepared from untreated and TSA-treated cells. Apparent molecular weights are indicated. Fold change increase in mH2A1 protein levels, normalized by β-actin from 4 biological replicates (as mean ± SD), is indicated. (C) Quantifications of the mean chromocenters (Hoechst-dense labelling) fluorescence and circularity in untreated and TSA-treated cells, taken from 2 biological replicates. TSA-treated cells are divided in two groups, depending on the presence of mH2A1 foci. (D) Quantifications of the mean γH2AX and mH2A1 fluorescence intensities in untreated and TSA-treated cells, taken from 2 biological replicates. The number of cells analyzed for each condition is given (n). (E) Same as in (A) but with γH2AX labelling. Percentage of cells presenting γH2AX foci at chromocenters is shown, represented as mean ± SD from 3 biological replicates. Scale bar = 10 μm. On boxplots, each point corresponds to the mean number of foci per cell. Wilcoxon tests were used to assess the significance of the observed differences. **** p < 0.0001, *** p < 0.001, ns: non-significant.
Figure 4
Figure 4
mH2A1 recruitment to DSBs correlates with chromocenter decondensation. (A) IF confocal images of 0 h-, 16 h-, or 24 h-transfected cells co-expressing Cas9-GFP and MajS-gRNAs, stained with Hoechst and antibodies specific for mH2A1 and γH2AX. Scale bar = 10 μm. (B) Line plot showing the percentage of cells with mH2A1 foci at chromocenters after different time points of Cas9-MajS transfection (0 h, 16 h, 24 h, 48 h, and 96 h). Percentages are based on Cas9-MajS-positive cells. One biological experiment was performed for each time point. (C) Quantifications of the mean fluorescence, area, perimeter, and circularity of chromocenters (Hoechst-dense labeling) after 16 h of transfection without (no Cas9-MajS 16 h) and/or with MajS gRNA (Cas9-MajS 16 h). The number of cells analyzed for each condition is given (n). Each point corresponds to the mean number of foci per cell. Wilcoxon tests were used to assess the significance of the observed differences. * p < 0.05, *** p < 0.001, **** p < 0.0001. (D) IF confocal images of 48 h post-transfected cells co-expressing dCas9-VPR and MajS gRNA or not, stained with Hoechst and antibodies specific for mH2A1 and HP1α. Scale bar = 10 μm.
Figure 5
Figure 5
DSB-induced chromocenter relaxation is independent of mH2A1. (A) IF confocal images of cells co-expressing Cas9-GFP and MajS gRNA, stained with Hoechst and antibodies specific for mH2A1 and γH2AX in control and mH2A1 KO #1 cells. Scale bar = 10 μm. (B) As in (A) but cells were stained with Hoechst and antibodies specific for H3K9me3 and γH2AX. (C) As in (A) but cells were stained with Hoechst and antibodies specific for HP1α and γH2AX. (D) Quantifications of the mean areas and fluorescence intensities of γH2AX, H3K9me3, HP1α and chromocenters (Hoechst-dense labelling) in control and mH2A1 KO clones, taken from > 3 biological replicates, except for HP1α and H3K9me3 (only 1 biological replicate). The number of cells analyzed for each condition is given (n). Each point corresponds to the mean number of foci per cell. Wilcoxon tests were used to assess the significance of the observed differences. **** p < 0.0001, *** p < 0.001, ** p < 0.01, * p < 0.05, ns: non-significant.
Figure 6
Figure 6
mH2A1 is necessary for pericentric ncRNA upregulation upon chromocenter decondensation. Reverse transcription quantitative PCR (RT-qPCR) with total RNA isolated from unsynchronized WT or macroH2A1 KO#1 mouse L919 cells. (A) The ratio of major satellite repeat expression between cells treated with 500 nM TSA for 48 h and control cells are plotted. The data represent the mean ± SD of four independent experiments. (B) The ratio of major satellite repeat expression between cells treated with 12.5 μM etoposide for 24 h and control cells is plotted. The data represent the mean ± SD of three independent experiments. For (A,B), amplified signals were normalized to GAPDH. Wilcoxon tests were used to assess the significance of the observed differences. (* p = 0.02857 for (A), p = 0.02597 for (B)).

References

    1. Ferrand J., Rondinelli B., Polo S.E. Histone Variants: Guardians of Genome Integrity. Cells. 2020;9:2424. doi: 10.3390/cells9112424. - DOI - PMC - PubMed
    1. Martire S., Banaszynski L.A. The roles of histone variants in fine-tuning chromatin organization and function. Nat. Rev. Mol. Cell Biol. 2020;21:522–541. doi: 10.1038/s41580-020-0262-8. - DOI - PMC - PubMed
    1. Buschbeck M., Hake S.B. Variants of core histones and their roles in cell fate decisions, development and cancer. Nat. Rev. Mol. Cell Biol. 2017;18:299–314. doi: 10.1038/nrm.2016.166. - DOI - PubMed
    1. Pehrson J.R., Fuji R.N. Evolutionary conservation of histone macroH2A subtypes and domains. Nucleic Acids Res. 1998;26:2837–2842. doi: 10.1093/nar/26.12.2837. - DOI - PMC - PubMed
    1. Rivera-Casas C., Gonzalez-Romero R., Cheema M.S., Ausió J., Eirín-López J.M. The characterization of macroH2A beyond vertebrates supports an ancestral origin and conserved role for histone variants in chromatin. Epigenetics. 2016;11:415–425. doi: 10.1080/15592294.2016.1172161. - DOI - PMC - PubMed

Publication types

LinkOut - more resources