Adjustable Fluorescence Emission of J-Aggregated Tricarbocyanine in the Near-Infrared-II Region
- PMID: 37682586
- PMCID: PMC10518818
- DOI: 10.1021/acs.jpcb.3c04554
Adjustable Fluorescence Emission of J-Aggregated Tricarbocyanine in the Near-Infrared-II Region
Abstract
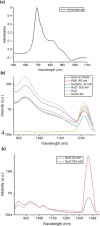
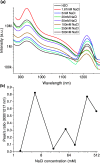
Near-infrared (NIR) J-aggregates attract increasing attention in many areas, especially in biomedical applications, as they combine the advantages of NIR spectroscopy with the unique J-aggregation properties of organic dyes. They enhance light absorption and have been used as effective biological imaging and therapeutic agents to achieve high-resolution imaging or effective phototherapy in vivo. In this work, we present novel J-aggregates composed of the well-known cyanine molecules. Cyanines are one of the few types of molecules whose absorption and emission can be shifted over a broad spectral range, from the ultraviolet (UV) to the NIR regime. They can easily transform into J-aggregates with narrow absorption and emission peaks, which is accompanied by a red shift in their spectra. In this work, we show, for the first time, that the tricarbocyanine dye (IR 820) has two sharp fluorescence emission bands in the NIR-II region with high photostability. These emission bands can be tuned to a desired wavelength in the range of 1150-1560 and 1675 nm, with a linear dependence on the excitation wavelength. Cryogenic transmission electron microscopy (cryo-TEM) images are presented, and combined with molecular modeling analysis, they confirm IR 820 π-stacked self-assembled fibrous structures.
Conflict of interest statement
The authors declare no competing financial interest.
Figures


References
-
- Hong G.; Antaris A. L.; Dai H. Near-Infrared Fluorophores for Biomedical Imaging. Nat. Biomed. Eng. 2017, 1, 0010.10.1038/s41551-016-0010. - DOI
-
- Li Y.; Liu Y.; Li Q.; Zeng X.; Tian T.; Zhou W.; Cui Y.; Wang X.; Cheng X.; Ding Q.; et al. Novel Nir-Ii Organic Fluorophores for Bioimaging Beyond 1550 Nm. Chem. Sci. 2020, 11, 2621–2626. 10.1039/C9SC06567A. - DOI
-
- Carr J. A.; Franke D.; Caram J. R.; Perkinson C. F.; Saif M.; Askoxylakis V.; Datta M.; Fukumura D.; Jain R. K.; Bawendi M. G.; Bruns O. T. Shortwave Infrared Fluorescence Imaging with the Clinically Approved near-Infrared Dye Indocyanine Green. Proc. Natl. Acad. Sc. U.S.A. 2018, 115, 4465–4470. 10.1073/pnas.1718917115. - DOI - PMC - PubMed
-
- Li L.; Dong X.; Li J.; Wei J. A Short Review on Nir-Ii Organic Small Molecule Dyes. Dyes Pigm. 2020, 183, 10875610.1016/j.dyepig.2020.108756. - DOI
LinkOut - more resources
Full Text Sources
Research Materials
Miscellaneous

