. 2023 Sep 26;42(9):113099.
doi: 10.1016/j.celrep.2023.113099. Epub 2023 Sep 8.

ATAC and SAGA co-activator complexes utilize co-translational assembly, but their cellular localization properties and functions are distinct

Affiliations

ATAC and SAGA co-activator complexes utilize co-translational assembly, but their cellular localization properties and functions are distinct

Gizem Yayli et al. Cell Rep. .

Abstract

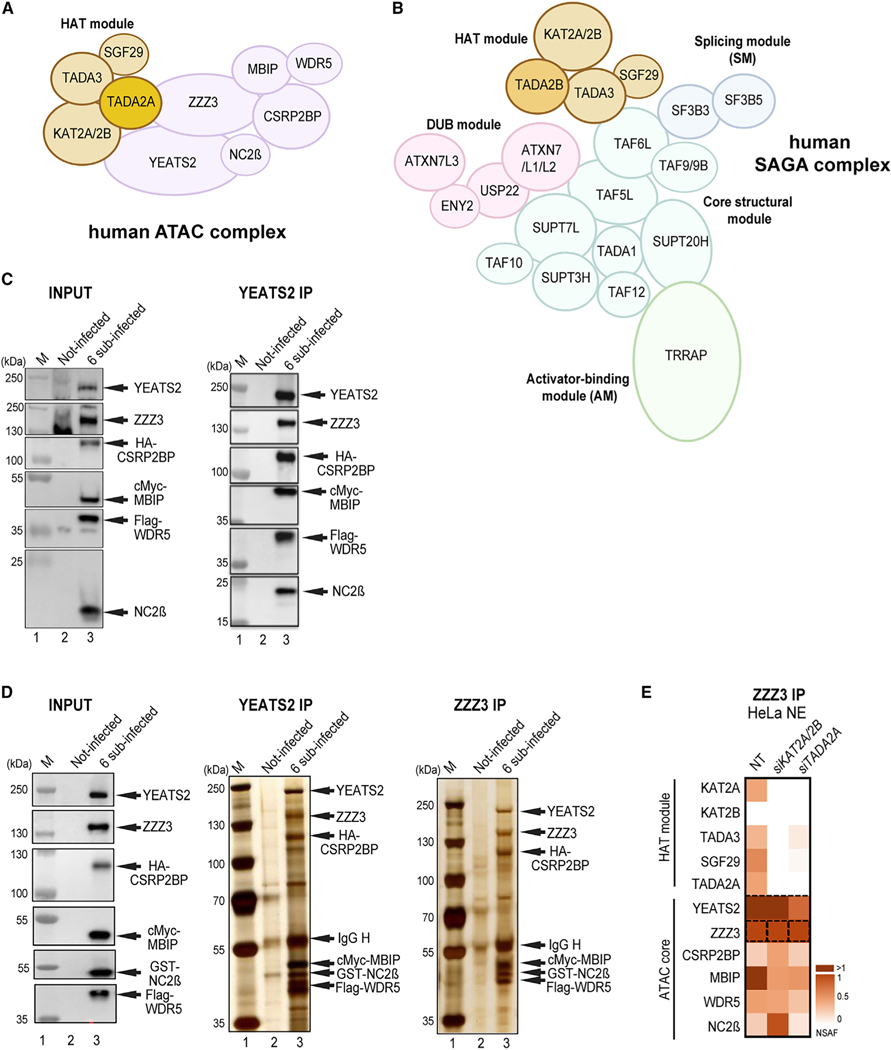
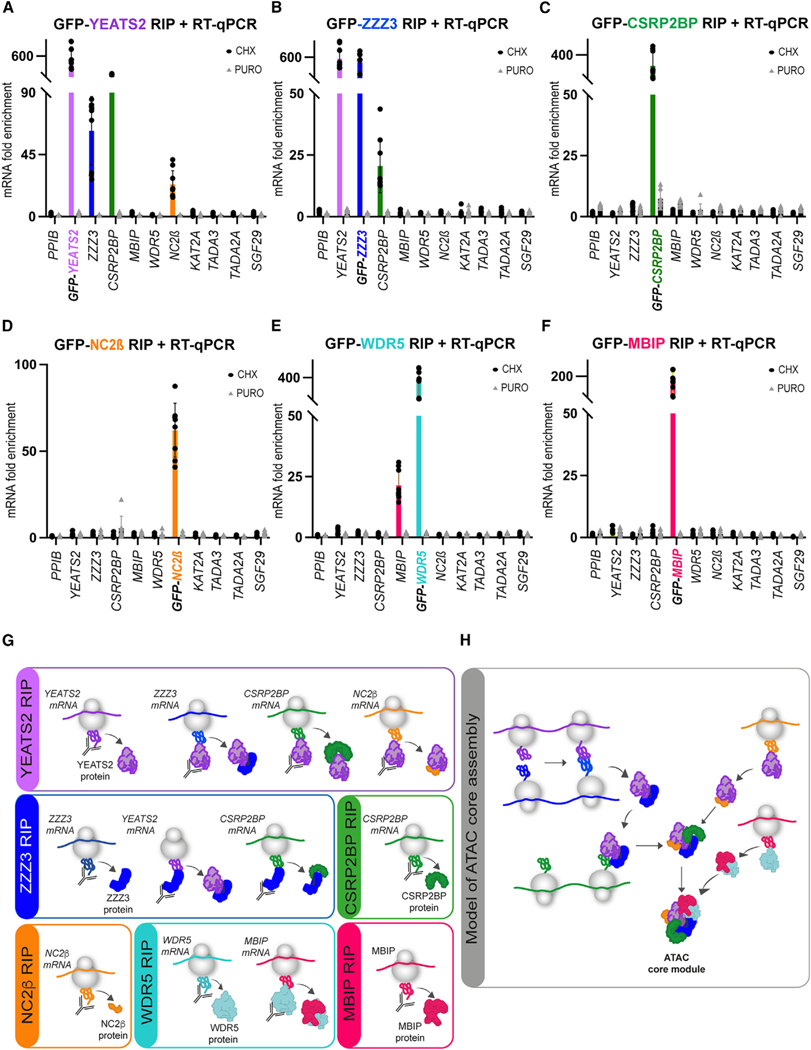
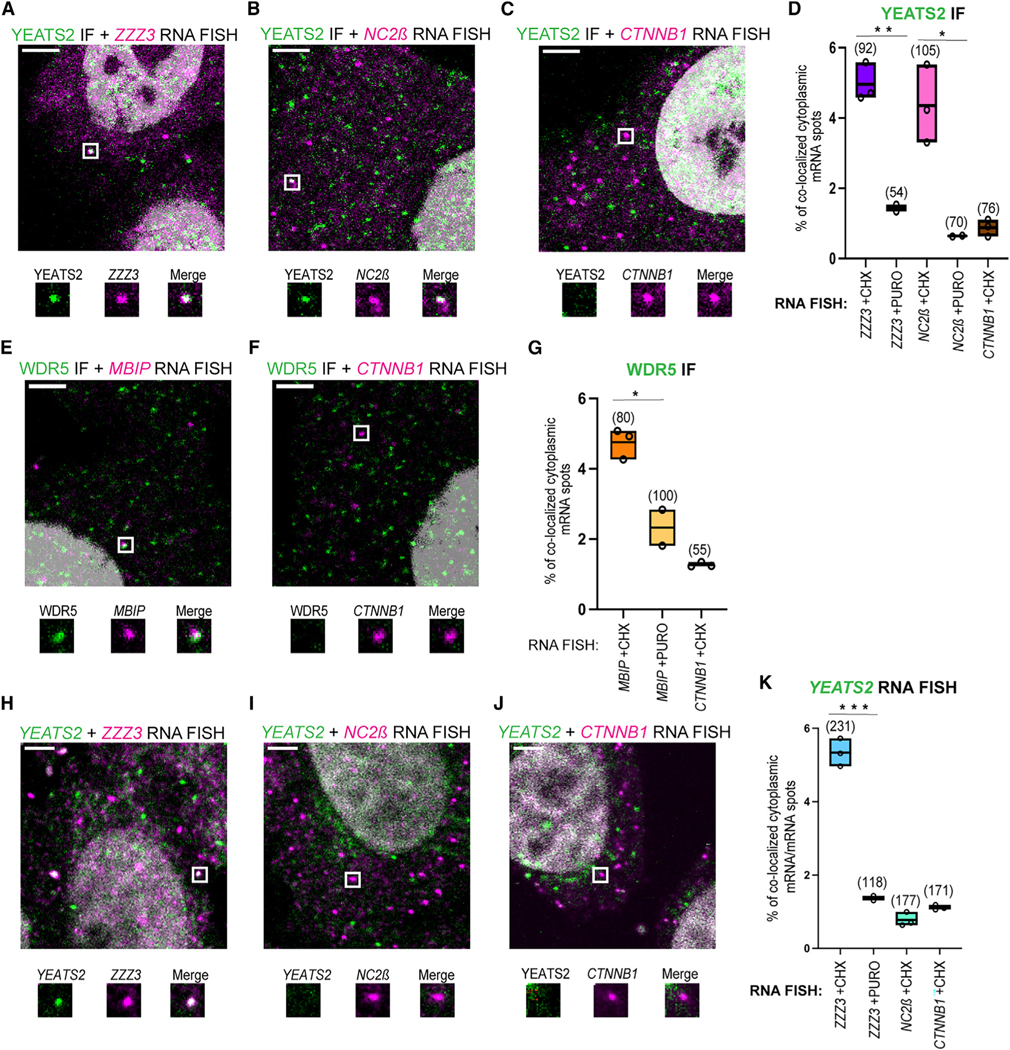
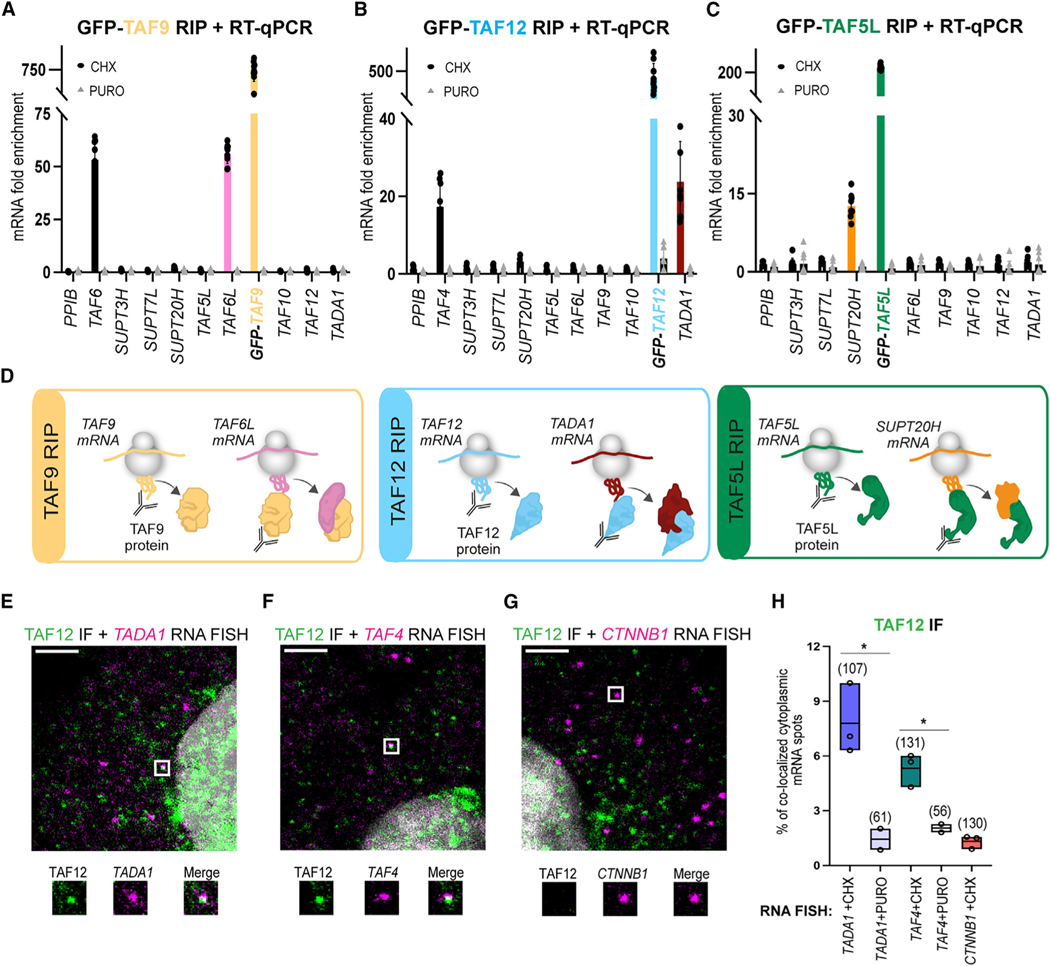
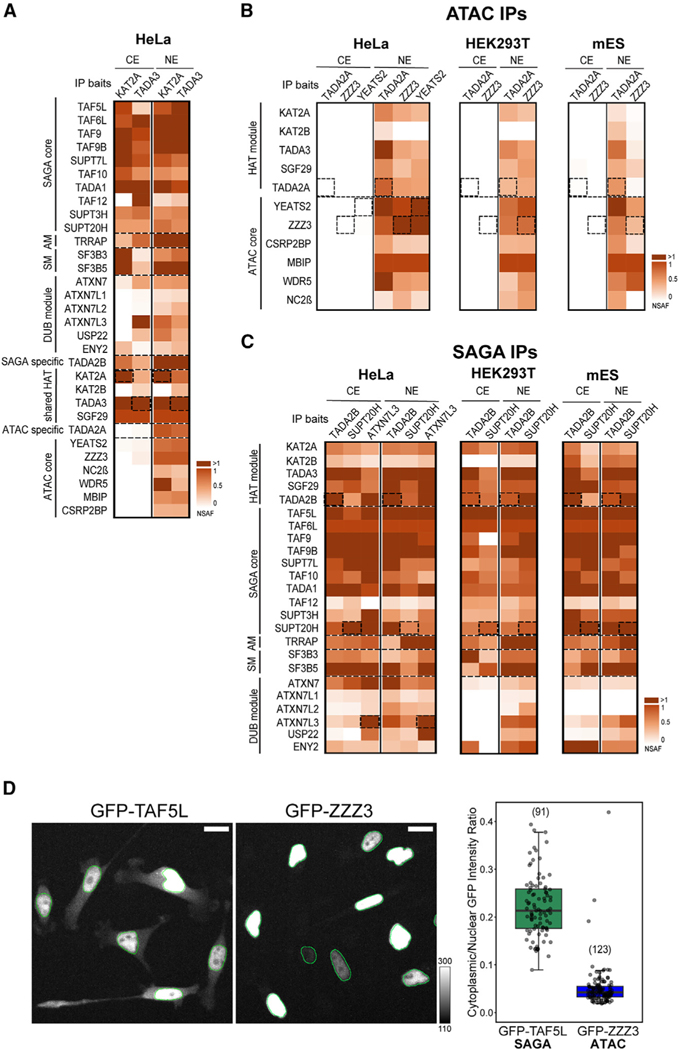
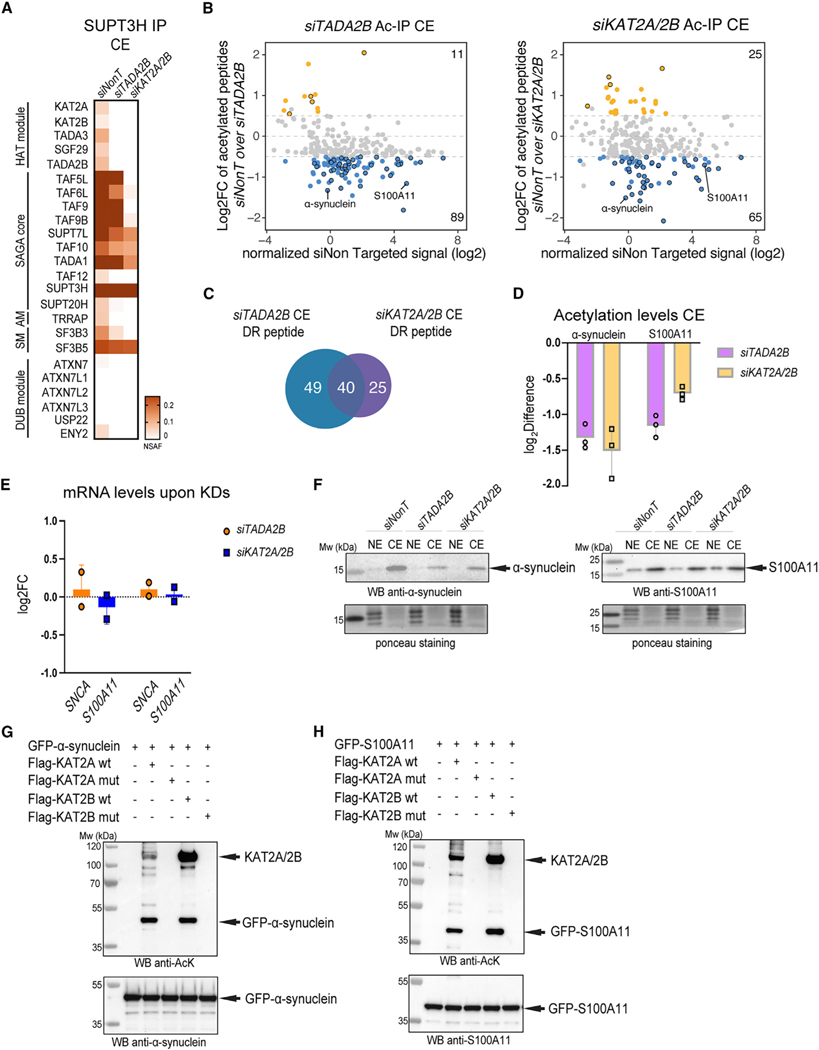
To understand the function of multisubunit complexes, it is of key importance to uncover the precise mechanisms that guide their assembly. Nascent proteins can find and bind their interaction partners during their translation, leading to co-translational assembly. Here, we demonstrate that the core modules of ATAC (ADA-two-A-containing) and SAGA (Spt-Ada-Gcn5-acetyltransferase), two lysine acetyl transferase-containing transcription co-activator complexes, assemble co-translationally in the cytoplasm of mammalian cells. In addition, a SAGA complex containing all of its modules forms in the cytoplasm and acetylates non-histone proteins. In contrast, ATAC complex subunits cannot be detected in the cytoplasm of mammalian cells. However, an endogenous ATAC complex containing two functional modules forms and functions in the nucleus. Thus, the two related co-activators, ATAC and SAGA, assemble using co-translational pathways, but their subcellular localization, cytoplasmic abundance, and functions are distinct.

Keywords: CP: Molecular biology; RIP; RNA immunoprecipitation; YEATS2; ZZZ3; biogenesis; co-translation; lysine acetylation; multiprotein complex; non-histone protein; ribosome; single-molecule RNA FISH; transcription regulation.


Conflict of interest statement

Declaration of interests The authors declare no competing interests.

Figures

Figure 1.
Figure 1.. Schematic illustration of ATAC and SAGA complexes and pathways of co-TA assembly of protein partners
(A) Illustration of the human ATAC complex with its four-subunit HAT module. (B) Illustration of the human SAGA complex. The functional modules of SAGA, such as the HAT, the deubiquitinating (DUB), the core, the splicing (SM), and the activator-binding (AM) modules are indicated. (C and D) Insect SF9 cells were either not infected (Not-infected) or co-infected with vectors expressing the six subunits of the recombinant ATAC complex (6 sub-infected): YEATS2, ZZZ3, HA-CSRP2BP, cMyc-MBIP, FLAG-WDR5, and NC2β (in C) or with YEATS2, ZZZ3, HA-CSRP2BP, cMyc-MBIP, FLAG-WDR5, and GST-NC2β (in D). 48 h post-infection, whole-cell extracts were made (INPUT), and anti-YEAST2 or anti-ZZZ3 IPs were carried out. The INPUT (in C and D), IPed, and peptide-eluted complexes were either tested by western blot analyses with the indicated antibodies (in C) or by silver staining of the 10% SDS-PAGE gels (in D). Molecular weight markers (Ms) are indicated in kDa. N = 2. (E) HeLa cells were transfected with either siKAT2A/KAT2B (siKAT2A/2B), or siTADA2A siRNAs, or not (NT). 48 h post-transfection, NEs were prepared and an anti-ZZZ3 IP carried out. IPed endogenous ATAC subunits were analyzed by mass spectrometry. Three technical replicates (n = 3) were carried out, and normalized spectral abundance factor (NSAF) values were calculated (see also Table S3). NSAF values were normalized to the bait of the IP (ZZZ3). The normalized NSAF values are represented as heatmaps with the indicated scales. ATAC complex subunits and modules are indicated on the left.
Figure 2.
Figure 2.. co-TA assembly of the ATAC core module
(A–F) HeLa FRT cells expressing N-terminally GFP-tagged ATAC subunits (indicated in A–F with distinct colors) were treated either with cycloheximide (CHX) or puromycin (PURO). Polysome extracts were prepared, anti-GFP-coupled RNA IP (RIP) was carried out, and coIPed RNAs were analyzed by qRT-PCR. (A) GFP-YEAST2 RIP coIPed its own YEATS2 mRNA (pink bar) and endogenous ZZZ3 (blue bar), CSRP2BP (green), and NC2β (orange) mRNAs. (B) GFP-ZZZ3 RIP coIPed its own ZZZ3 mRNA (blue bar) and endogenous YEATS2 (pink bar), as well as CSRP2BP (green bar) mRNAs. (C) GFP-CSRP2BP RIP coIPed its own CSRP2BP mRNA (green bar). (D) GFP-NC2β RIP coIPed its own NC2β mRNA (orange bar). (E) GFP-WDR5 RIP coIPed its own WDR5 mRNA (turquoise bar) and endogenous MBIP mRNA (magenta bar). (F) GFP-MBIP RIP coIPed its own MBIP mRNA (magenta bar). In (A)–(F), results of CHX-treated cells are shown with black dots and results of PURO-treated cells with gray triangles. Rabbit immunoglobulin G (IgG) was used for mock RIPs. mRNA fold enrichment is expressed as a fold change with respect to the mock RIP by using the formula ΔΔCp[anti–GFP RIP/mock RIP]. Error bars ± SD are from three biological replicates (N = 3). Each black dot or gray triangle represents three technical replicates (n = 3). The unrelated PPIB mRNA was used as a negative control in all qRT-PCR experiments. (G) Drawings representing the results obtained in (A)–(F). (H) Proposed ATAC core assembly model.
Figure 3.
Figure 3.. Co-localization of endogenous ATAC subunits with mRNAs coding for their corresponding interacting partner and mRNAs coding for simultaneous co-TA partners
Confocal microscopy imaging was used to detect endogenous ATAC subunits with mRNAs of their interacting partners by combining single-molecule RNA FISH (smiFISH) and immunofluorescence (IF). Representative multicolor confocal images for IF-coupled smiFISH images of fixed HeLa cells. Each image is a single multichannel confocal optical slice. Co-localized spots are indicated with white rectangles, and zoomed-in regions are shown under every image. Scale bar: 3 μm. (A–C) ZZZ3, NC2β, or CTTNB1 smiFISH mRNA signal is shown in magenta; IF signal for YEATS2 protein is in green. (D and G) Boxplots showing the percentage of cytoplasmic RNA spots co-localized with protein spots in IF-smiFISH experiments. (E and F) MBIP or CTTNB1 smiFISH mRNA signal is shown in magenta; IF signal for WDR5 protein is shown in green. (H–J) Dual-color smiFISH images in HeLa cells. Cy3-smiFISH signal for ZZZ3, NC2β, and CTTNB1 mRNAs is shown in magenta; ATTO488-smiFISH signal for YEATS2 mRNA is shown in green. (K) Boxplots showing the percentage of cytoplasmic YEATS2 RNA spots co-localized with the indicated RNA target spots in dual-color smiFISH experiments. Each black circle represents one biological replicate. N = 3 for the cells treated with CHX, and N = 2 for the cells treated with PURO. For each condition, the number of cells analyzed is indicated in brackets above each boxplot. Unpaired two-tailed t tests were performed for statistical analyses between two different experimental condition (CHX and PURO). *p ≤ 0.05, **p ≤ 0.01, ***p ≤ 0.001.
Figure 4.
Figure 4.. co-TA assembly of SAGA core subunits and co-localization of endogenous TAF12 protein with TADA1 mRNA in cytoplasm
(A–C) HeLa FRT cells expressing N-terminally GFP-tagged SAGA subunits (indicated in A–C with distinct colors) were treated either with CHX or PURO. Polysome extracts were prepared, anti-GFP-coupled RIP was carried out, and coIPed RNAs were analyzed by qRT-PCR. (A) GFP-TAF9 RIP coIPed its own TAF9 mRNA (yellow bar) and endogenous TAF6 (black bar), as well as TAF6L (pink bar) mRNAs. (B) GFP-TAF12 RIP coIPed its own TAF12 mRNA (blue bar) and endogenous TAF4 (black bar), as well as TADA1 (dark red bar) mRNAs. (C) GFP-TAF5L RIP coIPed its own TAF5L mRNA (green bar) and endogenous SUPT20H mRNA (orange bar). In (A)–(C), results of CHX-treated cells are represented with black dots, and results of PURO-treated cells are represented by gray triangles. Rabbit IgG was used as mock IP for RIP. mRNA fold enrichment is expressed as a fold change with respected to the mock RIP by using the formula ΔΔCp[anti–GFP RIP/mock RIP]. Error bars ± SD are from three biological replicates (N = 3). Each black dot or gray triangle represents three technical replicates (n = 3). The unrelated PPIB mRNA was used as a negative control in the qRT-PCR experiments. (D) Drawings representing the results obtained in (A)–(C). (E–G) Confocal microscopy imaging was used to detect endogenous TAF12 protein with its interacting partner mRNAs, TADA1 or TAF4, by smiFISH and IF. smiFISH signal for TADA1, TAF4, and CTTNB1 mRNAs is shown in magenta; IF signal for TAF12 protein in shown green. Each image is a single multichannel confocal optical slice. Co-localized spots are indicated with white rectangles, and zoomed-in regions are shown under every panel. Scale bar: 3 μm. (H) Boxplot showing the percentage of cytoplasmic RNA spots co-localized with protein spots in IF-smiFISH experiments. Each black circle represents one biological replicate. N = 3 for the cells treated with CHX, and N = 2 for the cells treated with PURO. For each condition, the number of cells analyzed is indicated in brackets above each boxplot. Unpaired two-tailed t test was performed for statistical analyses between two different experimental condition (CHX and PURO). *p ≤ 0.05, **p ≤ 0.01, ***p ≤ 0.001.
Figure 5.
Figure 5.. Human SAGA complex can be isolated from both nuclear and cytoplasmic compartments, while human ATAC is only detectable in the nucleus
(A) Mass spectrometry analyses of KAT2A andTADA3 IPs carried out using either NEs or CEs (as indicated) prepared from human HeLa cells. NSAF values were calculated and normalized to SGF29 values. (B) Mass spectrometry analyses of TADA2A, YEATS2, and ZZZ3 IPs carried out using NEs and CEs (as indicated) prepared from human HeLa cells (left) and of TADA2A and ZZZ3 IPs carried out using NEs and CEs prepared from either human HEK293T cells (middle) or mESCs (right). NSAF values were calculated and normalized to MBIP values in all NE IPs. (C) Mass spectrometry analysis of TADA2B, SUPT20H, and ATXN7L3 IPs carried out using NEs and CEs (as indicated) prepared from either HeLa cells (left) or of TADA2B and SUPT20H IPs carried out using NEs and CEs prepared from either HEK293T cells (middle) or mESCs (right). NSAF values were calculated and normalized to TAF6L values in all IPs. In (A)–(C), three technical replicates were carried out per IP (n = 3; see also Table S4). NSAF values were calculated and normalized to SGF29 (A), MBIP (B), and TAF6L (C). Normalized NSAF results are represented as heatmaps with indicated scales. Dotted boxes indicate the bait protein for a given IP. The known modules of the SAGA complex, such as the HAT module, DUB module, core module, structural module, SM, and AM are indicated. ATAC HAT and core modules are indicated. In (A), the shared HAT subunits are highlighted and the specific HAT subunits indicated. Dotted lines separate functional modules of ATAC and SAGA complexes. (D) Live-cell measurement of subcellular distribution in GFP-TAF5L (SAGA subunit) and GFP-ZZZ3 (ATAC subunit) HeLa FRT cells. Cells were induced to express the respective GFP-fusion protein for 8 h before imaging (N = 3). Two representative GFP Z maximum intensity projections are shown for each cell line with overlayed nuclear outlines in green. The mean GFP cytoplasmic/nuclear intensity ratio for each cell (shown as a dot) is plotted on the right.
Figure 6.
Figure 6.. The SAGA complex acetylates non-histone proteins in the cytoplasm
(A) HeLa cells were transfected with of siNon-targeting (siNonT), siTADA2B, and siKAT2A/2B siRNAs for 48 h, CEs were prepared, and anti-SUPT3H IP-coupled mass spectrometry analysis was carried out. NSAF values were calculated (n = 3; see Table S5 for proteins found in each IP). NSAF values were normalized to the bait SUPT3H, and the results are represented as heatmaps with the indicated scales. The different modules of the SAGA complex are indicated. (B) Acetylated-lysine IPs were carried out from siNonT-, siTADA2B-, or siKAT2A/2B-treated CEs and analyzed by mass spectrometry (n = 3; see also Table S6 for acetylated proteins found in each IP carried out from CE extracts and their corresponding acetylated lysine residues). Left, MA plot represents log2fold change (FC) of siTADA2B over siNonT (y axis) versus siNonT normalized signal intensity in log2 (x axis). Right, MA plot represents log2FC of siKAT2A/2B over siNonT (y axis) versus siNonT normalized signal intensity in log2 (x axis). Peptides that have upregulated acetylation levels are indicated with orange dots. Peptides that have downregulated acetylation levels are indicated with blue dots. Peptides that have upregulated or downregulated acetylation levels in both KD (TADA2B and KAT2A/KAT2B) conditions are indicated with black circles in each category. (C) Venn diagram shows number of peptides that had significantly downregulated (DR) acetylation levels under either siTADA2B (blue) or siKAT2A/2B (purple) KD conditions. (D) Log2 difference of acetylation levels of α-synuclein or S100A11 in both KD condition. Error bars ± SD (n = 3). (E and F) In vitro acetylation (AT) assay. KAT2A WT, KAT2B WT, and their corresponding catalytic dead mutants (muts) were purified from baculovirus-infected Sf9 cells and GFP-α-synuclein and GFP-S100A11 from transfected HeLa cells. (E) qRT-PCR analysis of mRNA levels of SNCA and S100A11 upon siTADA2B- or siKAT2A/2B-mediated KDs. Error bars ± SD (N = 2). Log2FC was calculated with the 2−ΔΔCT method. GAPDH mRNA was used as an internal control. (F) Western blot analyses of α-synuclein or S100A11 protein levels in both NEs and CEs upon control and siTADA2B or siKAT2A/2B KDs. The left membrane was incubated with anti-α-synuclein antibodies and the right membrane with anti-S100A11 antibodies. Arrows indicate the corresponding proteins. Ponceau S staining was used as a loading control. (G) In vitro AT of GFP-α-synuclein by KAT2A and KAT2B acetyltransferases. The order of protein addition in the reaction mixtures is depicted on the top. The top membrane shows western blot (WB) analysis using an anti-acetylated lysine antibody and the bottom membrane using an anti-α-synuclein antibody. (H) In vitro AT of GFP-S100A11 by KAT2A and KAT2B acetyltransferases. The order of protein addition in the reaction mixtures is depicted on the top. The top membrane was immunoblotted with anti-acetylated lysine antibody and the bottom membrane with anti-S100A11 antibody. In (F)–(H), arrows indicate the corresponding proteins, and molecular weight (Mw) markers are indicated in kDa.

Update of

Similar articles

Cited by

References

    1. Yun M, Wu J, Workman JL, and Li B (2011). Readers of histone modifications. Cell Res. 21, 564–578. 10.1038/cr.2011.42. - DOI - PMC - PubMed
    1. Bannister AJ, and Kouzarides T (2011). Regulation of chromatin by histone modifications. Cell Res. 21, 381–395. 10.1038/cr.2011.22. - DOI - PMC - PubMed
    1. Helmlinger D, and Tora L (2017). Sharing the SAGA. Trends Biochem. Sci. 42, 850–861. 10.1016/j.tibs.2017.09.001. - DOI - PMC - PubMed
    1. Helmlinger D, Papai G, Devys D, and Tora L (2021). What do the structures of GCN5-containing complexes teach us about their function? Biochim. Biophys. Acta. Gene Regul. Mech. 1864, 194614. 10.1016/j.bbagrm.2020.194614. - DOI - PubMed
    1. Riss A, Scheer E, Joint M, Trowitzsch S, Berger I, and Tora L (2015). Subunits of ADA-two-A-containing (ATAC) or Spt-Ada-Gcn5-acetyltrasferase (SAGA) Coactivator Complexes Enhance the Acetyltransferase Activity of GCN5. J. Biol. Chem. 290, 28997–29009. 10.1074/jbc.M115.668533. - DOI - PMC - PubMed

Publication types