. 2023 Sep;131(9):97004.
doi: 10.1289/EHP12207. Epub 2023 Sep 8.

Effects of Gestational Arsenic Exposures on Placental and Fetal Development in Mice: The Role of Cyr61 m6A

Affiliations

Effects of Gestational Arsenic Exposures on Placental and Fetal Development in Mice: The Role of Cyr61 m6A

Ya-Ping Song et al. Environ Health Perspect. 2023 Sep.

Abstract

Background: Several epidemiological investigations demonstrated that maternal arsenic (As) exposure elevated risk of fetal growth restriction (FGR), but the mechanism remains unclear.

Objectives: This study aimed to investigate the effects of gestational As exposure on placental and fetal development and its underlying mechanism.

Methods: Dams were exposed to 0.15, 1.5, and 15mg/L NaAsO2 throughout pregnancy via drinking water. Sizes of fetuses and placentas, placental histopathology, and glycogen content were measured. Placental RNA sequencing was conducted. Human trophoblasts were exposed to NaAsO2 (2μM) to establish an in vitro model of As exposure. The mRNA stability and protein level of genes identified through RNA sequencing were measured. N6-Methyladenosine (m6A) modification was detected by methylated RNA immunoprecipitation-quantitative real-time polymerase chain reason (qPCR). The binding ability of insulin-like growth factor 2 binding protein 2 to the gene of interest was detected by RNA-binding protein immunoprecipitation-qPCR. Intracellular S-adenosylmethionine (SAM) and methyltransferase activity were determined by liquid chromatography-tandem mass spectrometry (LC-MS/MS) and colorimetry, respectively. In vitro As+3 methyltransferase (As3MT) knockdown or SAM supplementation and in vivo folic acid (FA) supplementation were used to evaluate the protective effect. A case-control study verified the findings.

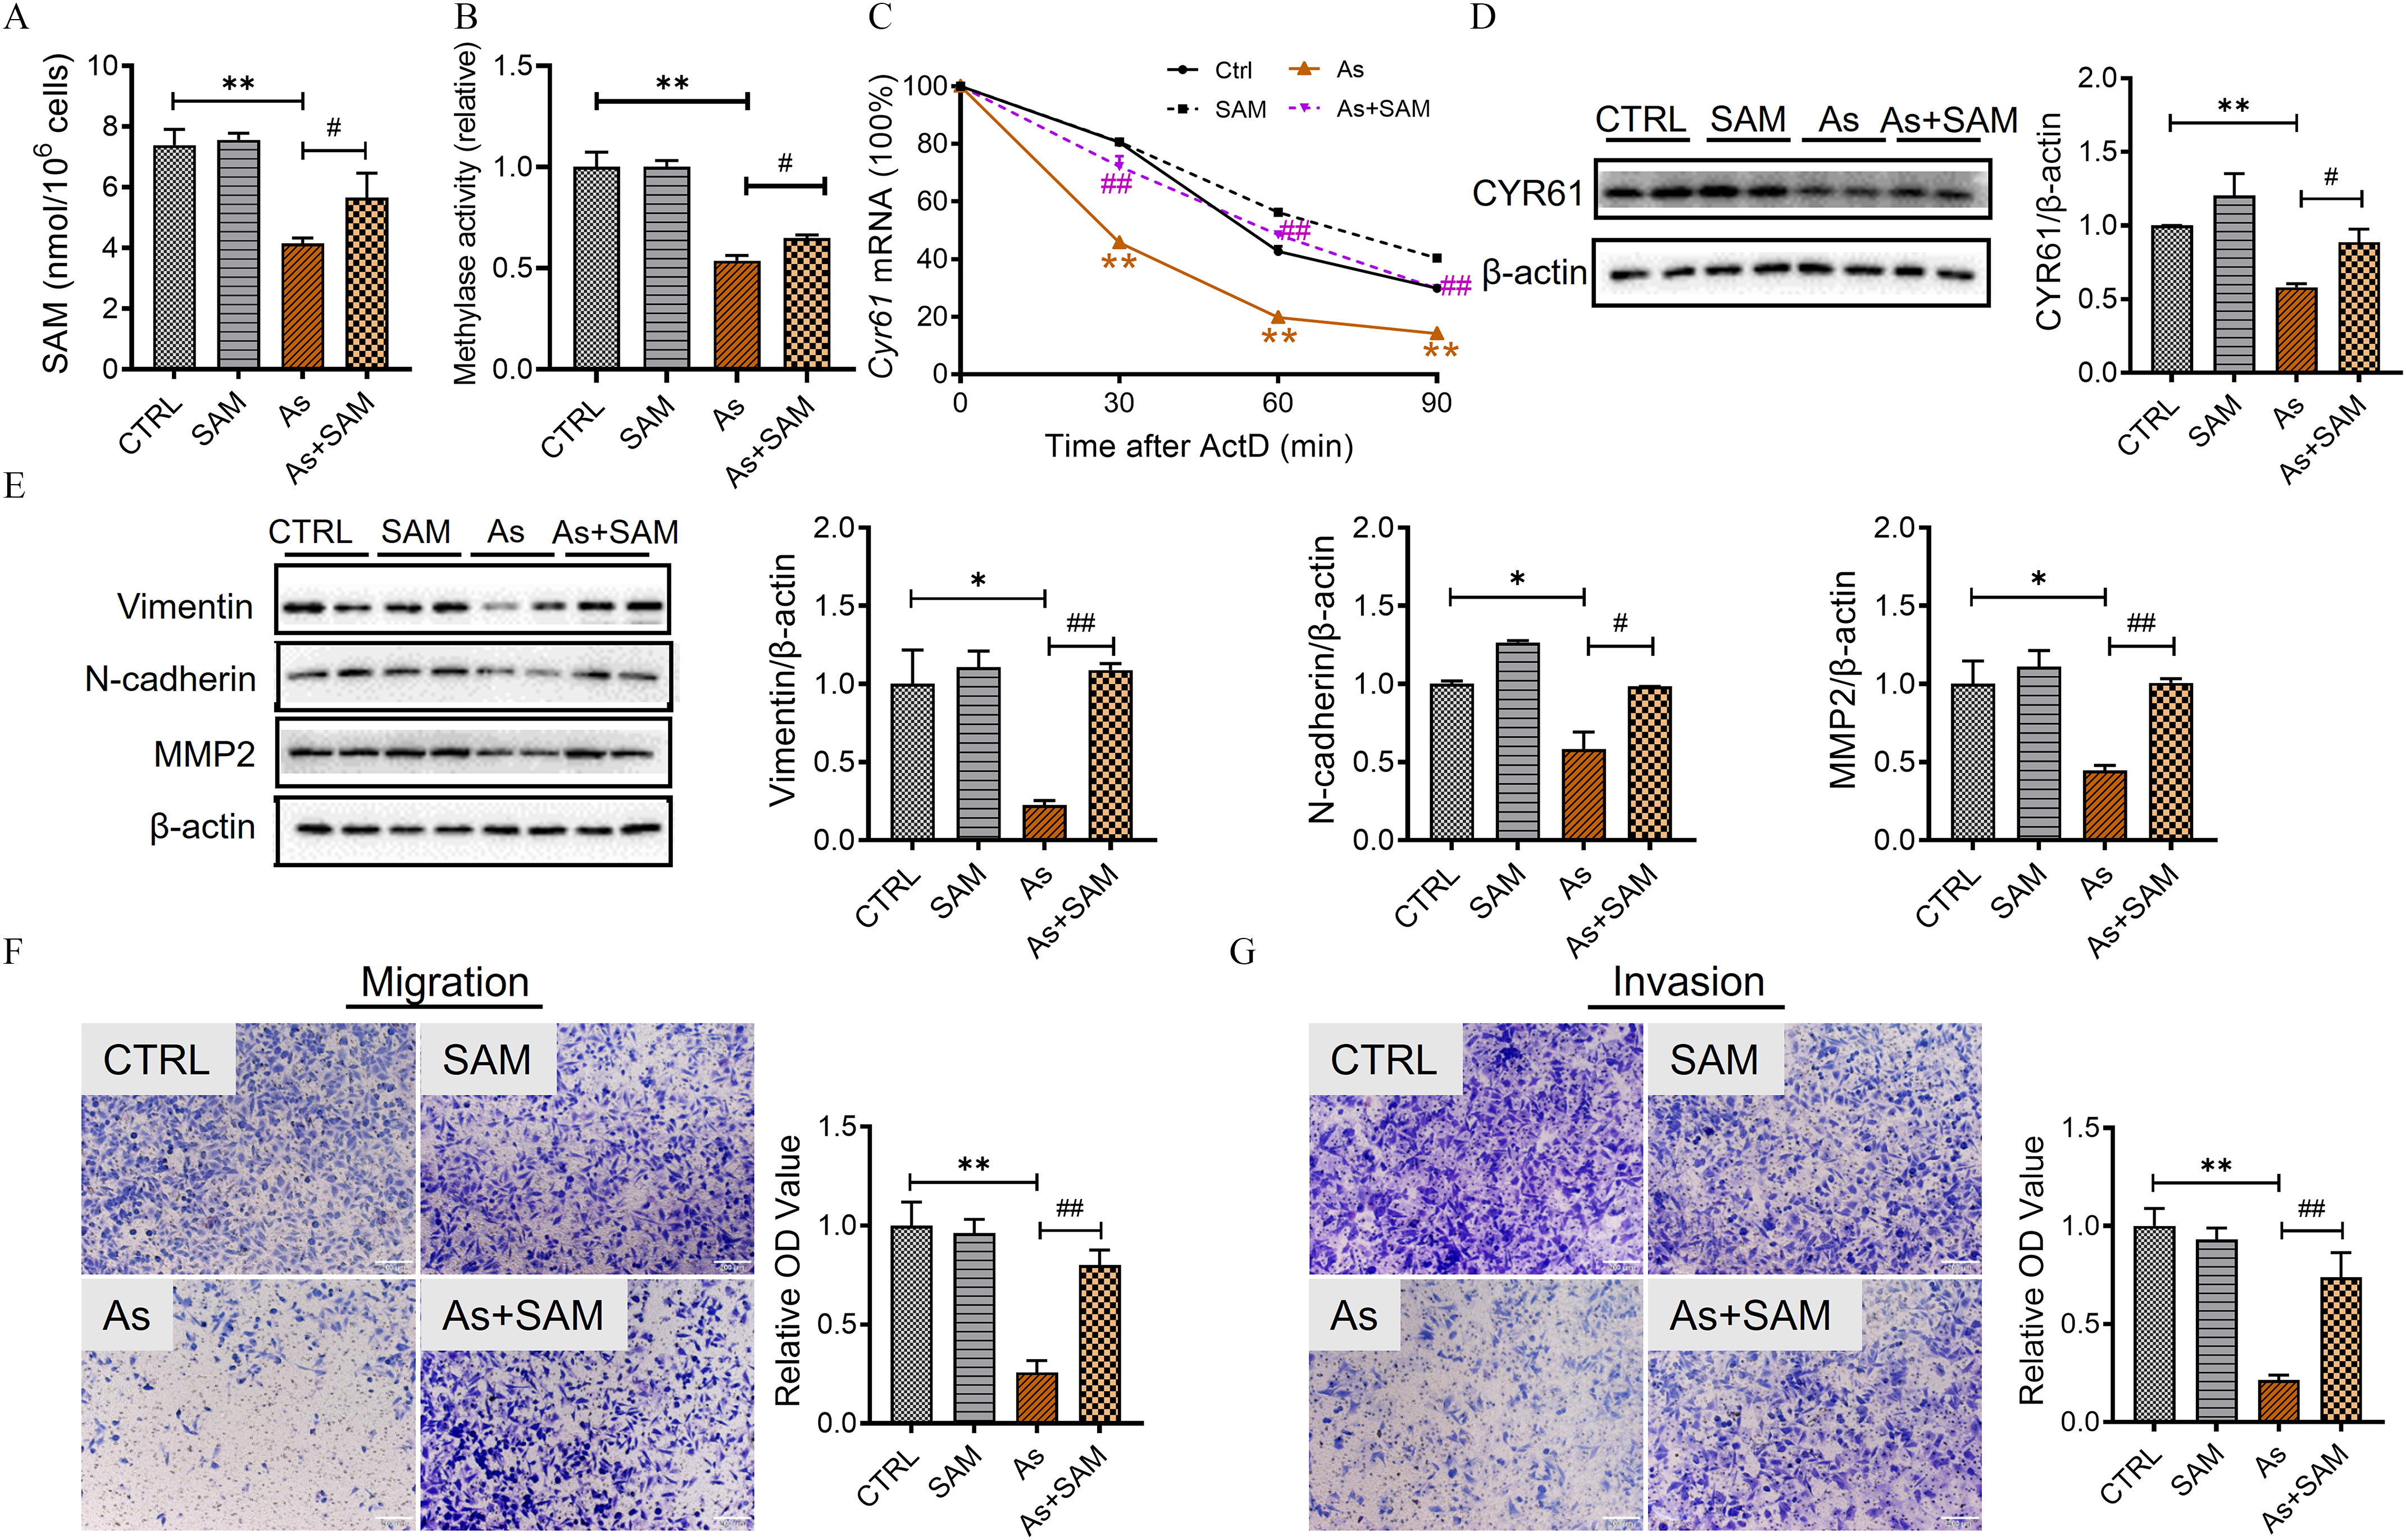
Results: Sizes of fetuses (exposed to 1.5 and 15mg/L NaAsO2) and placentas (exposed to 15mg/L NaAsO2) were lower in As-exposed mice. More glycogen+ trophoblasts accumulated and the expression of markers of interstitial invasion was lower in the 15mg/L NaAsO2-exposed mouse group in comparison with control. Placental RNA sequencing identified cysteine-rich angiogenic inducer 61 (Cyr61) as a candidate gene of interest. Mechanistically, mice and cells exposed to As had lower protein expression of CYR61, and this was attributed to a lower incidence of Cyr61 m6A. Furthermore, cells exposed to As had lower methyltransferase activity, suggesting that this could be the mechanism by which Cyr61 m6A was affected. Depletion of intracellular SAM, a cofactor for m6A methyltransferase catalytic domain, partially contributed to As-induced methyltransferase activity reduction. Either As3MT knockdown or SAM supplementation attenuated As-induced Cyr61 m6A down-regulation. In mice, FA supplementation rescued As-induced defective trophoblastic invasion and FGR. In humans, a negative correlation between maternal urinary As and plasma CYR61 was observed in infants who were small for gestational age.

Discussion: Using in vitro and in vivo models, we found that intracellular SAM depletion-mediated Cyr61 m6A down-regulation partially contributed to As-induced defective trophoblastic invasion and FGR. https://doi.org/10.1289/EHP12207.


Figures

Figure 1A is a set of one western blot and three bar graphs. The western blot displays two columns, namely, control and arsenic-H for mouse placenta and four rows, namely, E-cadherin, Vimentin, N-cadherin, lowercase beta actin. The three bar graph plots E-cadherin per lowercase beta actin, ranging from 0 to 4 in unit increments; Vimentin per lowercase beta actin, ranging from 0.0 to 1.5 in increments of 0.5; N-cadherin per lowercase beta actin, ranging from 0.0 to 1.5 in increments of 0.5 (y-axis) across control and arsenic-H (x-axis). Figure 1B is a set of one western blot and two western blots. The western blot displays two columns, namely, control and arsenic-H for mouse placenta and three rows, namely, matrix metalloproteinases 2, matrix metalloproteinases 9, and lowercase beta actin. The two bar graphs plots matrix metalloproteinases 2 per lowercase beta actin, ranging from 0.0 to 1.5 in increments of 0.5 and matrix metalloproteinases 9 per lowercase beta actin, ranging from 0.0 to 15 in increments of 0.5 (y-axis) across control and arsenic-H (x-axis). Figure 1C is a set of one stained tissue and one bar graph. The stained tissue displays two columns, namely, control and arsenic for H T R 8 per SVneo cells and three rows, namely, 0 hour, 12 hours, 24 hours. The bar graph plots percentage of wound closing, ranging from 0 to 100 in increments of 20 (y-axis) across hours, ranging from 12 to 24 in increments of 12 (x-axis) for control and arsenic. Figure 1D is a set of one stained tissue and one bar graph. The stained tissue displays two rows, namely, control and arsenic for H T R 8 per SVneo cells. The bar graph plots relative O D, ranging from 0.0 to 1.5 in increments of 0.5 (y-axis) across control and arsenic (x-axis) for migration. Figure 1E is a set of one stained tissue and one bar graph. The stained tissue displays two rows, namely, control and arsenic for H T R 8 per SVneo cells. The bar graph plots relative O D, ranging from 0.0 to 1.5 in increments of 0.5 (y-axis) across control and arsenic (x-axis) for invasion. Figure 1F is a set of one western blot and three bar graphs. The western blot displays two columns, namely, control and arsenic for H T R 8 per SVneo cells and four rows, namely, Occludin, Vimentin, N-cadherin, lowercase beta actin. The three bar graphs plot Occludin per lowercase beta actin, ranging from 0 to 3 in unit increments; Vimentin per lowercase beta actin, ranging from 0.0 to 1.5 in increments of 0.5; N-cadherin per lowercase beta actin, ranging from 0.0 to 1.5 in increments of 0.5 (y-axis) across control and arsenic (x-axis). Figure 1G is a set of one western blot and two western blots. The western blot displays two columns, namely, control and arsenic for H T R 8 per SVneo cells and three rows, namely, matrix metalloproteinases 2, matrix metalloproteinases 9, and lowercase beta actin. The two bar graphs plots matrix metalloproteinases 2 per lowercase beta actin, ranging from 0.0 to 1.5 in increments of 0.5 and matrix metalloproteinases 9 per lowercase beta actin, ranging from 0.0 to 15 in increments of 0.5 (y-axis) across control and arsenic (x-axis).
Figure 1.
Effects of As exposure on interstitial migration and invasion in mouse placentas and human placental trophoblasts. (A and B) All pregnant mice except controls were exposed to 15mg/L NaAsO2 by drinking water throughout pregnancy. All pregnant mice were sacrificed on GD18. Placental E-cadherin, vimentin, N-cadherin, MMP2, and MMP9 were measured by immunoblotting. (A) E-cadherin, Vimentin and N-cadherin (n=3 mice/group, repeated three times); (B) MMP2 and MMP9 (n=3 mice/group, repeated three times). (C–G) HTR-8/SVneo cells were exposed to NaAsO2 (2μM). (C) Cell migration was detected by wound-healing assay (n=3 samples/group, repeated 2 times). (D) Cell migration was detected by transwell migration assay (n=3 samples/group, repeated 2 times). Representative photomicrographs are shown. Scale bars, 200μm. (E) Cell invasion was detected by transwell invasion assay (n=3 samples/group, repeated 2 times). Representative photomicrographs are show. Scale bars, 200μm. (F and G) Occuldin, vimentin, N-cadherin, MMP2, and MMP9 proteins in HTR8/SVneo cells were measured by immunoblotting (n=3 samples/group, repeated three times). All data are expressed as mean±SEM. The numeric data are shown in Table S8. Unpaired two-tailed Student’s t-test was used for A–G. *p<0.05, **p<0.01. Note: As, arsenic; As-H, 15mg/L NaAsO2; CTRL, control; GD, gestational day; MMP2 and MMP9, matrix metalloproteinases (MMP)2 and MMP9; SEM, standard error of the mean; μM, μmol/L.
Figure 2A is a volcano plot, plotting negative log 10 of (lowercase p), ranging from 0 to 120 in increments of 30 (y-axis) across log 2 of (fold change), ranging from negative 10 to 6 in increments of 2 (x-axis) for gene up, gene down, not differential gene expression, uppercase italic p underscore adjusted, and uppercase italic p. Figure 2B is a dot graph, plotting A B C transporters, Mineral absorption, cholesterol metabolism, E C M receptor interaction, steroid hormone biosynthesis, protein digestion and absorption, cell adhesion molecules, calcium signaling pathway, cytokine-cytokine receptor interaction, neuroactive ligand receptor interaction (y-axis) across gene ratio, ranging from 0.02 to 0.06 in increments of 0.02 (x-axis) for count and negative log 10 of (lowercase p). The count ranges from 20 to 60 in decrements of 20 and the negative log 10 of (lowercase p) ranges from 4 to 6 in increments of 2. Figure 2C is a heatmap, plotting Gjn 2, Bok, Fam 20 c, Anxa 8, C 77080, Cyr 61, Gprc 5 a, Rab 11 fip 1, Gpx 3, Tgfb 2, Rbp 4, Slc 38 a 1, Baiap 2 l 1, Cnih 1, A 2m, Rpn 2, Pdia 4, Prl 8 a 8, Ceacam 3, Gne, Ctsm, Pdia 3, Pdia 5, Atp 6 v 1 a, Hyou 1, Fbln 1, Derl 3, Cts 6, Dnajb 11, Tubb 3, Ceacam 13, Cair, Mfsd 2 a, Sparcl 1, Pdia 6, Hspa 5, Sdf 2 l 1, Nucb 2, Creld 2, Hsp9= 90 b 1 (y-axis) across C 1, C 2, C 3, A S 1, A S 2, and A S 3 (x-axis). A scale ranges from negative 1 to 1 in increments of 0.5. Figures 2D and 2E are clustered bar graph, plotting relative messenger ribonucleic acid, ranging from 0 to 3 in unit increments and fold change, ranging from 0 to 3 in unit increments (y-axis) across Sparcl 1, Ceacam 13, Ceacam 3, Tgfb 2, and Cyr 61 (x-axis) for control, arsenic-H, ribonucleic acid sequencing, and real-time reverse transcription polymerase chain reaction. Figures 2F and 2I are a set of one bar graph and one western blot. The bar graph plots C Y R 61 per lowercase beta actin, ranging from 0.0 to 1.5 in increments of 0.5 (y-axis) across control and arsenic-H (x-axis) for mouse placenta and H T R 8 per SVneo cells. The western blot displays two columns, namely, control and arsenic-H, and two rows, namely, C Y R 61 and lowercase beta actin. Figure 2G is a set of two stained tissues, depicting C Y R 61-positive cells in labyrinth zone and junctional zone under control and arsenic-H. Figure 2H is a bar graph, plotting relative cyr 61 per messenger ribonucleic acid, ranging from 0.0 to 1.5 in increments of 0.5 (y-axis) across control and arsenic for H T R 8 per SVneo cells. Figure 2J is a stained tissue displays three columns, namely, Hoechst 33342, Cyr 61, and Merge, and two rows, namely, control and arsenic.
Figure 2.
RNA-seq on placentas from mice exposed to NaAsO2. (A–G) All pregnant mice except controls were exposed to NaAsO2 (15mg/L) by drinking water throughout pregnancy. All pregnant mice were sacrificed on GD 18. (A) Volcano plot of differentially expressed genes in mouse placentas. A total of 743 genes (red triangle) were up-regulated, and 1,889 genes (green dot) were down-regulated by at least 1.5-fold with a significance level (p<0.05). (B) KEGG pathway analysis. (C) Top 100 genes were screened based on the p-value ranking of all differential genes and then we screened 40 candidate genes among them, with the average FPKM >10 of all samples as the filter condition. RNA-seq of mouse placentae from three dams were analyzed per group. (D) Validation of trophoblasts development-related differentially expressed genes by real-time RT-PCR (n=6 mice/group). (E) Fold differences in differentially expressed genes between RNA-seq and real-time RT-PCR. (F) Placental CYR61 was detected by immunoblotting (n=3 mice/group, repeated three times). (G) Representative pictures of CYR61-positive cells in labyrinth zone and junctional zone. Scale bars, 20μm (n=6 mice/group). (H–J) HTR-8/SVneo cells were exposed to NaAsO2 (2μM). (H) Cyr61 mRNA was measured by real-time RT-PCR (n=6 samples/group). (I) CYR61 protein was detected by immunoblotting (n=3 samples/group, repeated three times). (J) CYR61-positive cells were stained with by immunofluorescence (n=3 samples/group). All data are expressed as mean±SEM. The numeric data are shown in Table S8. RNA-seq data are reported in an Excel sheet and uploaded to the National Center for Biotechnology Information (GSE222092). Unpaired two-tailed Student’s t-test was used for D–F, H, I. *p<0.05, **p<0.01. Note: As, arsenic; As-H, 15mg/L NaAsO2; Ceacam 3/13, carcinoembryonic antigen-related cell adhesion molecule 3/13; CTRL, control; CYR61, cysteine-rich angiogenic inducer 61; FPKM, fragments per kilobase per million; Not DEG, not differential gene expression; RNA-seq, RNA sequencing; RT-PCR, reverse transcription polymerase chain reaction; SEM, standard error of the mean; Sparcl1, SPARC-like protein 1; TGF-β2, transforming growth factor β2; μM, μmol/L.
Figures 3A and 3E are bar graphs, plotting relative cysteine-rich angiogenic inducer 61 messenger ribonucleic acid, ranging from 0 to 8 in increments of 2 and 0.0 to 1.5 in increments of 0.5 (y-axis) across control and cysteine-rich angiogenic inducer 61 overexpression, and control and shCyr 61 (x-axis). Figure 3B is set of one western blot and two bar graphs. The western blot displays four columns, namely, control, cysteine-rich angiogenic inducer overexpression, arsenic, cysteine-rich angiogenic inducer overexpression plus arsenic, and three rows, namely, vimentin, N-cadherin, and lowercase beta actin. The two bar graphs, plotting Vimentin per lowercase beta actin, ranging from 0.0 to 2.0 in increments of 0.5 and N-cadherin per lowercase beta actin, ranging from 0.0 to 2.0 in increments of 0.5 (y-axis) across control, cysteine-rich angiogenic inducer overexpression, arsenic, cysteine-rich angiogenic inducer overexpression plus arsenic (x-axis). Figures 3C and 3D are set of one stained tissue and one bar graph. The stained tissue displays cell migration and cell invasion in control, cysteine-rich angiogenic inducer overexpression, arsenic, cysteine-rich angiogenic inducer overexpression plus arsenic. The bar graphs plot relative O D, ranging from 0.0 to 15 in increments of 0.5 (y-axis) across control, cysteine-rich angiogenic inducer overexpression, arsenic, and cysteine-rich angiogenic inducer overexpression plus arsenic (x-axis) for migration and invasion. Figure 3F is a set of one western blot and two bar graphs. The western blot displays four columns, namely, control, shCyr 61, arsenic, shCyr 61 plus arsenic, and three rows, namely, vimentin, N-cadherin, and lowercase beta actin. The two bar graphs, plotting Vimentin per lowercase beta actin, ranging from 0.0 to 1.5 in increments of 0.5 and N-cadherin per lowercase beta actin, ranging from 0.0 to 1.5 in increments of 0.5 (y-axis) across control, shCyr 6, arsenic, and shCyr 6 plus arsenic (x-axis). Figures 3G and 3H are set of one stained tissue and one bar graph. The stained tissue displays cell migration and cell invasion in control, shCyr 61, arsenic, shCyr 61 plus arsenic. The bar graphs plot relative O D, ranging from 0.0 to 15 in increments of 0.5 (y-axis) across control, shCyr 61, arsenic, and shCyr 61 plus arsenic (x-axis) for migration and invasion.
Figure 3.
The role of CYR61 in induced inhibition of migration and invasion in As-exposed human placental trophoblasts. HTR-8/SVneo cells were exposed to NaAsO2 (2μM). (A–D) HTR-8/SVneo cells were transfected with CYR61 overexpression plasmid and then exposed to NaAsO2 (2μM). (A) The efficiency of CYR61 overexpression was determined by real-time RT-PCR (n=6 samples/group). (B) Vimentin, N-cadherin, and MMP2 proteins were measured by immunoblotting (n=2 samples/group, repeated three times), and β-actin was used as a loading control. (C) Cell migration was determined by transwell migration assay (n=3 samples/group, repeated two times). (D) Cell invasion was measured by transwell invasion assay (n=3 samples/group, repeated 2 times). (E–H) HTR-8/SVneo cells were transfected with CYR61 knockdown plasmid and then exposed to NaAsO2 (2μM). (E) The efficiency of CYR61 knockdown was determined by real-time RT-PCR (n=6 samples/group). (F) Vimentin, N-cadherin, and MMP2 proteins were measured by immunoblotting (n=2 samples/group, repeated three times); β-actin was used as a loading control. (G) Cell migration was determined by transwell migration assay (n=3 samples/group, repeated two times). (H) Cell invasion was measured by transwell invasion assay (n=3 samples/group, repeated 2 times). Scale bars, 200μm. All data were expressed as mean±SEM. The numeric data are shown in Table S8. Unpaired two-tailed Student’s t-test was used for A and E. When ANOVA showed p<0.05, the Student-Neuman-Keuls (SNK) multiple comparisons tests were used for B–D and F–H. *p<0.05, **p<0.01. Note: ANOVA, analysis of variance; As, arsenic; CTRL, control; CYR61, cysteine-rich angiogenic inducer 61; CYR61 OE, CYR61 overexpression; shCYR61, CYR61 shRNA; RT-PCR, reverse transcription polymerase chain reaction; SEM, standard error of the mean; μM, μmol/L.
Figure 4A is a line graph, plotting cysteine-rich angiogenic inducer 61 messenger ribonucleic acid (percentage), ranging from 0 to 100 in increments of 20 (y-axis) across time after actinomycin D (minute), ranging from 0 to 90 in increments of 30 (x-axis) for control and arsenic. Figures 4B, 4H, 4J are bar graphs, plotting N 6-methyladenosine methylation (100 percent), ranging from 0.0 to 0.4 in increments of 0.1; methylase activity (relative), ranging from 0.0 to 1.5 in increments of 0.5; s-adenosylmethionine (nanomole per 10 begin superscript 6 end superscript cells), ranging from 0 to 10 in increments of 2 (y-axis) across control and arsenic (x-axis). Figure 4C is an illustration that displays the following information: Cysteine-rich angiogenic inducer 61 with the eukaryotic 5’ untranslated region leads to C D S. C D S with U G A C A 1348 at site 1 and G F A C U 1366 at site 2 lead to cysteine-rich angiogenic inducer 61-1. Cysteine-rich angiogenic inducer 61-1 with G G A C U 1471 at site 3, A A C U 1527 at site 4, and G G A C A 1553 at site 5 leads to cysteine-rich angiogenic inducer 61-2. Cysteine-rich angiogenic inducer 61-2 leads to the eukaryotic 3’ untranslated region. Figure 4D is a bar graph, plotting percentage input, ranging from 0 to 25 in increments of 5 (y-axis) across Cysteine-rich angiogenic inducer 61-1 and Cysteine-rich angiogenic inducer 61-2 (x-axis) for control-anti- Immunoglobulin G, control-anti- N 6-methyladenosine, arsenic-anti- Immunoglobulin G, and arsenic-anti- N 6-methyladenosine. Figure 4E is an illustration that displays interaction between cysteine-rich angiogenic inducer 61 messenger ribonucleic acid and I G F 2 BP 1 or 2 or 3 proteins. A scale depicts eukaryotic 5’ untranslated region with 1 I G F 2 BP 1 protein binding sites, 21 I G F 2 BP 2 protein binding sites, and 2 I G F 2 BP 3 protein binding sites leads to eukaryotic 3’ untranslated region. Figure 4F is a bar graph, plotting percentage input (cysteine-rich angiogenic inducer 61), ranging from 0.0 to 0.3 in increments of 0.1 (y-axis) across control-Immunoglobulin G ab, control- I G F 2 B P 2 ab, arsenic- Immunoglobulin G ab, arsenic- I G F 2 B P 2 ab (x-axis) for ribonucleic acid-Binding protein immunoprecipitation- quantitative polymerase chain reaction. Figure 4G is a bar graph, plotting relative messenger ribonucleic acid, ranging from 0 to 3 in unit increments (y-axis) across N 6-methyladenosine methylation regulated associated genes, ranging as Mettl 3, Mettl 14, Wtap, Rbm 15, Rbm 15 b under writers and Alkbh 5 and Fto under erasers (x-axis) for control and arsenic. Figure 4I is an illustration that displays the reversible N 6-methyladenosine methylation, where s-adenosylmethionine is not only a methyl donor for N 6-methyladenosine methylation but also a cofactor for the catalytic domain of Mettl 3.
Figure 4.
Effect of m6A modification on Cyr61 mRNA stability and CYR61 protein in As-exposed human placental trophoblasts. HTR-8/SVneo cells were exposed to NaAsO2 (2μM). (A) HTR8/SVneo cells were treated with actinomycin D (5μg/mL), followed by detection of Cyr61 mRNA at indicated times (n=3 samples/group, repeated two times). (B) The m6A content was measured by EpiQuik m6A methylation quantification kit (n=5 samples/group, repeated two times). (C) Schematic representation of the position of m6A motifs with CYR61 transcript. (D) The m6A-modified Cyr61 levels were measured by MeRIP-qPCR (n=3 samples/group). (E) Schematic representation of the interaction between Cyr61 mRNA and IGF2BP1/2/3 proteins. (F) The interaction between Cyr61 mRNA and IGF2BP2 proteins was detected by RIP-qPCR (n=3 samples/group). (G) The expression of m6A methyltransferases and demethylases was measured by real-time RT-PCR (n=6 samples/group). (H) The m6A methylase activity was measured by Epigenase m6A methylase activity/inhibition assay kit (n=6 samples/group). (I) A schematic model of the reversible m6A methylation. SAM is not only a methyl donor for m6A methylation but also a cofactor for catalytic domain of Mettl3. (J) Intracellular SAM content was measured by LC-MS/MS (n=6 samples/group). All data were expressed as mean±SEM. The numeric data are shown in Table S8. Unpaired two-tailed Student’s t-test was used for A, B, D, F, G, H, and J. *p<0.05, **p<0.01. Note: ActD, actinomycin D; Alkbh5, a-ketoglutarate-dependent dioxygenase alkB homolog 5; ANOVA, analysis of variance; As, arsenic; CTRL, control; CYR61, cysteine-rich angiogenic inducer 61; FTO, fat-mass obesity-associated protein; IGF2BP1/2/3, insulin-like growth factor 2 mRNA-binding protein one-half/3; LC-MS/MS, liquid chromatography–tandem mass spectrometry; m6A, N6-methyladenosine; MeRIP-qPCR, methylated RNA immunoprecipitation–qPCR; Mettl3/14, methyltransferase-like 3/14; Rbm15/15b, RNA-binding motif protein 15/15b; RIP-qPCR, RNA-binding protein immunoprecipitation–qPCR; RT-PCR, reverse transcription polymerase chain reaction; SAH, s-adenosyl-l-homocysteine; SAM, s-adenosylmethionine; SEM, standard error of the mean; μM, μmol/L; WTAP, wilms tumor 1-associating protein.
Figure 5A is a bar graph, plotting relative arsenite methyltransferase messenger ribonucleic acid, ranging from 0.0 to 1.5 in increments of 0.5 (y-axis) across control, sh arsenite methyltransferase number 1, and sh arsenite methyltransferase number 2 (x-axis). Figures 5B and 5C are bar graphs, plotting s-adenosylmethionine (nanomole per 10 begin superscript 6 end superscript cells), ranging from 0 to 10 in increments of 2 and methylase activity (relative), ranging from 0.0 to 2.0 in increments of 0.5 (y-axis) across control, arsenic, sh number 1, sh number 2, sh number 1 plus arsenic, and sh number 2 plus arsenic (x-axis). Figures 5D and 5E are line graphs, plotting cysteine-rich angiogenic inducer 61 messenger ribonucleic acid (100 percent), ranging from 0 to 120 in increments of 20 (y-axis) across time after actinomycin D (minute), ranging from 0 to 90 in increments of 30 (x-axis) for control, sh number 1, arsenic, sh number 1 plus arsenic; and control, sh number 2, arsenic, sh number 2 plus arsenic. Figure 5F is a set of one western blot and four bar graphs. The western blot displays six columns, namely, control, arsenic, sh number 1, sh number 2, sh number 1 plus arsenic, and sh number 2 plus arsenic, and five rows, namely, cysteine-rich angiogenic inducer 61, Vimentin, N-Cadherin, matrix metalloproteinases 2, lowercase beta actin. The bar graph plots cysteine-rich angiogenic inducer 61 per lowercase beta actin, ranging from 0.0 to 2.0 in increments of 0.5; Vimentin per lowercase beta actin, ranging from 0.0 to 2.0 in increments of 0.5; N-Cadherin per lowercase beta actin, ranging from 0.0 to 1.5 in increments of 0.5; matrix metalloproteinases 2 per lowercase beta actin, ranging from 0.0 to 2.0 in increments of 0.5 (y-axis) across control, arsenic, sh number 1, sh number 2, sh number 1 plus arsenic, and sh number 2 plus arsenic (x-axis). Figures 5G and 5H are set of one stained tissue and one bar graph. The stained tissue displays cell migration and cell invasion in control, arsenic, sh number 1, sh number 2, sh number 1 plus arsenic, and sh number 2 plus arsenic, respectively. The bar graph plots relative O D, ranging from 0.0 to 2.0 in increments of 0.5 (y-axis) across control, arsenic, sh number 1, sh number 2, sh number 1 plus arsenic, and sh number 2 plus arsenic (x-axis).
Figure 5.
Effect of As3MT knockdown on Cyr61 m6A modification in As-exposed human placental trophoblasts. HTR8/SVneo cells were exposed to 2μM NaAsO2 in presence or absence of As3MT-shRNA (A) The efficiency of As3MT knockdown was determined by real-time RT-PCR (n=6 samples/group). (B) Intracellular SAM content was measured by LC-MS/MS (n=6 samples/group). (C) The m6A methylase activity was measured by Epigenase m6A methylase activity/inhibition assay kit (n=6 samples/group). (D and E) HTR8/SVneo cells were treated with actinomycin D (5μg/mL), followed by detection of Cyr61 mRNA at indicated times (n=3 samples/group, repeated two times). (F) CYR61, Vimentin, N-cadherin, and MMP2 proteins were measured by immunoblotting (n=3 samples/group). (G) Cell migration was determined by transwell migration assay (n=3 samples/group, repeated two times). (H) Cell invasion was measured by transwell invasion assay (n=3 samples/group, repeated two times). Scale bars, 200μm. All data were expressed as mean±SEM. The numeric data are shown in Table S8. When ANOVA showed p<0.05, the Student-Neuman-Keuls (SNK) multiple comparisons tests were used for A–H. Asterisks indicate comparison with the control group. Hashtags indicate comparison with the As group. *p and #p<0.05, **p and ##p<0.01. Note: ActD, actinomycin D; ANOVA, analysis of variance; As, arsenic; As3MT, arsenite methyltransferase; CTRL, control; CYR61, cysteine-rich angiogenic inducer 61; LC-MS/MS, liquid chromatography–tandem mass spectrometry; MMP2, matrix metalloproteinases 2; RT-PCR, reverse transcription polymerase chain reaction; SAM, s-adenosylmethionine; shAs3MT 1#, As3MT shRNA 1#; shAs3MT 2#, As3MT shRNA 2#; SEM, standard error of the mean; μM, μmol/L.
Figures 6A and 6B are bar graphs, plotting s-adenosylmethionine (nanomole per 10 begin superscript 6 end superscript cells), ranging from 0 to 10 in increments of 2 and methylase activity (relative), ranging from 0.0 to 1.5 in increments of 0.5 (y-axis) control, s-adenosylmethionine, arsenic, and arsenic plus s-adenosylmethionine (x-axis). Figure 6C is a line graph, plotting cysteine-rich angiogenic inducer 61 messenger ribonucleic acid (100 percent), ranging from 0 to 100 in increments of 20 (y-axis) across time after actinomycin D (minute), ranging from 0 to 90 in increments of 30 (x-axis) for control, s-adenosylmethionine, arsenic, and arsenic plus s-adenosylmethionine. Figure 6D is a set of one western blot and one bar graph. The western blot displays four columns, namely, control, s-adenosylmethionine, arsenic, and arsenic plus s-adenosylmethionine, and two rows, namely, cysteine-rich angiogenic inducer 61 and lowercase beta actin. The bar graph plots cysteine-rich angiogenic inducer 61 per lowercase beta actin, ranging from 0.0 to 2.0 in increments of 0.5 (y-axis) across control, s-adenosylmethionine, arsenic, and arsenic plus s-adenosylmethionine. Figure 6E is a set of one western blot and three bar graphs. The western blot displays four columns, namely, control, s-adenosylmethionine, arsenic, and arsenic plus s-adenosylmethionine, and four rows, namely, Vimentin, N-Cadherin, matrix metalloproteinases 2, lowercase beta actin. The bar graph plots Vimentin, N-Cadherin, matrix metalloproteinases 2, ranging from 0.0 to 2.0 in increments of 0.5 (y-axis) across control, s-adenosylmethionine, arsenic, and arsenic plus s-adenosylmethionine. Figures 6F and 6G are set of one stained tissue and one bar graph. The stained tissue displays cell migration and cell invasion in control, s-adenosylmethionine, arsenic, and arsenic plus s-adenosylmethionine, respectively. The bar graph plots relative O D value, ranging from 0.0 to 1.5 in increments of 0.5 (y-axis) across, control, s-adenosylmethionine, arsenic, and arsenic plus s-adenosylmethionine (x-axis).
Figure 6.
Effect of SAM supplementation on induced inhibition of Cyr61 m6A modification in As-exposed human placental trophoblasts. HTR8/SVneo cells were incubated with NaAsO2 (2μM) in presence or absence of SAM (10μM). (A) Intracellular SAM content was measured by LC-MS/MS (n=6 samples/group). (B) The m6A methylase activity was measured by Epigenase m6A methylase activity/inhibition assay kit (n=6 samples/group). (C) HTR8/SVneo cells were treated with actinomycin D (5μg/mL), followed by detection of Cyr61 mRNA at indicated times (n=3 samples/group, repeated two times). (D and E) CYR61, Vimentin, N-cadherin, and MMP2 proteins were determined by immunoblotting (n=3 samples/group, repeated three times). (F) Cell migration was determined by transwell migration assay (n=3 samples/group, repeated two times). (G) Cell invasion was measured by transwell invasion assay (n=6 samples/group, repeated two times). Scale bars, 200μm. All data were expressed as mean±SEM. The numeric data are shown in Table S8. When ANOVA showed p<0.05, the Student-Neuman-Keuls (SNK) multiple comparisons tests were used for A–G. Asterisks indicate comparison with the control group. Hashtags indicate comparison with the As group. *p and #p<0.05, **p and ##p<0.01. Note: ANOVA, analysis of variance; As, arsenic; ActD, actinomycin D; CTRL, control; CYR61, cysteine-rich angiogenic inducer 61; MMP2, matrix metalloproteinases 2; RT-PCR, reverse transcription polymerase chain reaction; SAM, s-adenosylmethionine; SEM, standard error of the mean; μM, μmol/L.
Figures 7A, 7B, 7C, 7D, 7F, 7G, 7H, 7I are bar graphs, plotting fetal weight (gram), ranging from 0.0 to 2.0 in increments of 0.5; crown-rump length (millimeter), ranging from 0 to 30 in increments of 10; placental weight (gram), ranging from 0.00 to 0.15 in increments of 0.05; placental diameter (millimeter), ranging from 0 to 10 in increments of 2; labyrinth zone areal or placenta (percentage), ranging from 0 to 100 in increments of 20; labyrinth zone per junctional zone ratio, ranging from 0 to 10 in increments of 2; s-adenosylmethionine (micromole per gram tissue), ranging from 0 to 3 in unit increments; methylase activity (relative), ranging from 0.0 to 1.5 in increments 0.5 (y-axis) across control, folic acid, arsenic, and arsenic plus folic acid (x-axis). Figure 7E is a stained tissue that displays placental cross-section with labyrinth zone and junctional zone ratio in control, folic acid, arsenic, and arsenic plus folic acid. Figure 7J is a set of one western blot and two bar graphs. The western blot display four columns, namely, control, folic acid, arsenic, and arsenic plus folic acid, and three rows, namely, cysteine-rich angiogenic inducer 61, matrix metalloproteinases 2, and lowercase beta actin. The two bar graphs plot cysteine-rich angiogenic inducer 61 per lowercase beta actin, ranging from 0.0 to 1.5 in increments of 0.5 and matrix metalloproteinases 2 per lowercase beta actin, ranging from 0.0 to 2.0 in increments of 0.5 (y-axis) across control, folic acid, arsenic, and arsenic plus folic acid (x-axis).
Figure 7.
Effect of FA supplementation on placental development and fetal growth restriction in As-exposed mice. Pregnant mice were divided into four groups: CTRL, FA, As, and As+FA groups. In the As and As+FA groups, pregnant mice drank ultrapure water containing NaAsO2 (15mg/L) throughout pregnancy. In FA and As+FA groups, pregnant mice were administered FA (150μg/kg) by gavage daily throughout pregnancy. All pregnant mice were sacrificed on GD18. (A) Fetal weight (n=8 dams/group, 12–15 fetuses per dam). (B) Crown–rump length (n=8 dams/group, 12–15 fetuses per dam). (C) Placental weight (n=8 dams/group, 12–15 fetuses per dam). (D) Placental diameter (n=8 dams/group, 12–15 fetuses per dam). (E) Placental cross-section was stained with H&E. Scale bars, 500μm (left); 200μm (right) (n=6 mice/group). (F) The percentage of labyrinth zone area in the entire placenta area (n=6 mice/group). (G) The ratio of cross-sectional thickness of labyrinth zone to junctional zone (n=6 mice/group). (H) Placental SAM content was determined by LC-MS/MS (n=6 mice/group). (I) The m6A methylase activity was measured by Epigenase m6A methylase activity/inhibition assay kit (n=6 mice/group). (J) Placental CYR61 and MMP2 were measured by immunoblotting (n=3 mice/group, repeated two times). All data were expressed as mean±SEM. The numeric data are shown in Table S8. When ANOVA showed p<0.05, the Student-Neuman-Keuls (SNK) multiple comparisons tests were used for A–D and F–J. *p<0.05, **p<0.01. Note: ANOVA, analysis of variance; As, arsenic; CTRL, control; CYR61, cysteine-rich angiogenic inducer 61; FA, folic acid; H&E, hematoxylin and eosin; JZ, junctional zone; LC-MS/MS, liquid chromatography–tandem mass spectrometry; LZ, labyrinth zone; MMP2, matrix metalloproteinases 2; SAM, s-adenosylmethionine; SEM, standard error of the mean.
Figures 8A and 8B are graphs, plotting urinary arsenic (microgram per liter), ranging from 0 to 50 in increments of 10 and plasma cysteine-rich angiogenic inducer 61 (picogram per milliliter), ranging from 0 to 600 in increments of 200 (y-axis) across appropriate for gestational age and small for gestational age (x-axis). Figures 8C and 8D are line graphs, plotting plasma cysteine-rich angiogenic inducer 61 (picogram per milliliter), ranging from 0 to 600 in increments of 200 and 0 to 400 in increments of 100 (y-axis) across urinary arsenic (microgram per liter), ranging from 0 to 50 in increments of 10 (x-axis) for appropriate for gestational age and small for gestational age. Figure 8E is a set of one stained tissue and one bar graph. The stained tissue displays two rows, namely, appropriate for gestational age and small for gestational age under placental cysteine-rich angiogenic inducer 61 positive cells. The bar graph plots cysteine-rich angiogenic inducer 61 positive cells (percentage), ranging from 0 to 50 in increments of 10 (y-axis) across appropriate for gestational age and small for gestational age (x-axis). Figure 8F is a set of one western blot and three bar graphs. The western blot displays two columns, namely, appropriate for gestational age and small for gestational age, and four rows, namely, Vimentin, matrix metalloproteinases 2, matrix metalloproteinases 9, and lowercase beta actin. The three bar graphs plots, Vimentin per lowercase beta actin, matrix metalloproteinases 2 per lowercase beta actin, matrix metalloproteinases 9 per lowercase beta actin, ranging from 0.0 to 1.5 in increments of 0.5 (y-axis) across appropriate for gestational age and small for gestational age (x-axis).
Figure 8.
Based on a case–control study: association among maternal urinary As concentration, plasma CYR61 content, and fetal growth restriction. (A) Maternal urinary As concentration in AGA and SGA infants was determined by hydride generation-atomic fluorescence spectrometry (n=45 human sample/group). (B) Maternal plasma CYR61 content in AGA and SGA infants was measured by ELISA (n=45 human sample/group). (C) The correlation between maternal urinary As concentration and plasma CYR61 content in AGA infants (n=45 human sample). (D) The correlation between maternal urinary As concentration and plasma CYR61 content in SGA infants (n=45 human sample). (E) Placental CYR61-positive cells in SGA infants and AGA infants were stained by immunohistochemistry (n=18 human sample/group). Representative histology images were showed. Blue arrows indicate CYR61-positive cells. Scale bars, 20μm. (F) Placental vimentin, MMP2, and MMP9 were detected by immunoblotting (n=18 human sample/group). The data in A and B are expressed as mean±SD. The data in A–D are represented by dots indicating individual values. The data in E and F are expressed as mean±SEM. The numeric data are shown in Table S8. Two-tailed Student’s t-test was used for A, B, E, and F. The Spearman correlation was used for C and D. *p<0.05, **p<0.01. Note: AGA, appropriate for gestational age; As, arsenic; CYR61, cysteine-rich angiogenic inducer 61; ELISA, enzyme-linked immunosorbent assay; SD, standard deviation; SEM, standard error of the mean; SGA, small for gestational age.

References

    1. Smith GCS. 2021. Developing novel tests to screen for fetal growth restriction. Trends Mol Med 27(8):743–752, PMID: , 10.1016/j.molmed.2021.05.006. - DOI - PubMed
    1. Baschat AA, Galan HL, Lee W, DeVore GR, Mari G, Hobbins J, et al. . 2022. The role of the fetal biophysical profile in the management of fetal growth restriction. Am J Obstet Gynecol 226(4):475–486, PMID: , 10.1016/j.ajog.2022.01.020. - DOI - PubMed
    1. Temming LA, Dicke JM, Stout MJ, Rampersad RM, Macones GA, Tuuli MG, et al. . 2017. Early second-trimester fetal growth restriction and adverse perinatal outcomes. Obstet Gynecol 130(4):865–869, PMID: , 10.1097/AOG.0000000000002209. - DOI - PMC - PubMed
    1. Cnattingius S, Kramer MS, Norman M, Ludvigsson JF, Fang F, Lu D. 2019. Investigating fetal growth restriction and perinatal risks in appropriate for gestational age infants: using cohort and within-sibling analyses. BJOG 126(7):842–850, PMID: , 10.1111/1471-0528.15563. - DOI - PubMed
    1. Saget S, Cong R, Decourtye L, Endale ML, Martinerie L, Girardet C, et al. . 2020. Changes in circulating miRNA19a-3p precede insulin resistance programmed by intra-uterine growth retardation in mice. Mol Metab 42:101083, PMID: , 10.1016/j.molmet.2020.101083. - DOI - PMC - PubMed

Publication types